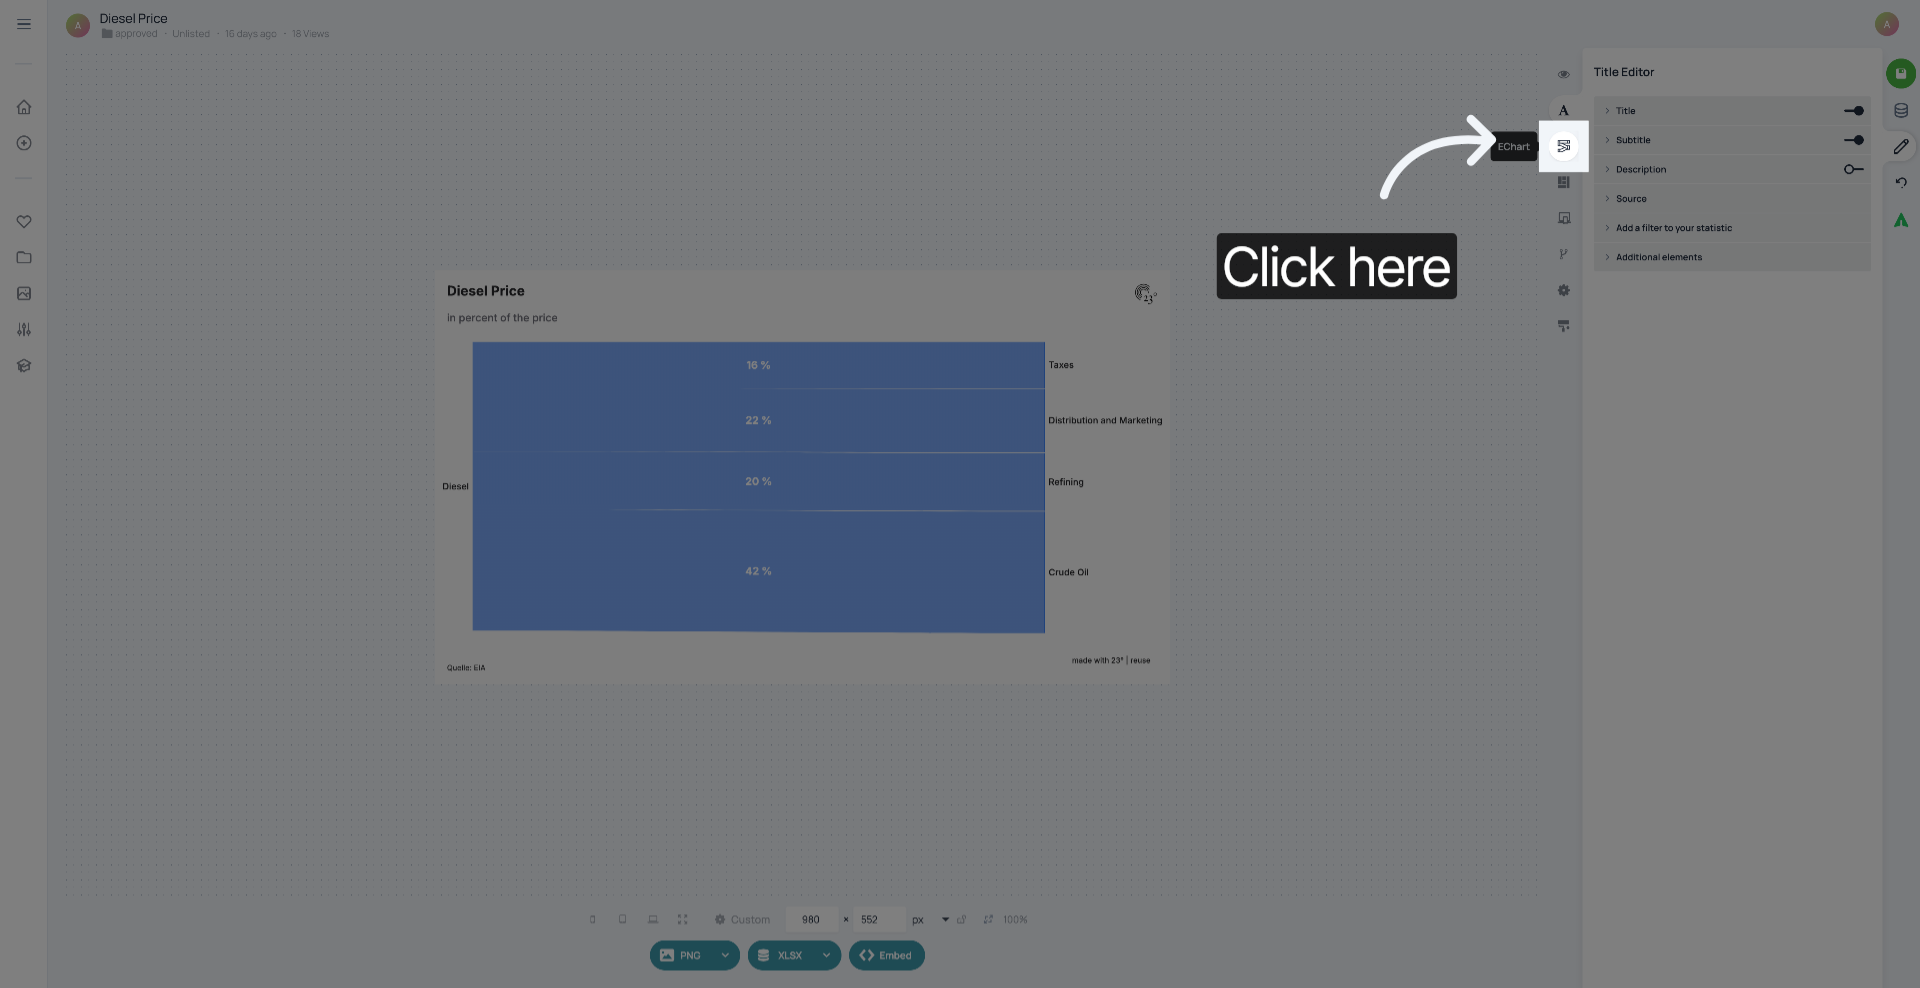
Go to the Chart Editor
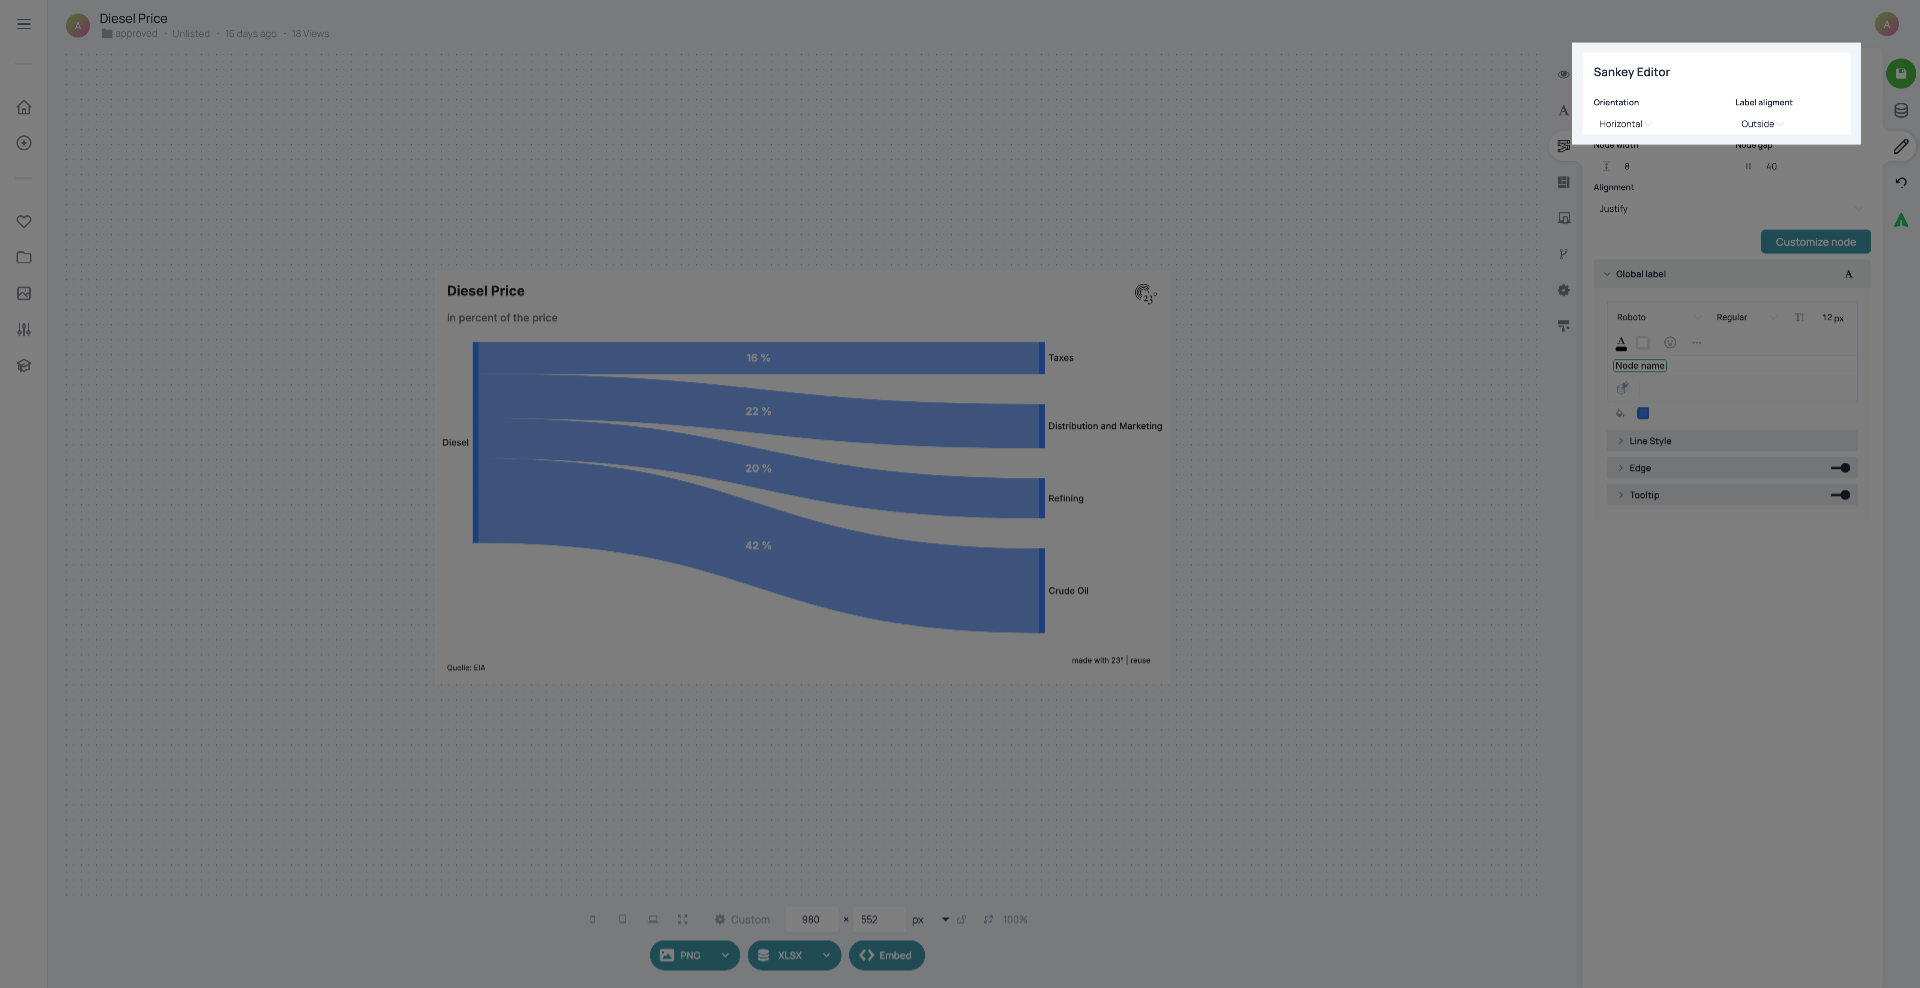
In "Orientation", you can change if your Sankey goes from the left to the right or from the top to the bottom. "Label alignment" either aligns the labels inside or outside the chart. In this case, we used horizontal orientation and outside label alignment.
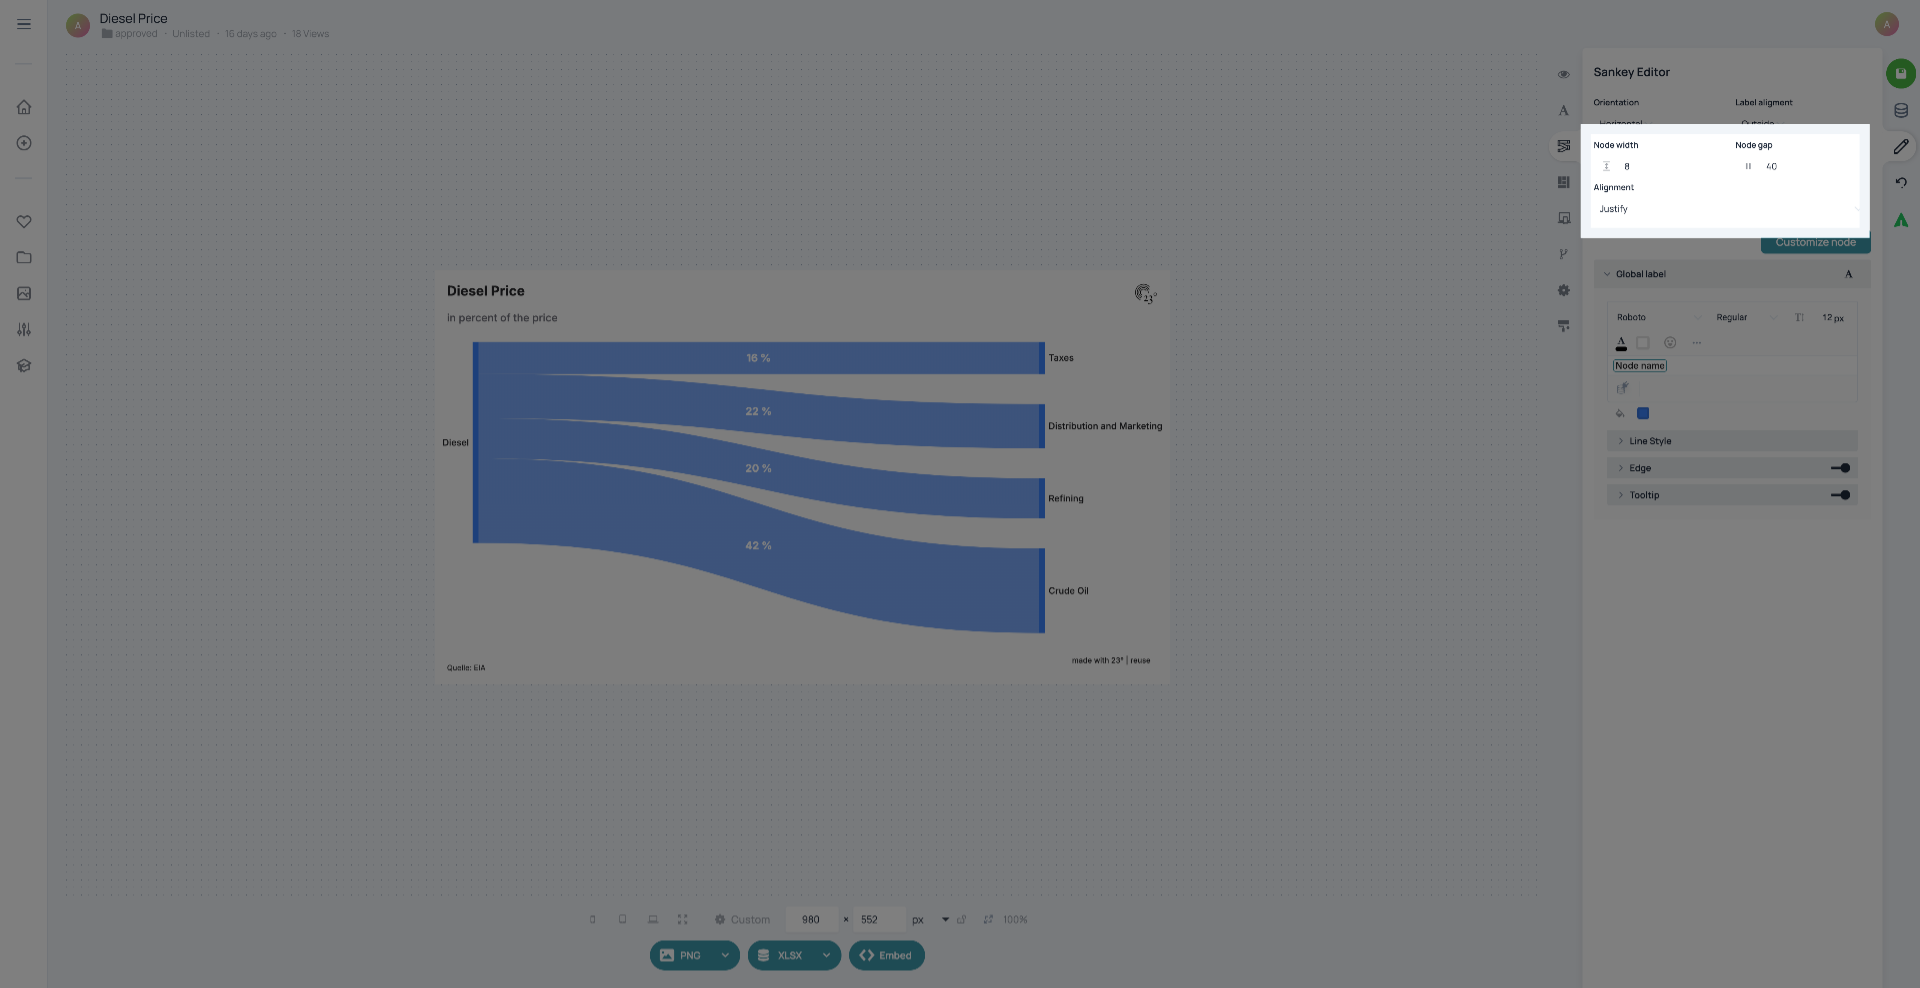
"Node width" determines the width of the lines that you see next to the labels on the borders of the chart. In "Node gap" you can customize the distance between the nodes at the right.
In the global label settings, you can customize the font and size for all of thee labels.
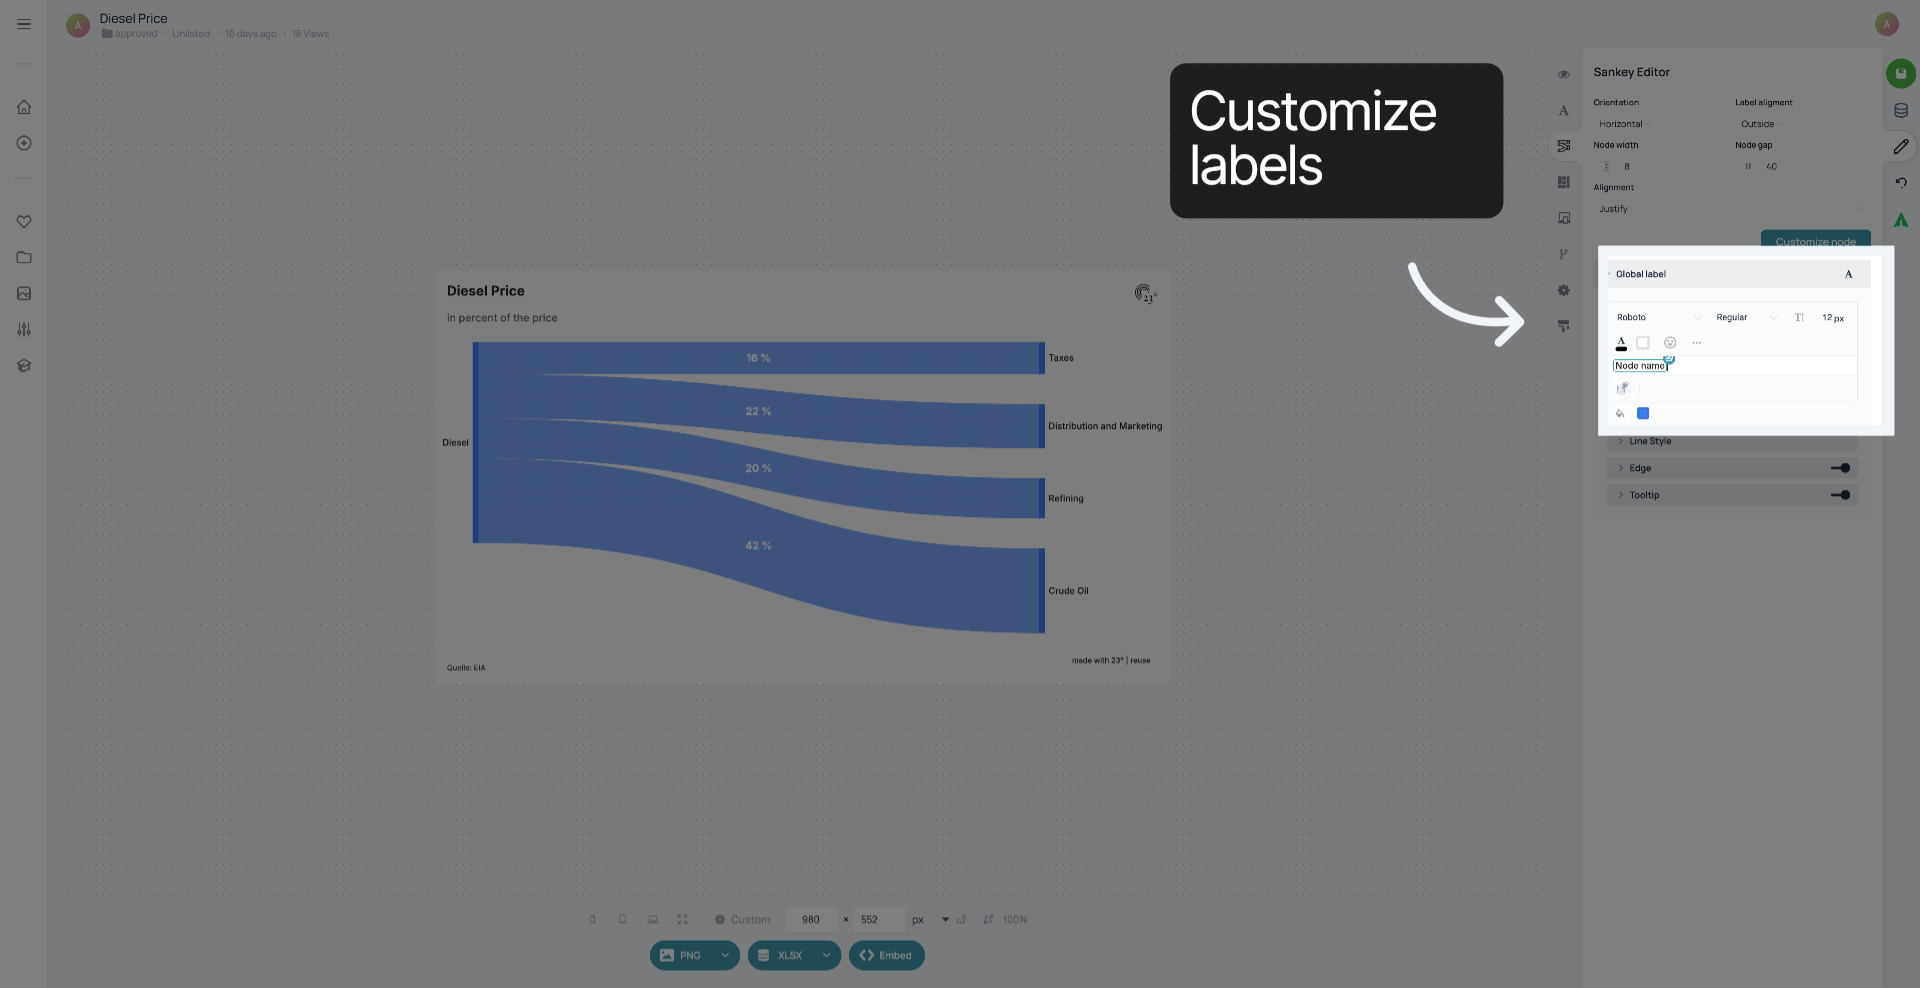
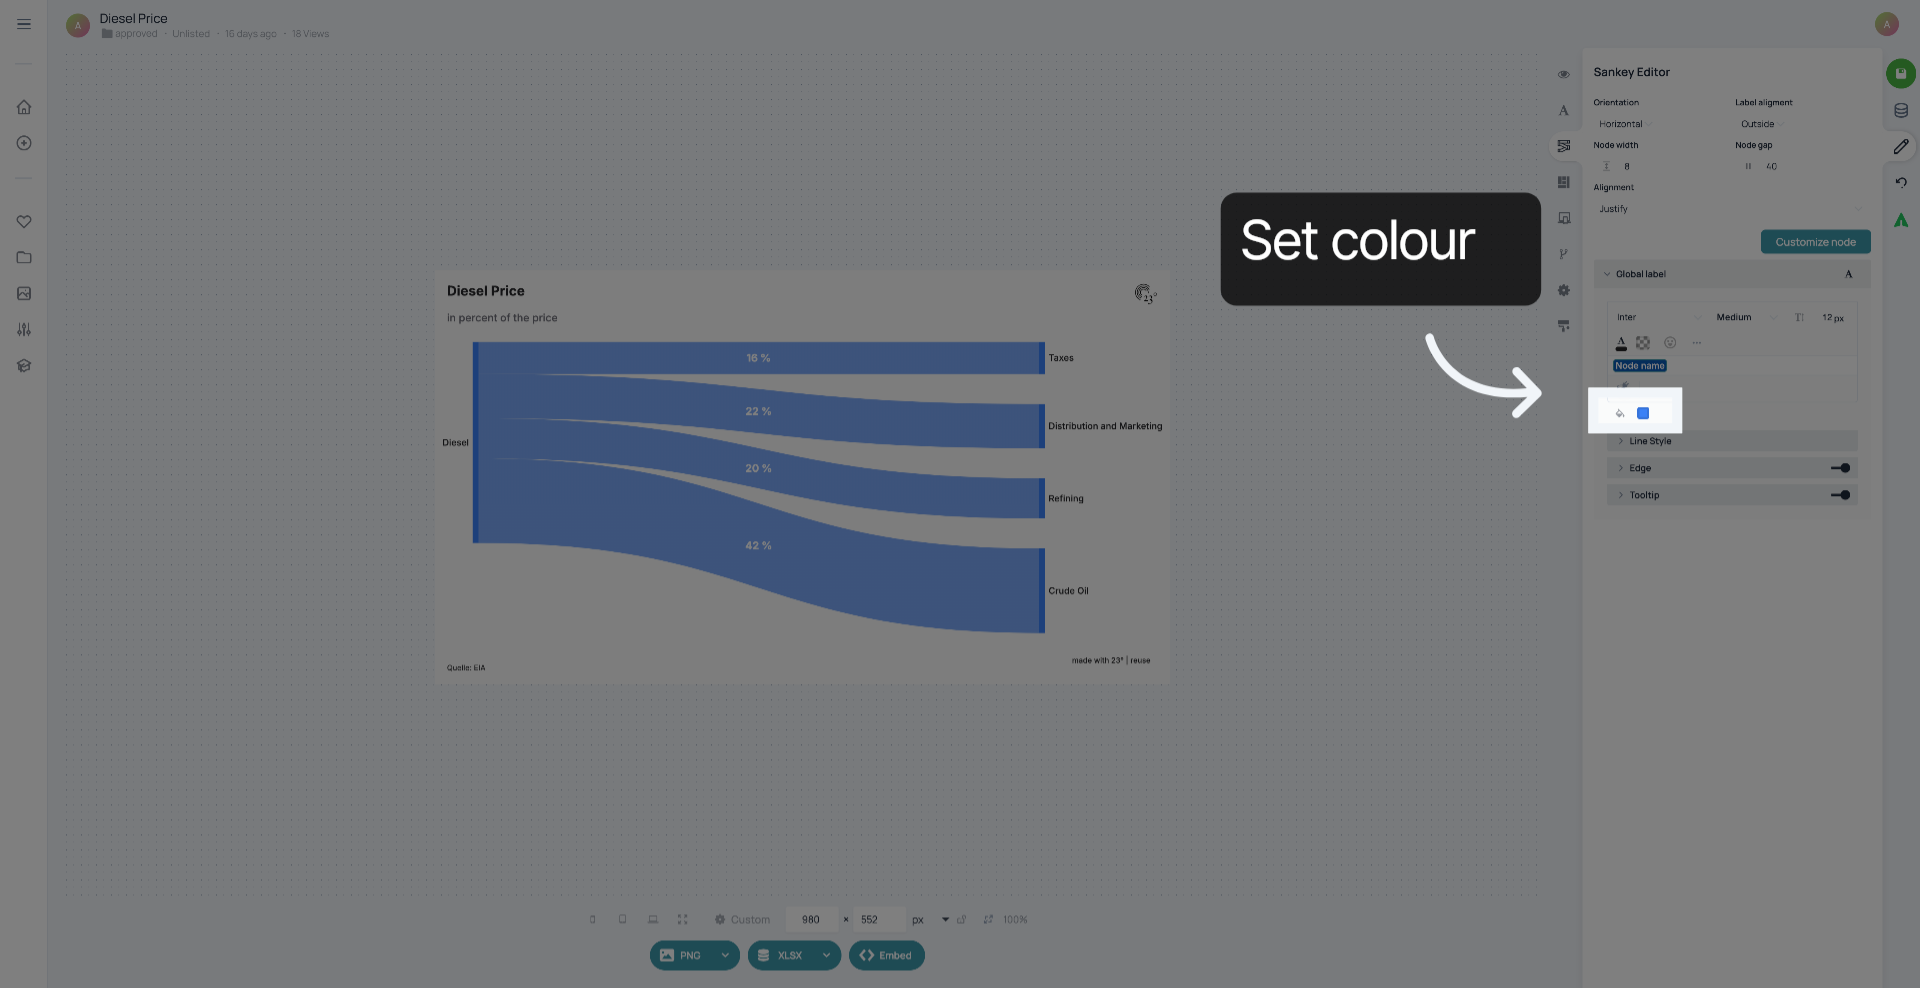
Below that, you can set the colour of the nodes in your sankey diagram.
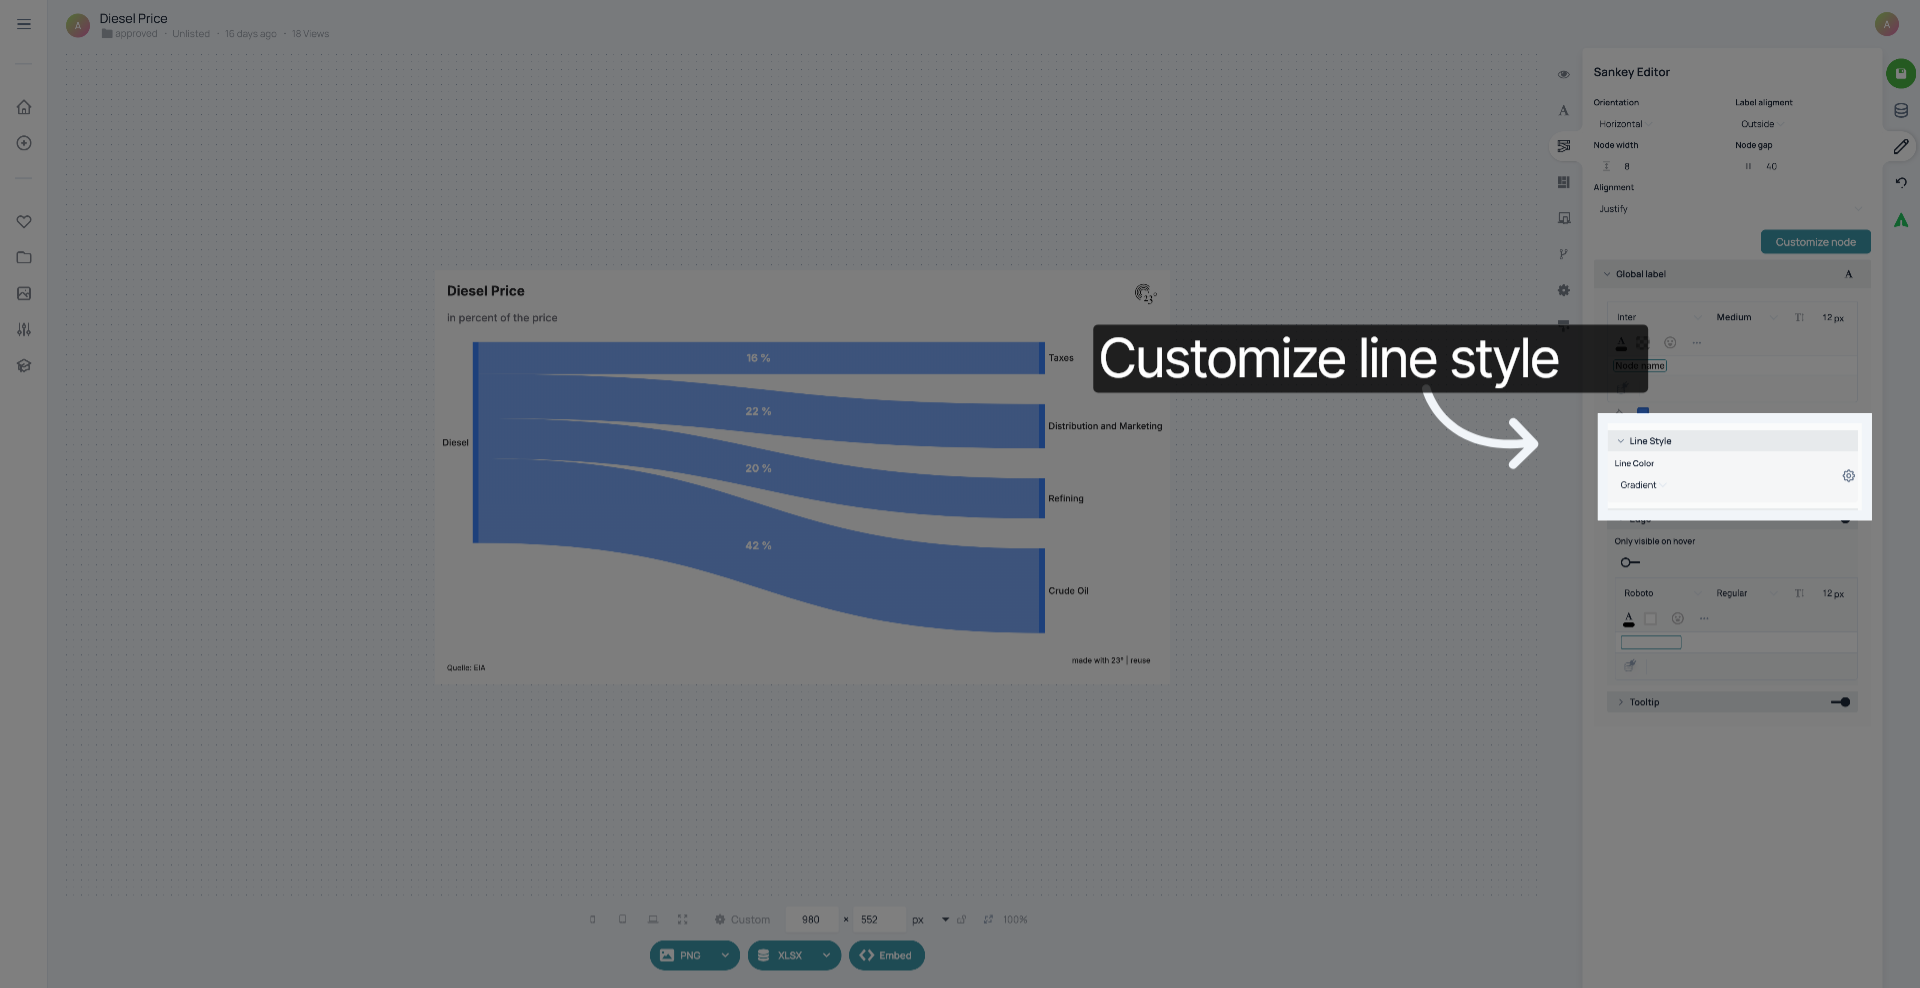
You can use the line style settings to customize the colour and the curves of thee lines in your sankey.
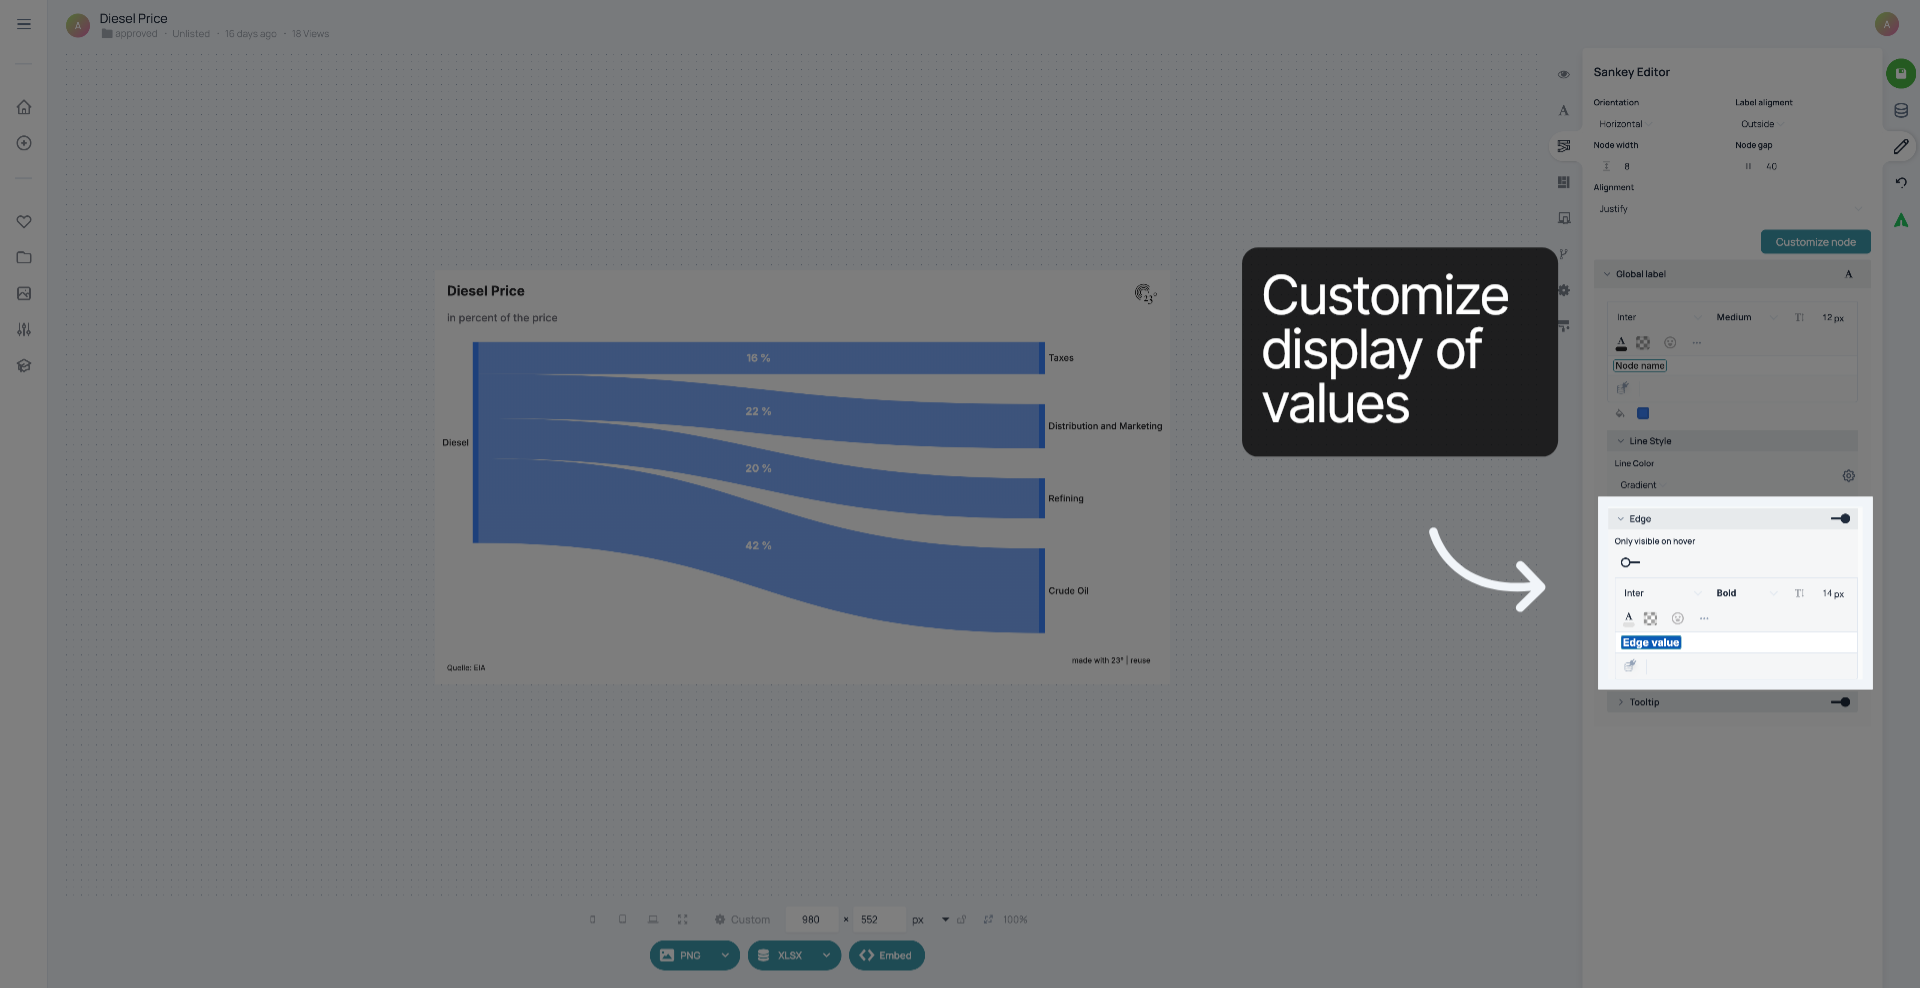
You can activate "Edge" to show values in your sankey. Here you can also style the font and determine, whether the values are visible all the time or only on hover.
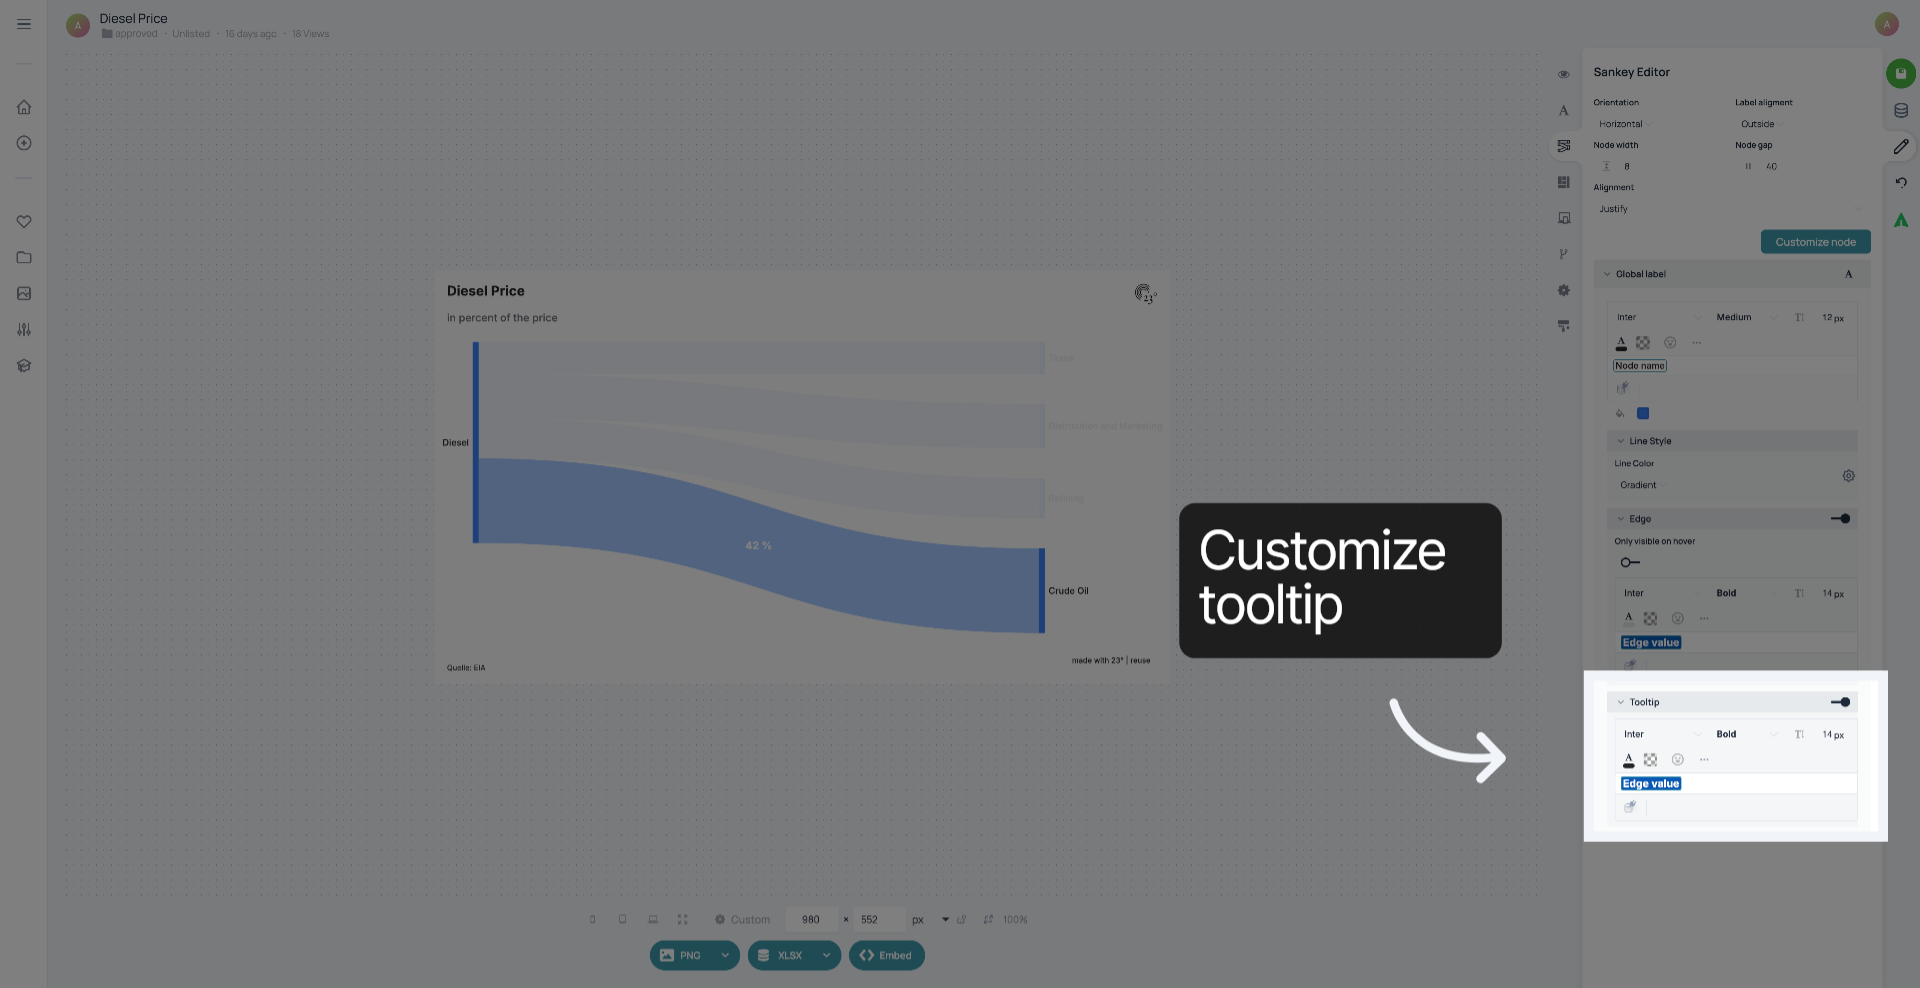
If you want additional information to be visible on click, you can activate tooltip and customize the font and size here.
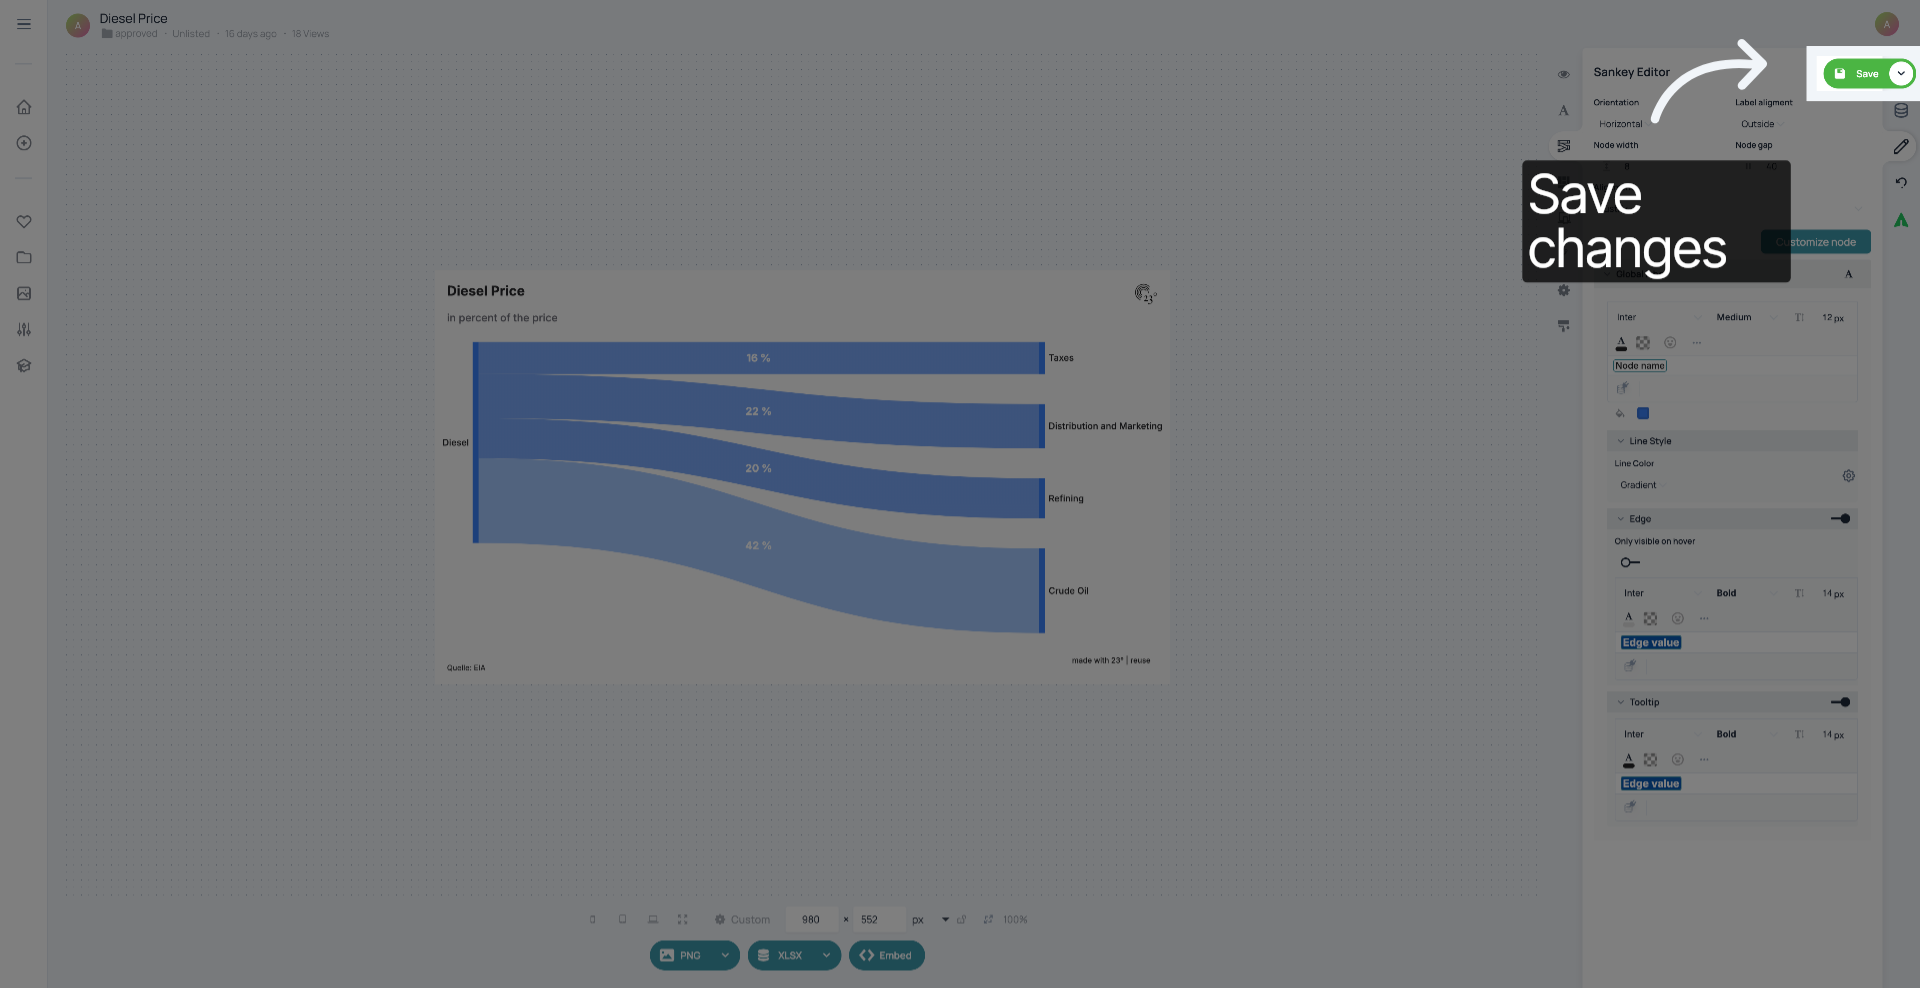
Don't forget to save your changes.
You have successfully customized the global settings of your Sankey diagram.