Configure Animation Settings For Line Charts
This tutorial guides you through configuring animation settings for line charts to enhance visual presentation.
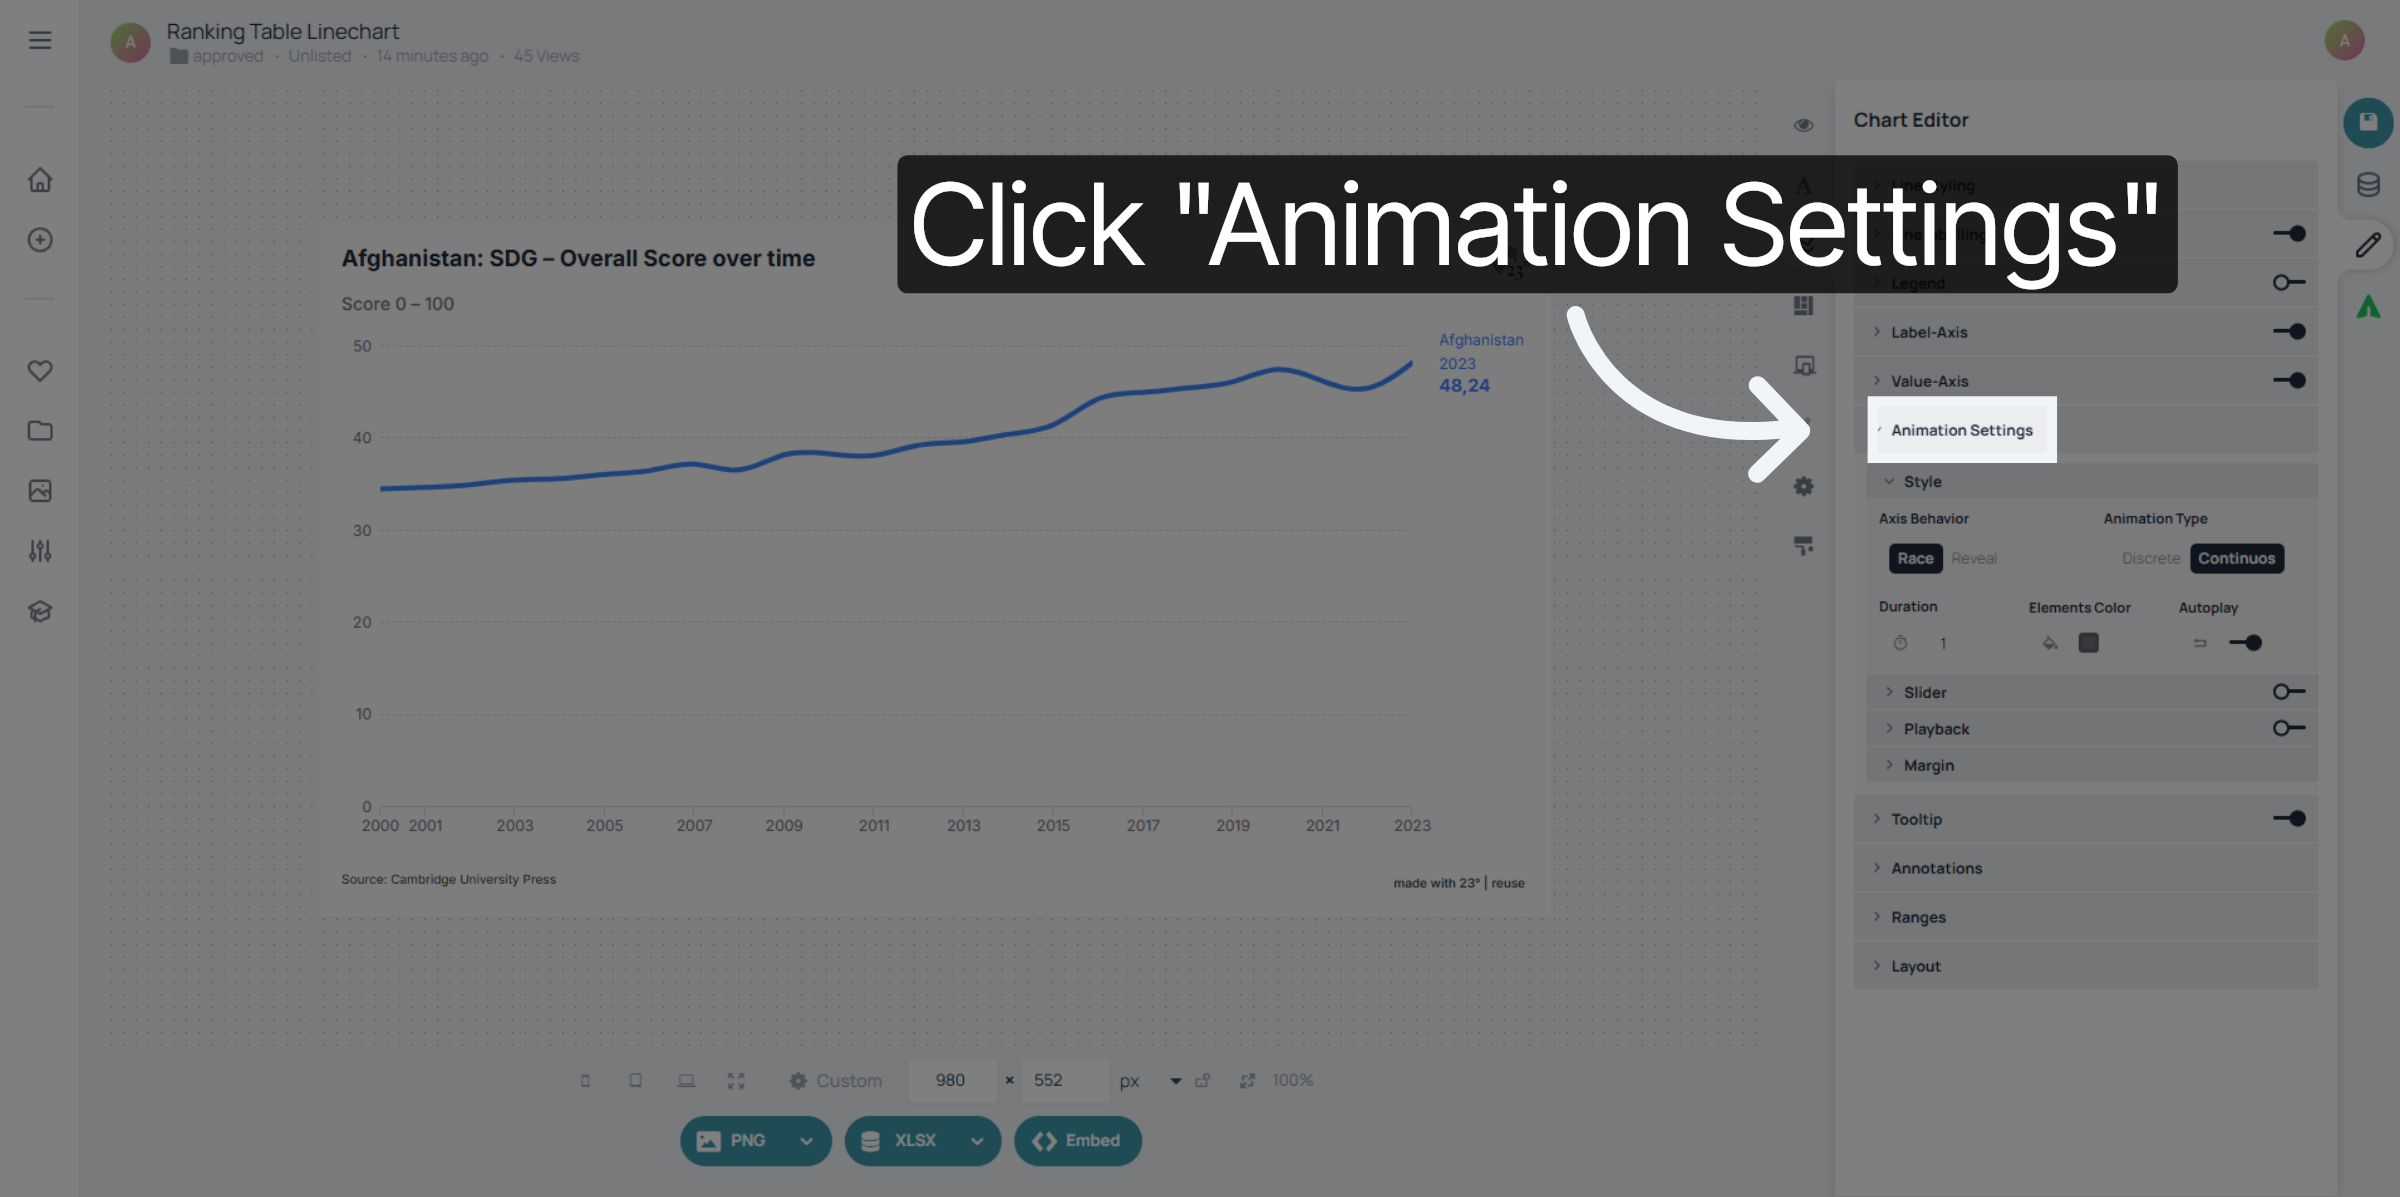
Click the Animation Settings option to access the animation configuration panel.
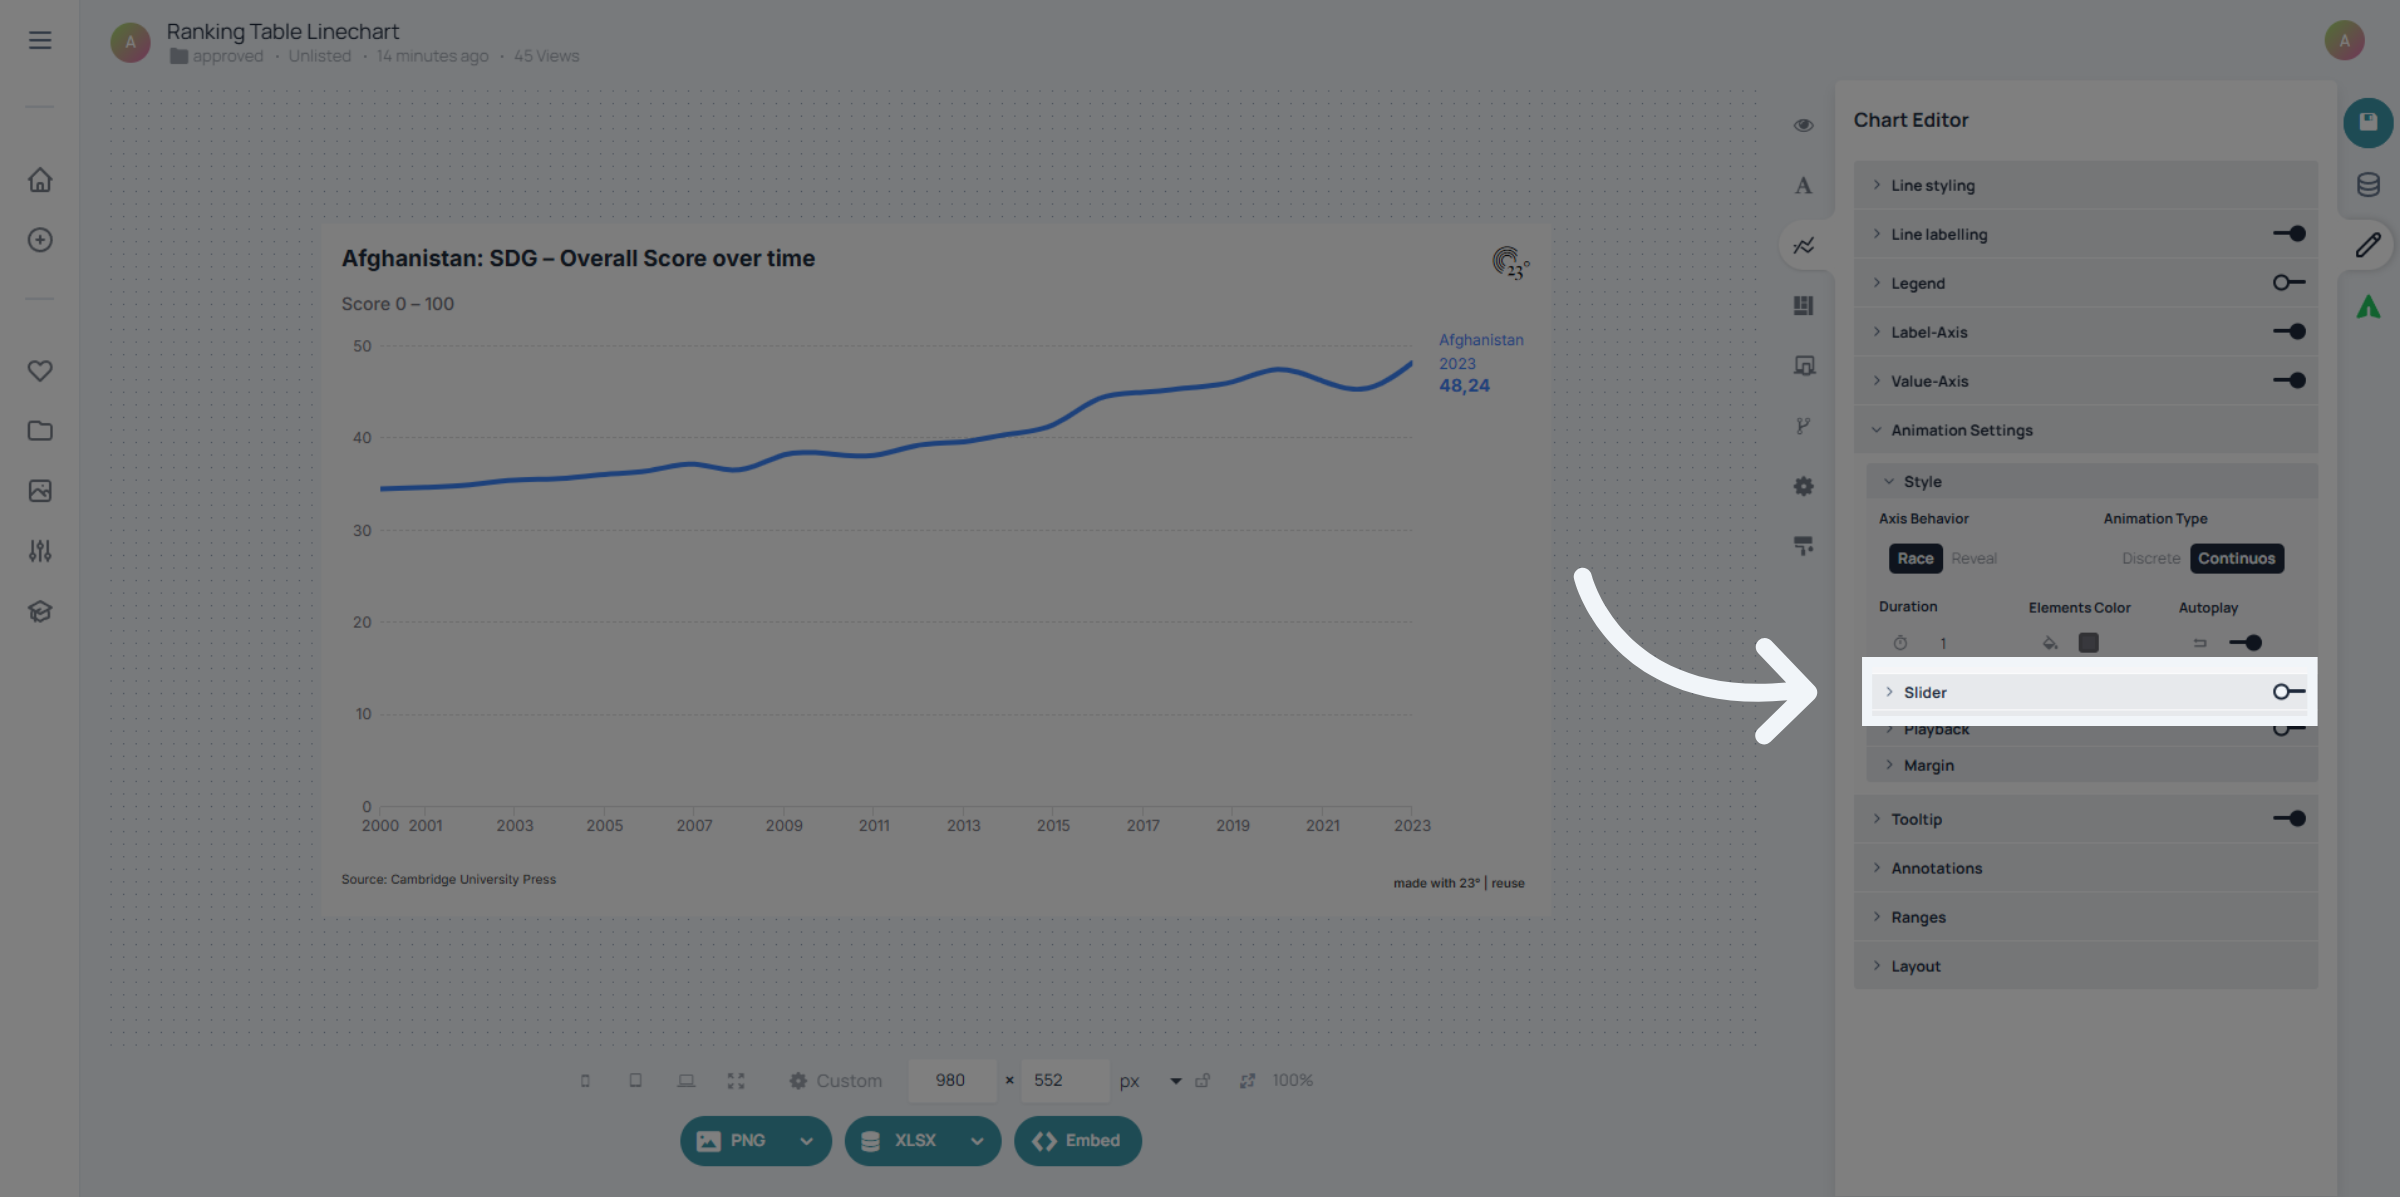
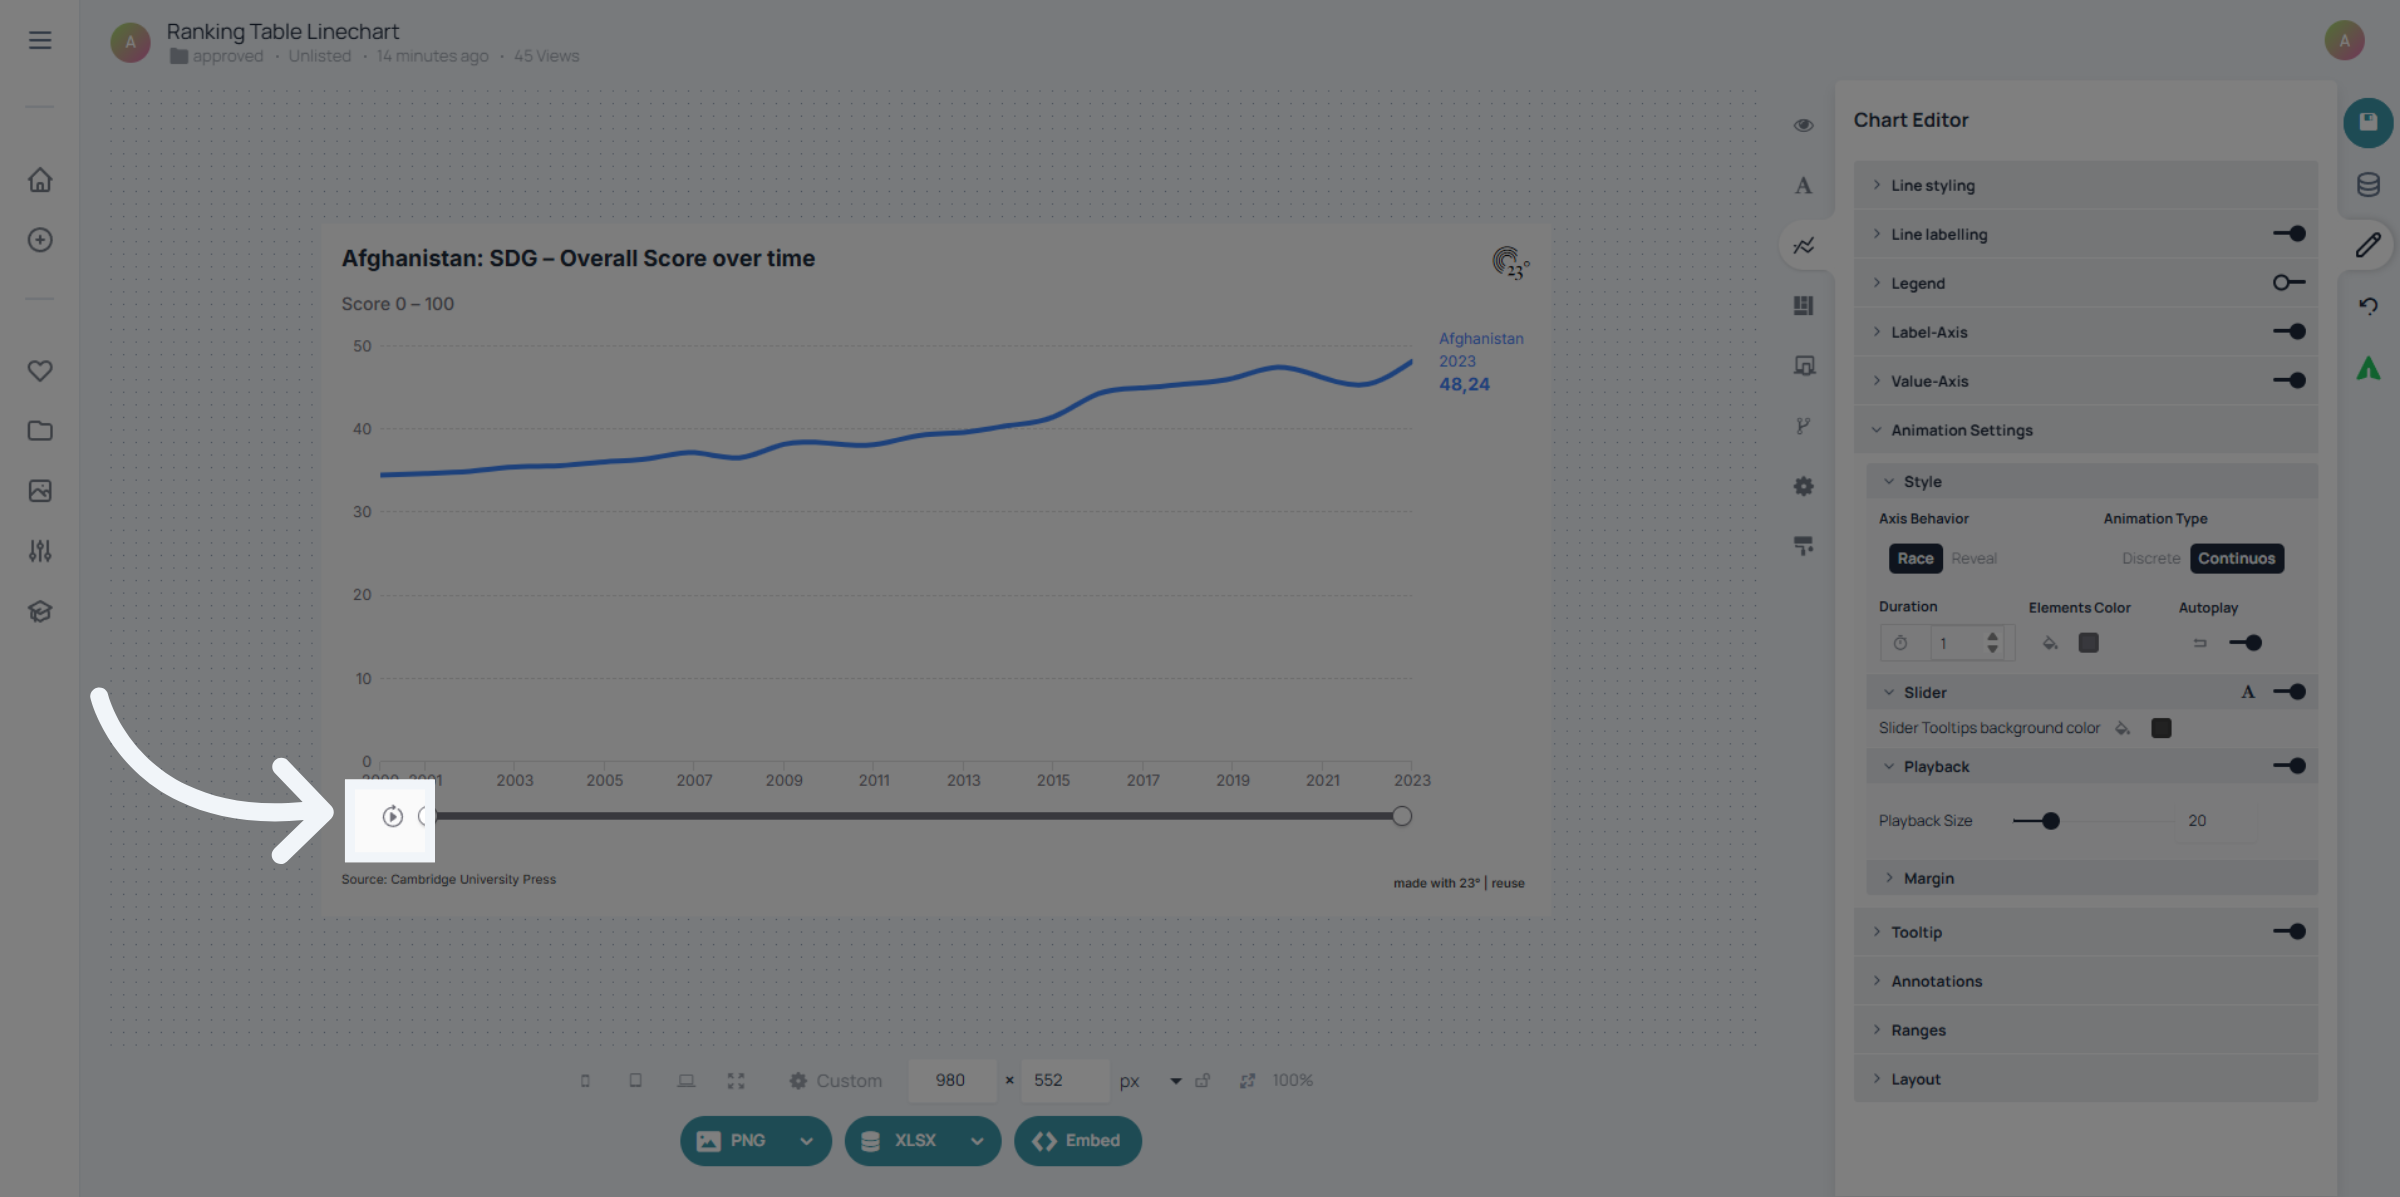
In the Linechart you can add a slider..
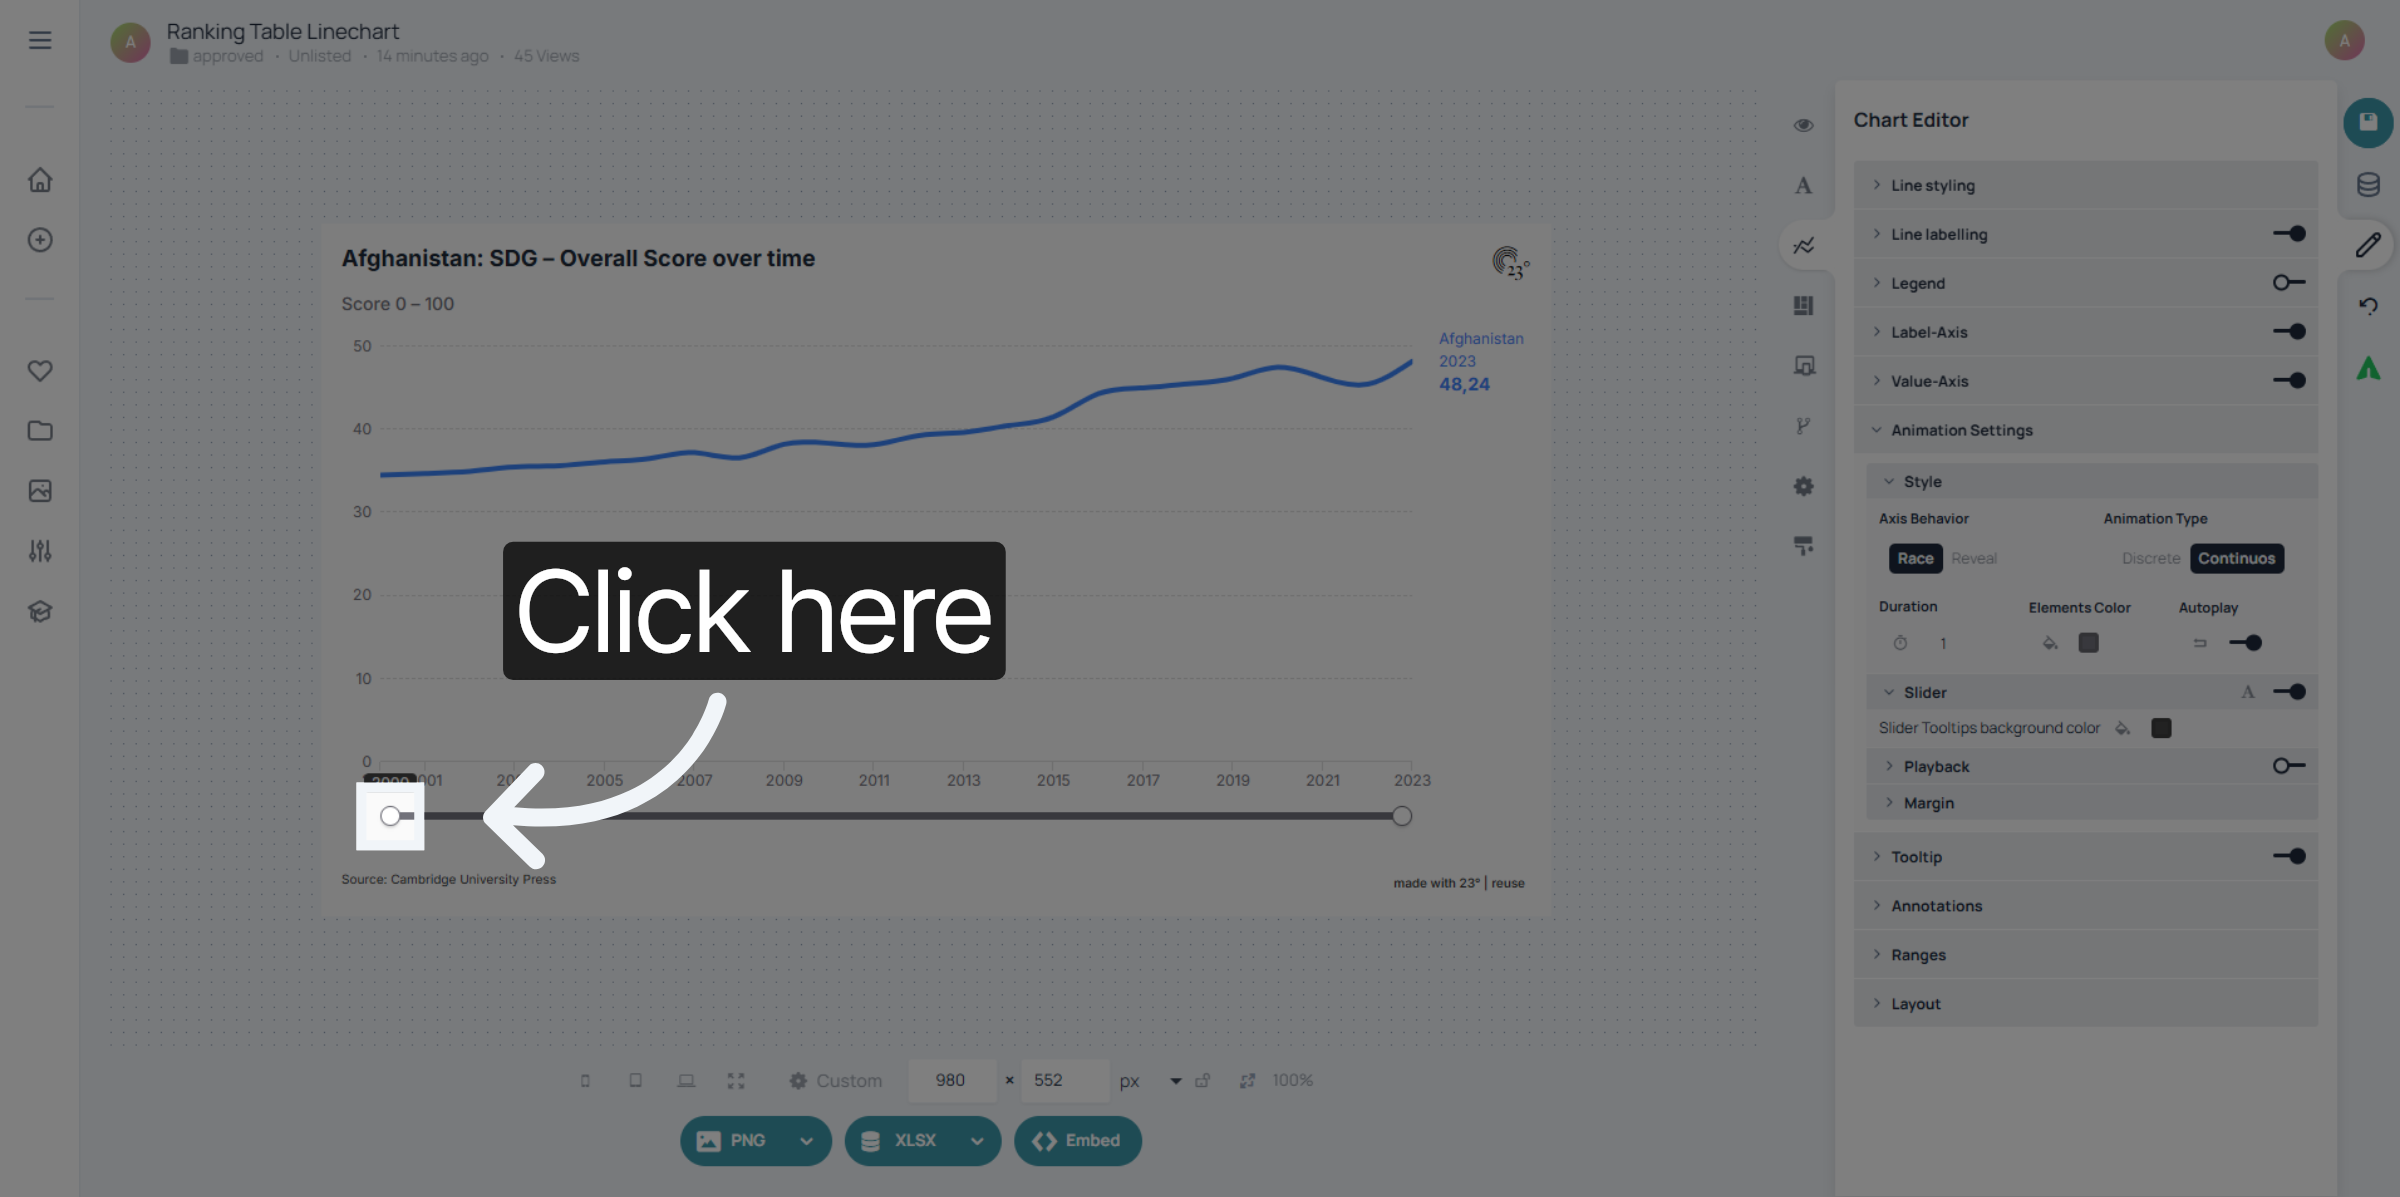
with which you can drag left to right to select the timelines that you need.
You have a Playback Button...
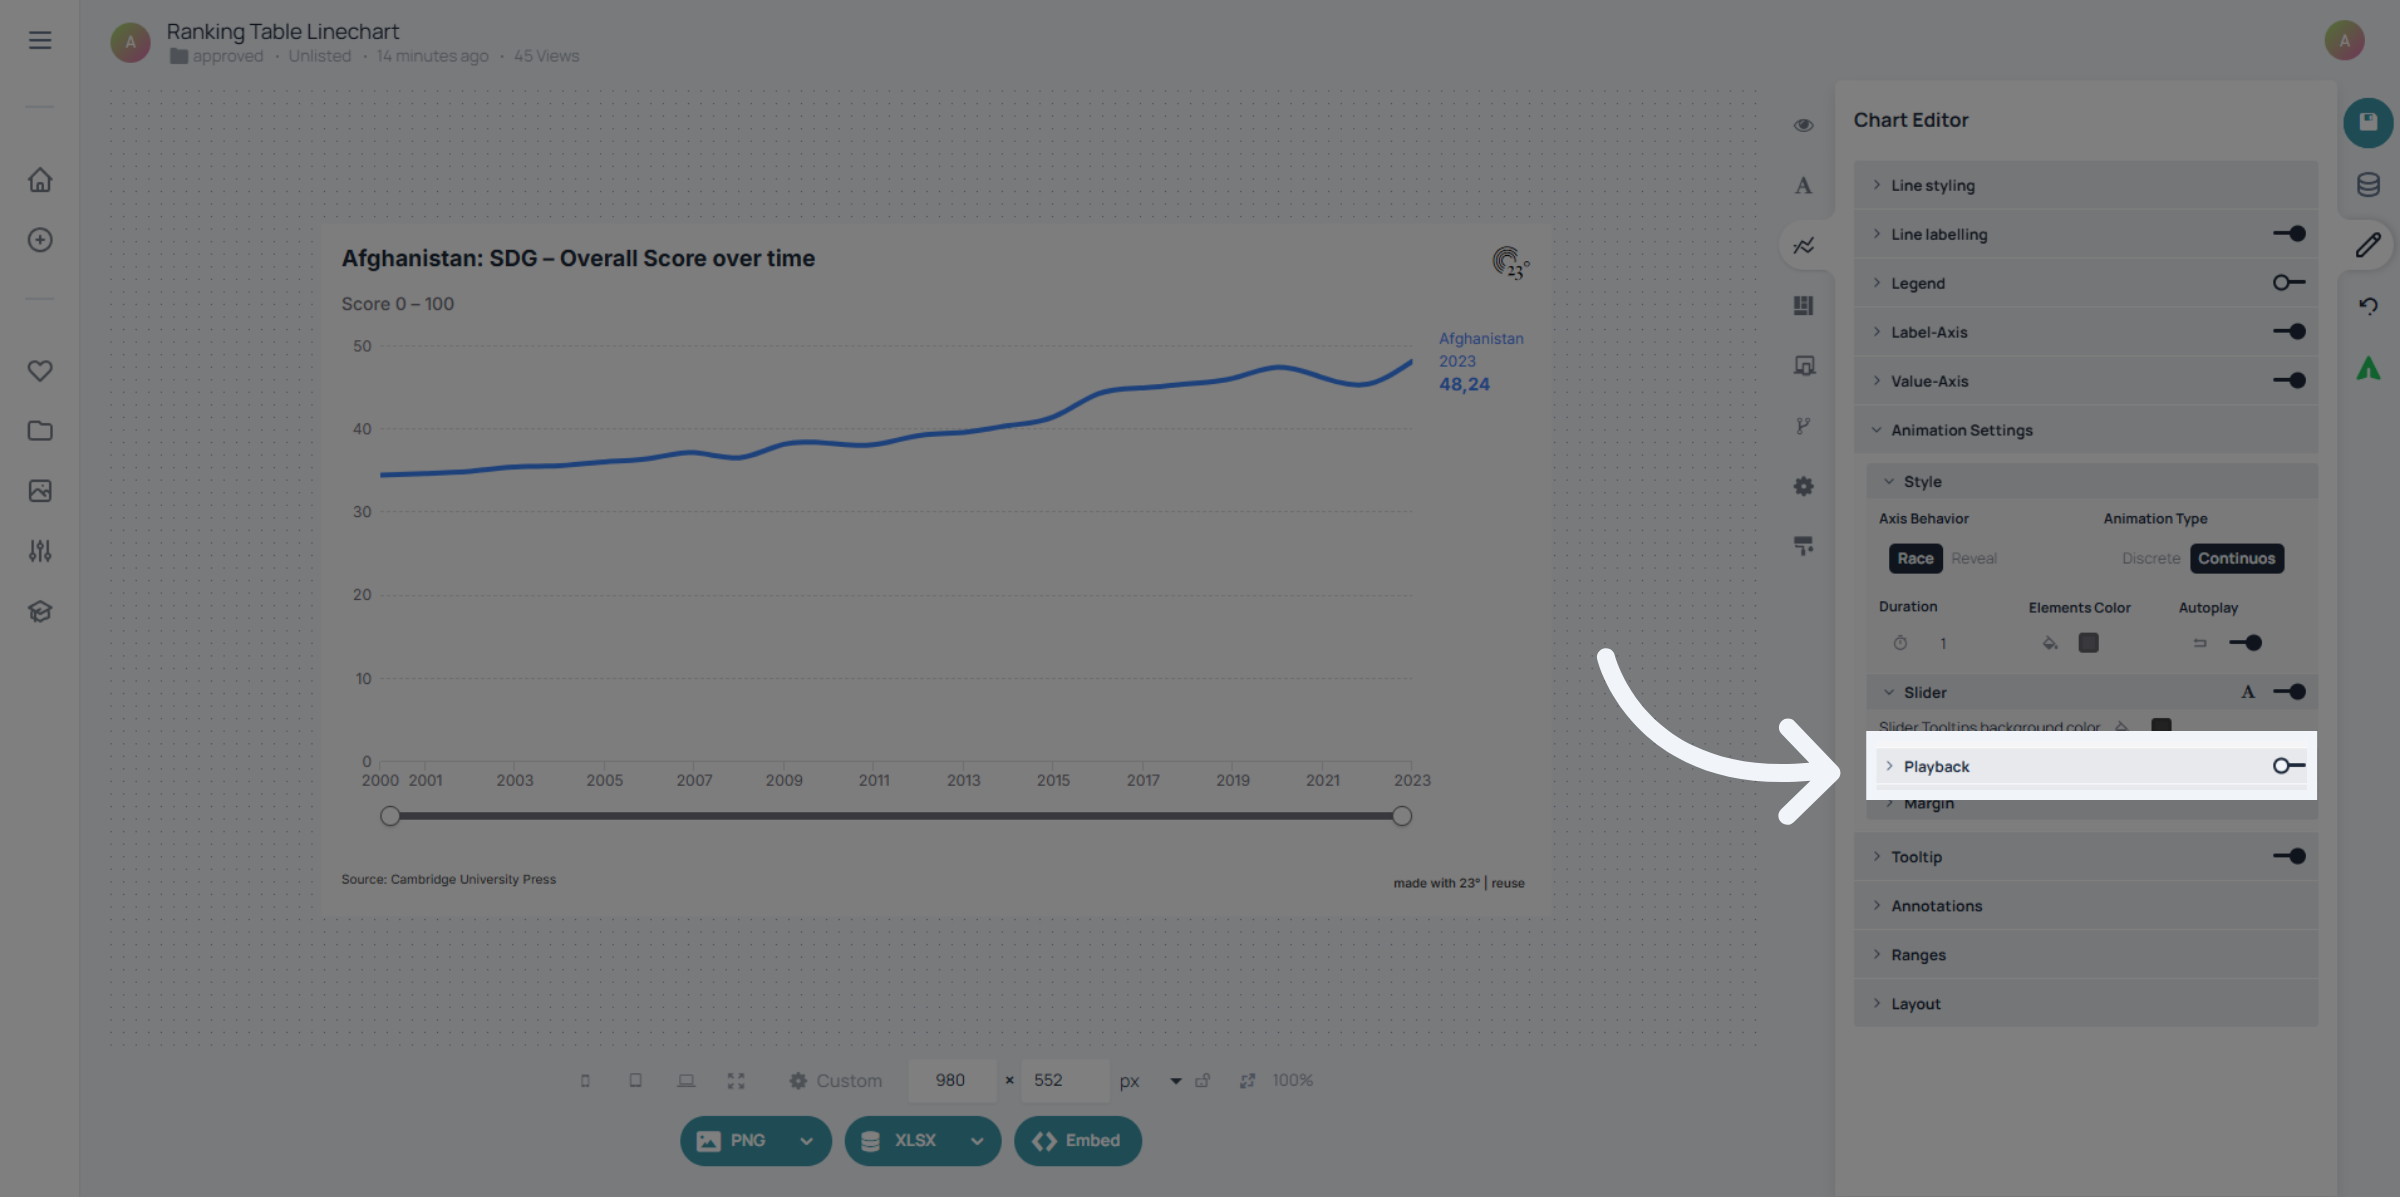
that lets you trigger the automation yourself.
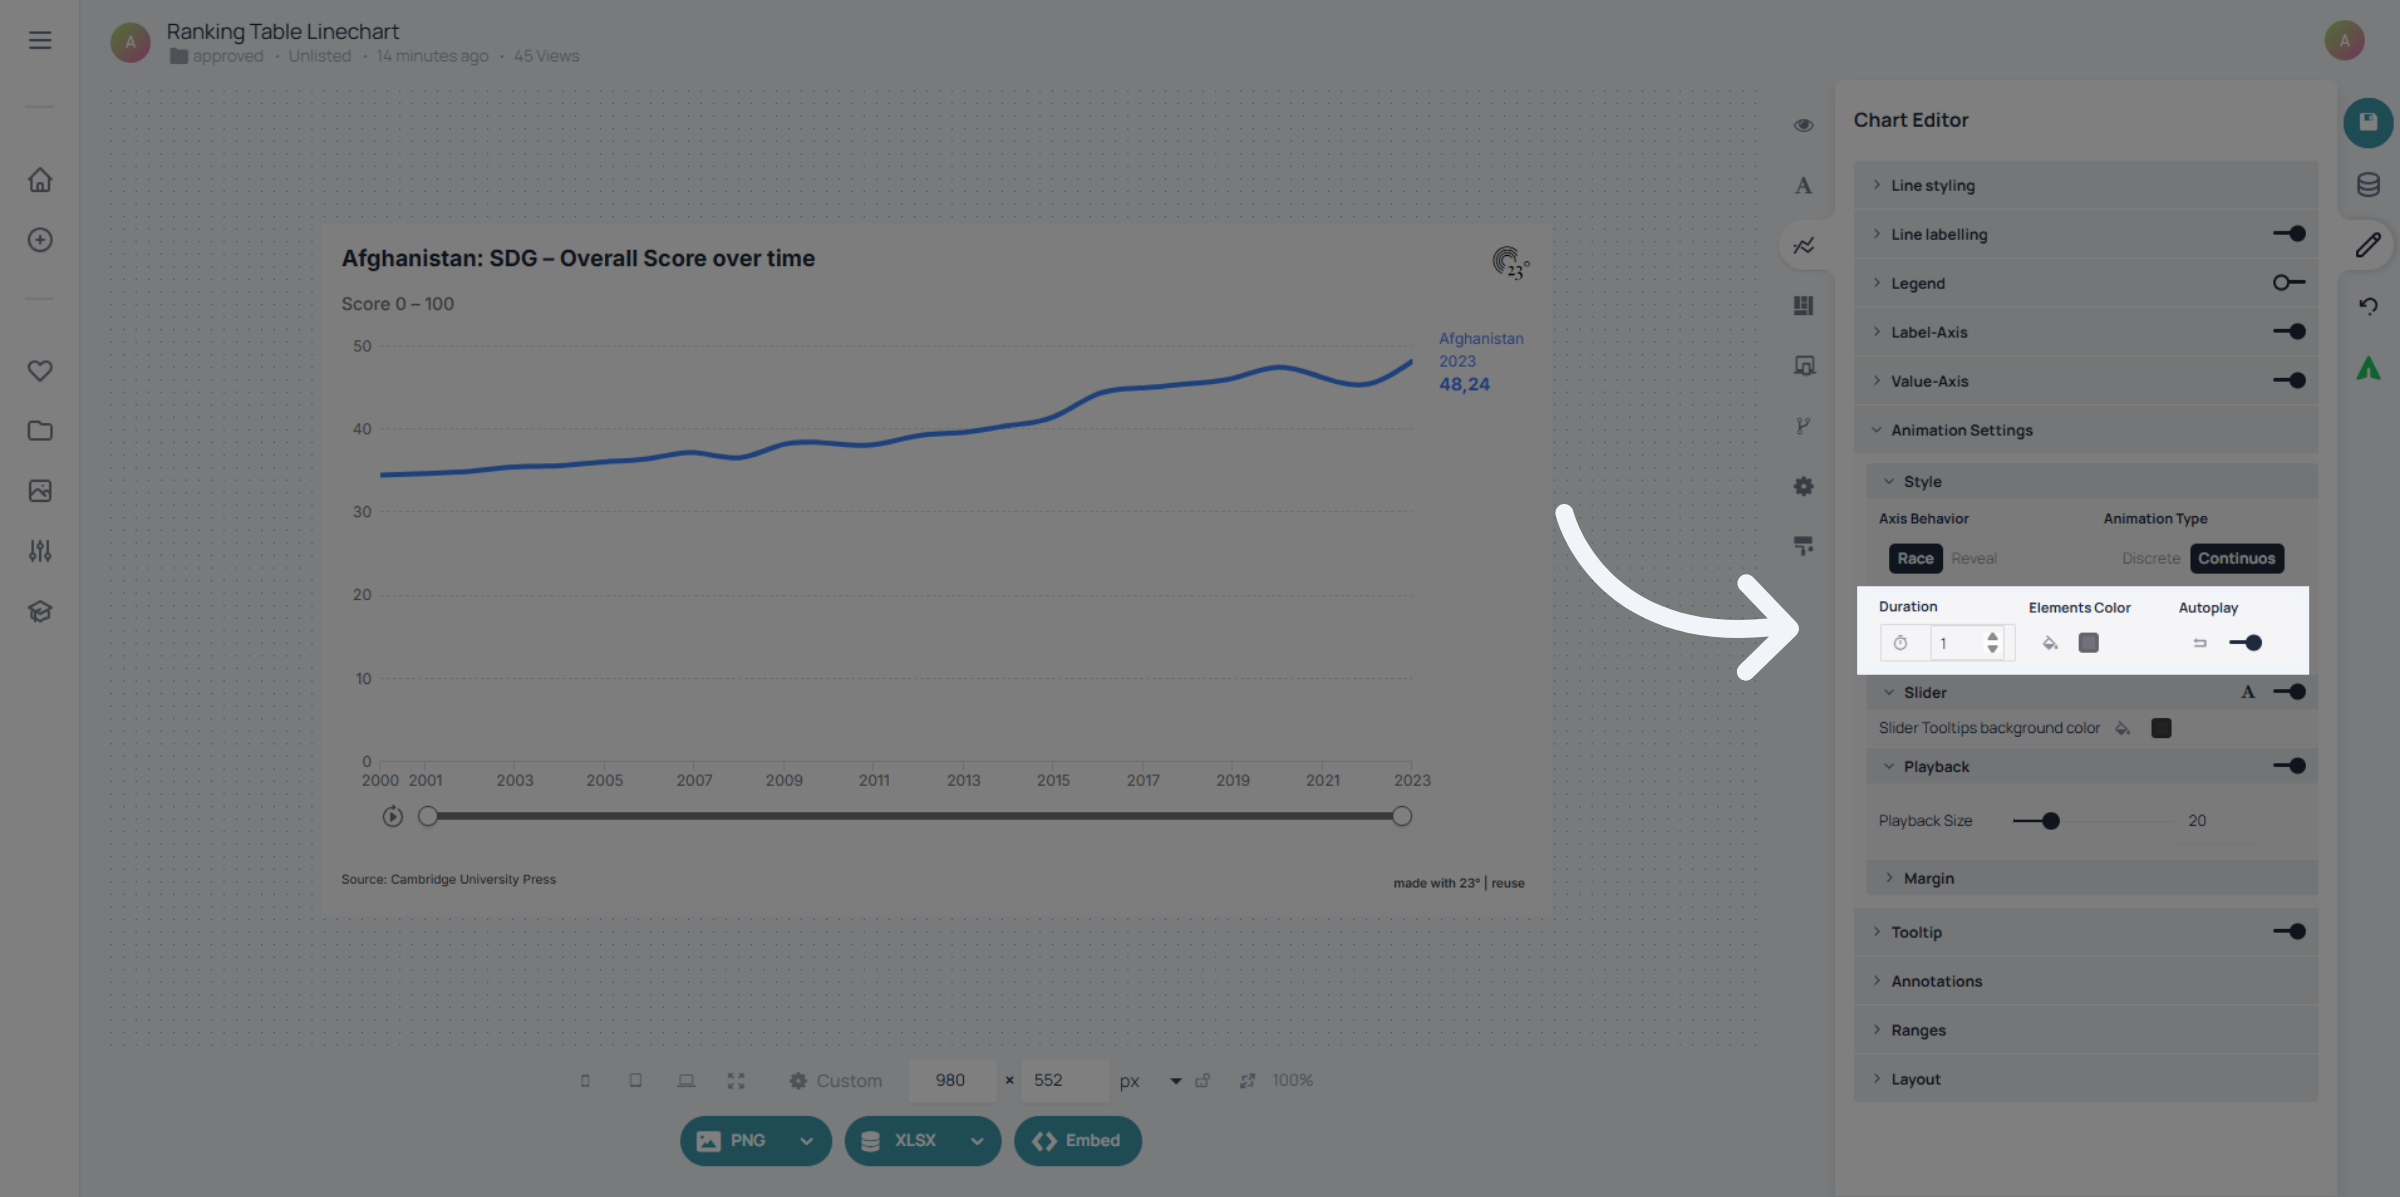
You can set the duration of your overall animation here, colour the playback button and sidebar and activate or deactivate autoplay.
You can select an animation type. There is chart revealing and continous animations, depending on what you are looking for you can try out different combinations to find what suits you best.
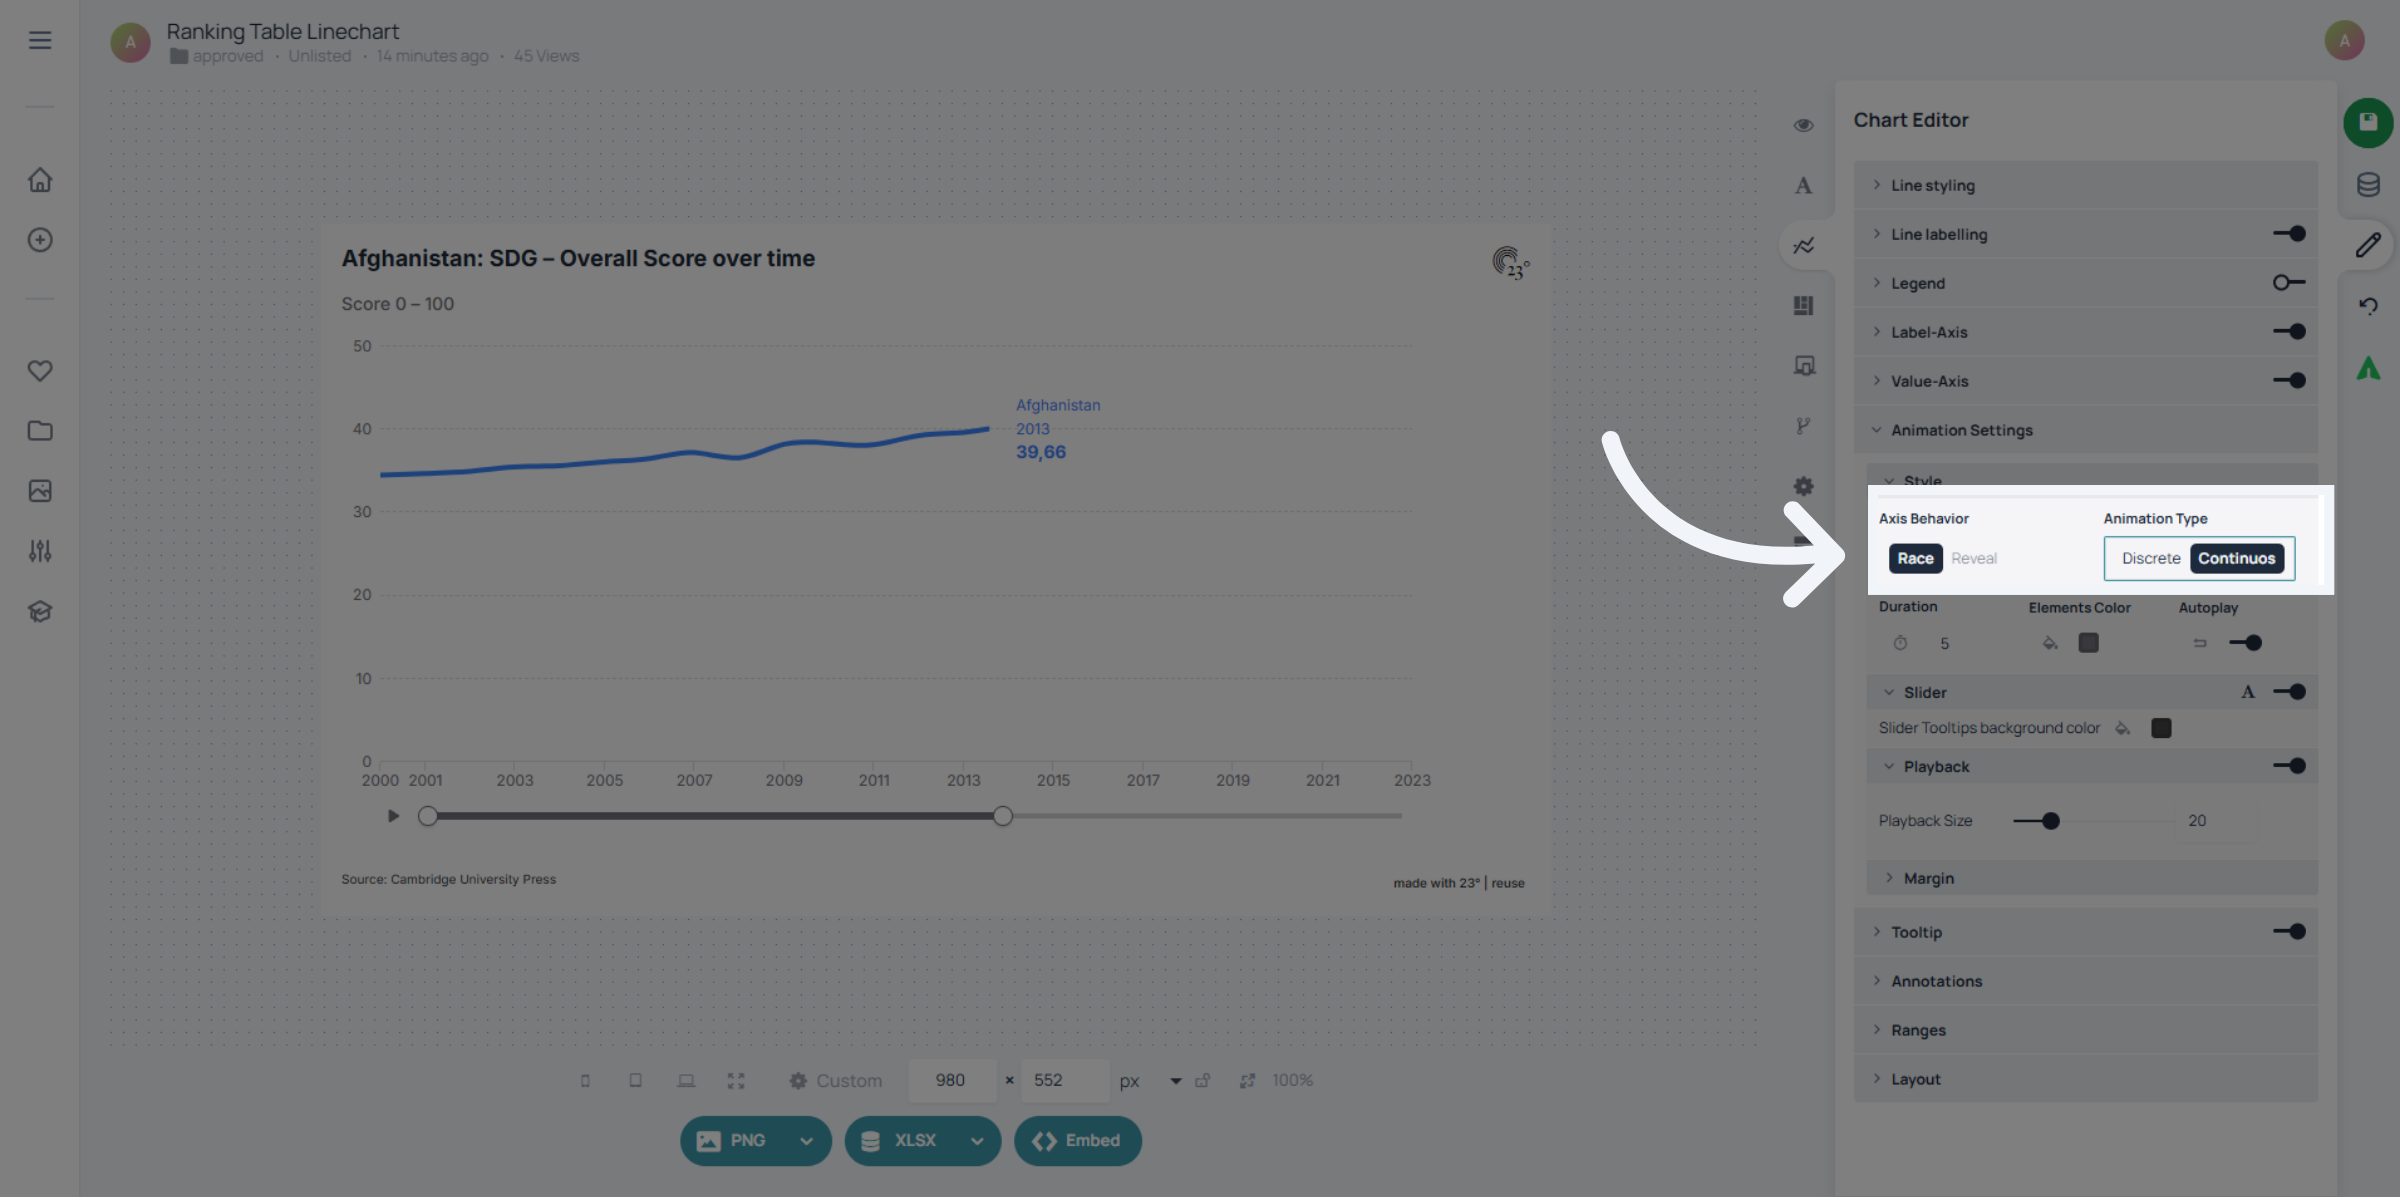
You have successfully configured the animation settings for your line chart, including enabling animations, setting duration, and choosing animation styles. These adjustments enhance the visual appeal and clarity of your chart presentations.