Fill Areas Between Lines In Line Chart Visualization
This tutorial demonstrates how to fill the areas between lines in a line chart.
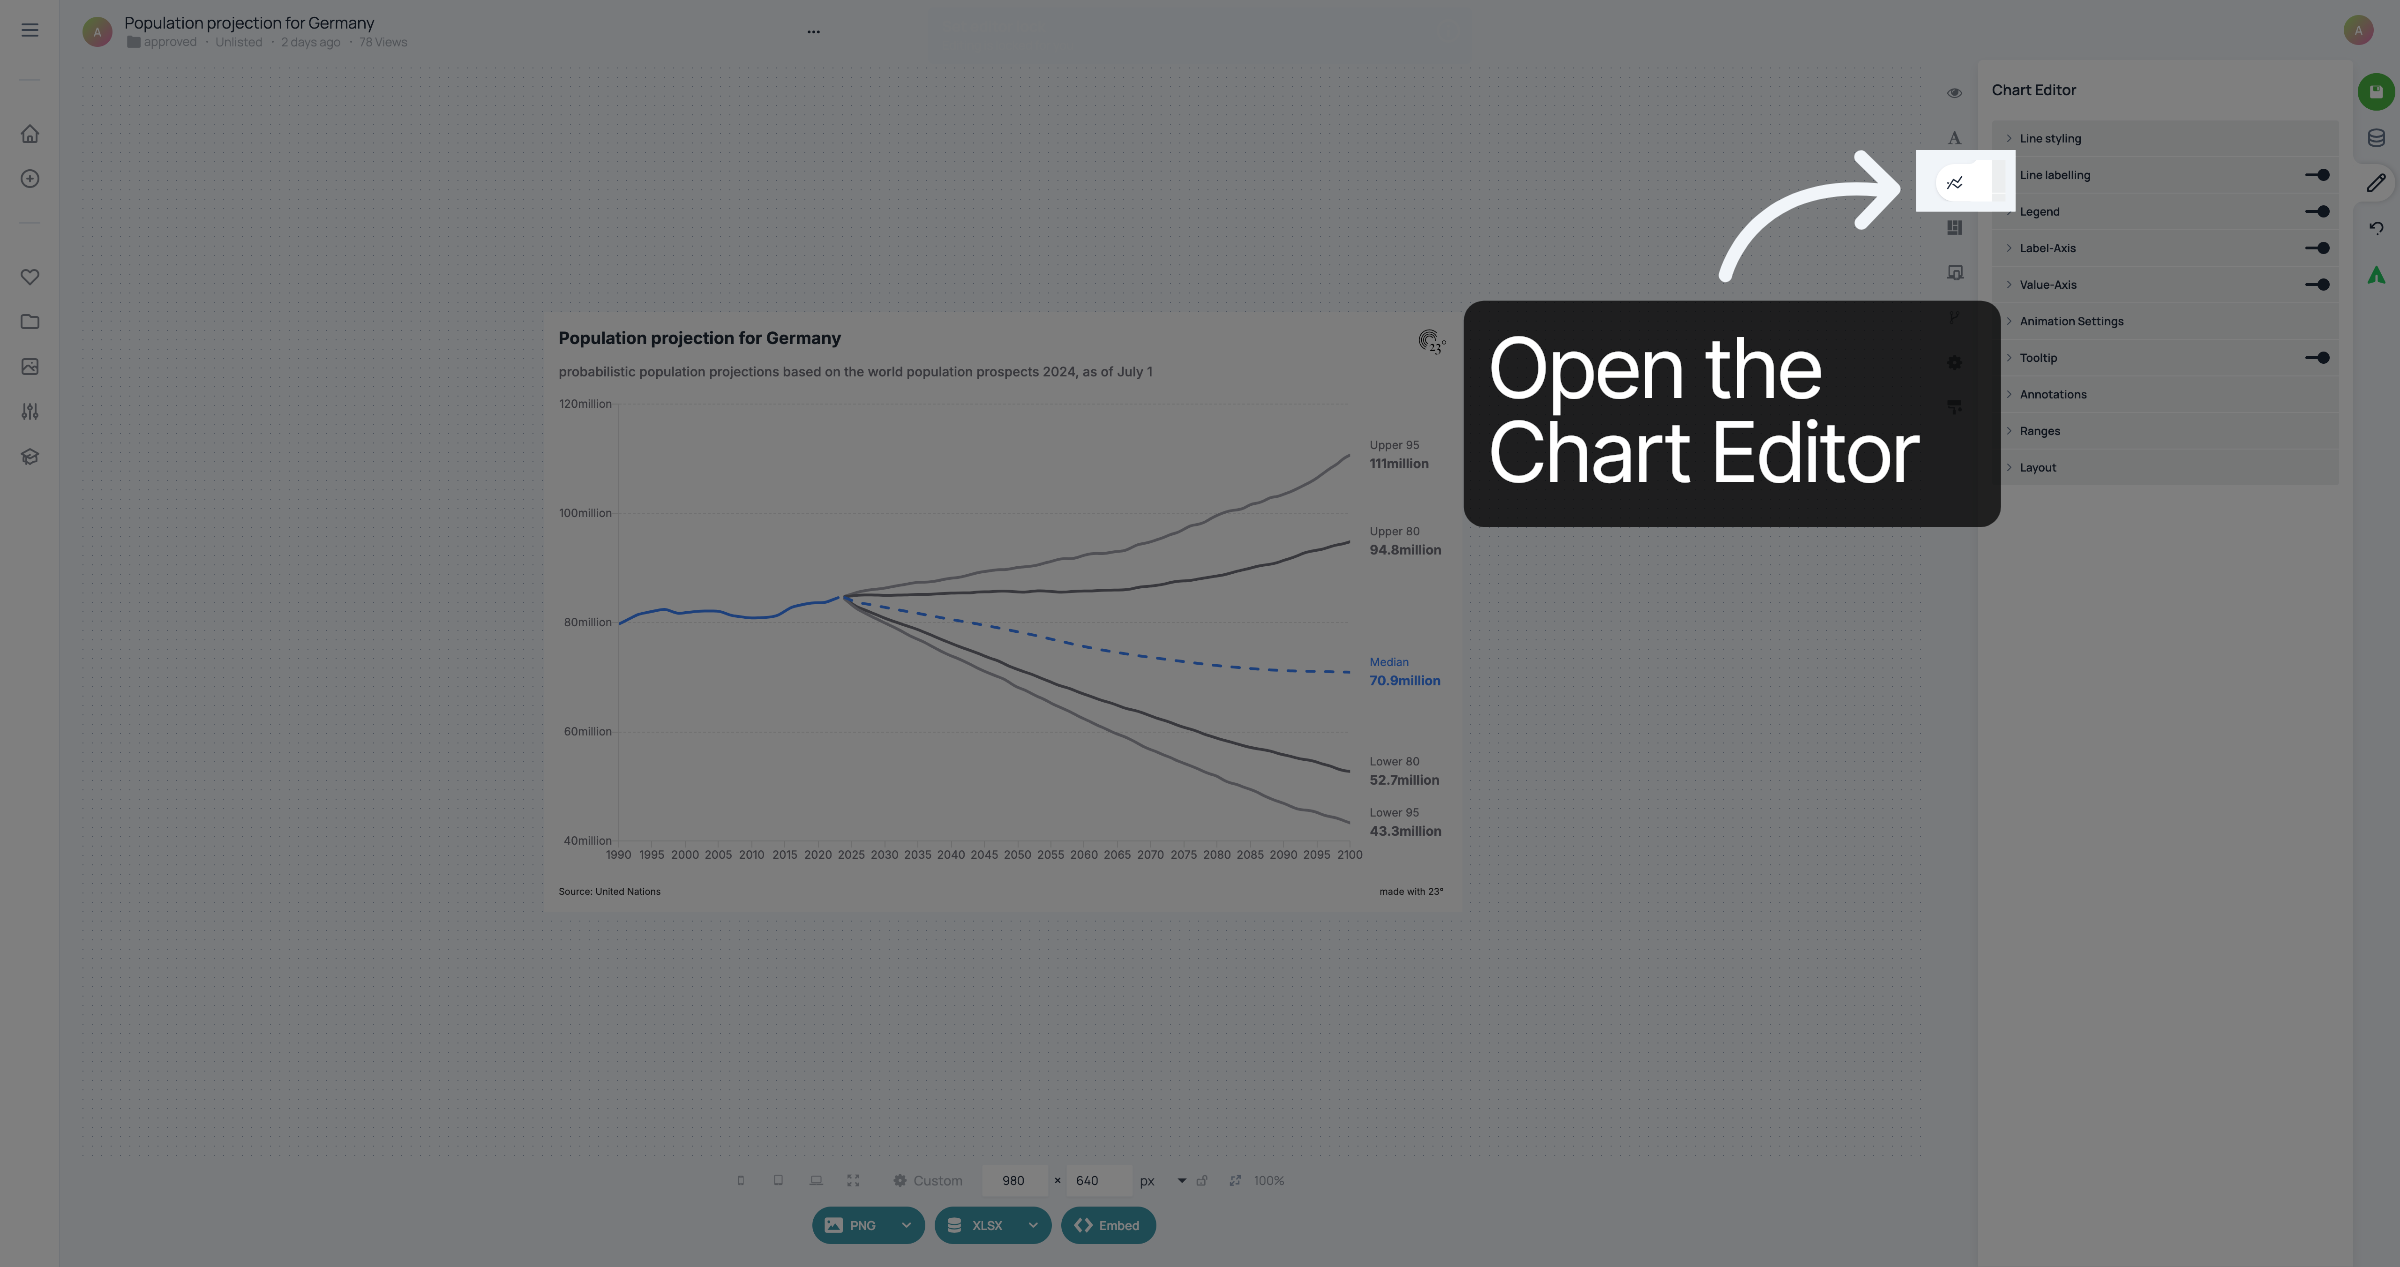
1. Open the Chart Editor
Open the Chart Editor
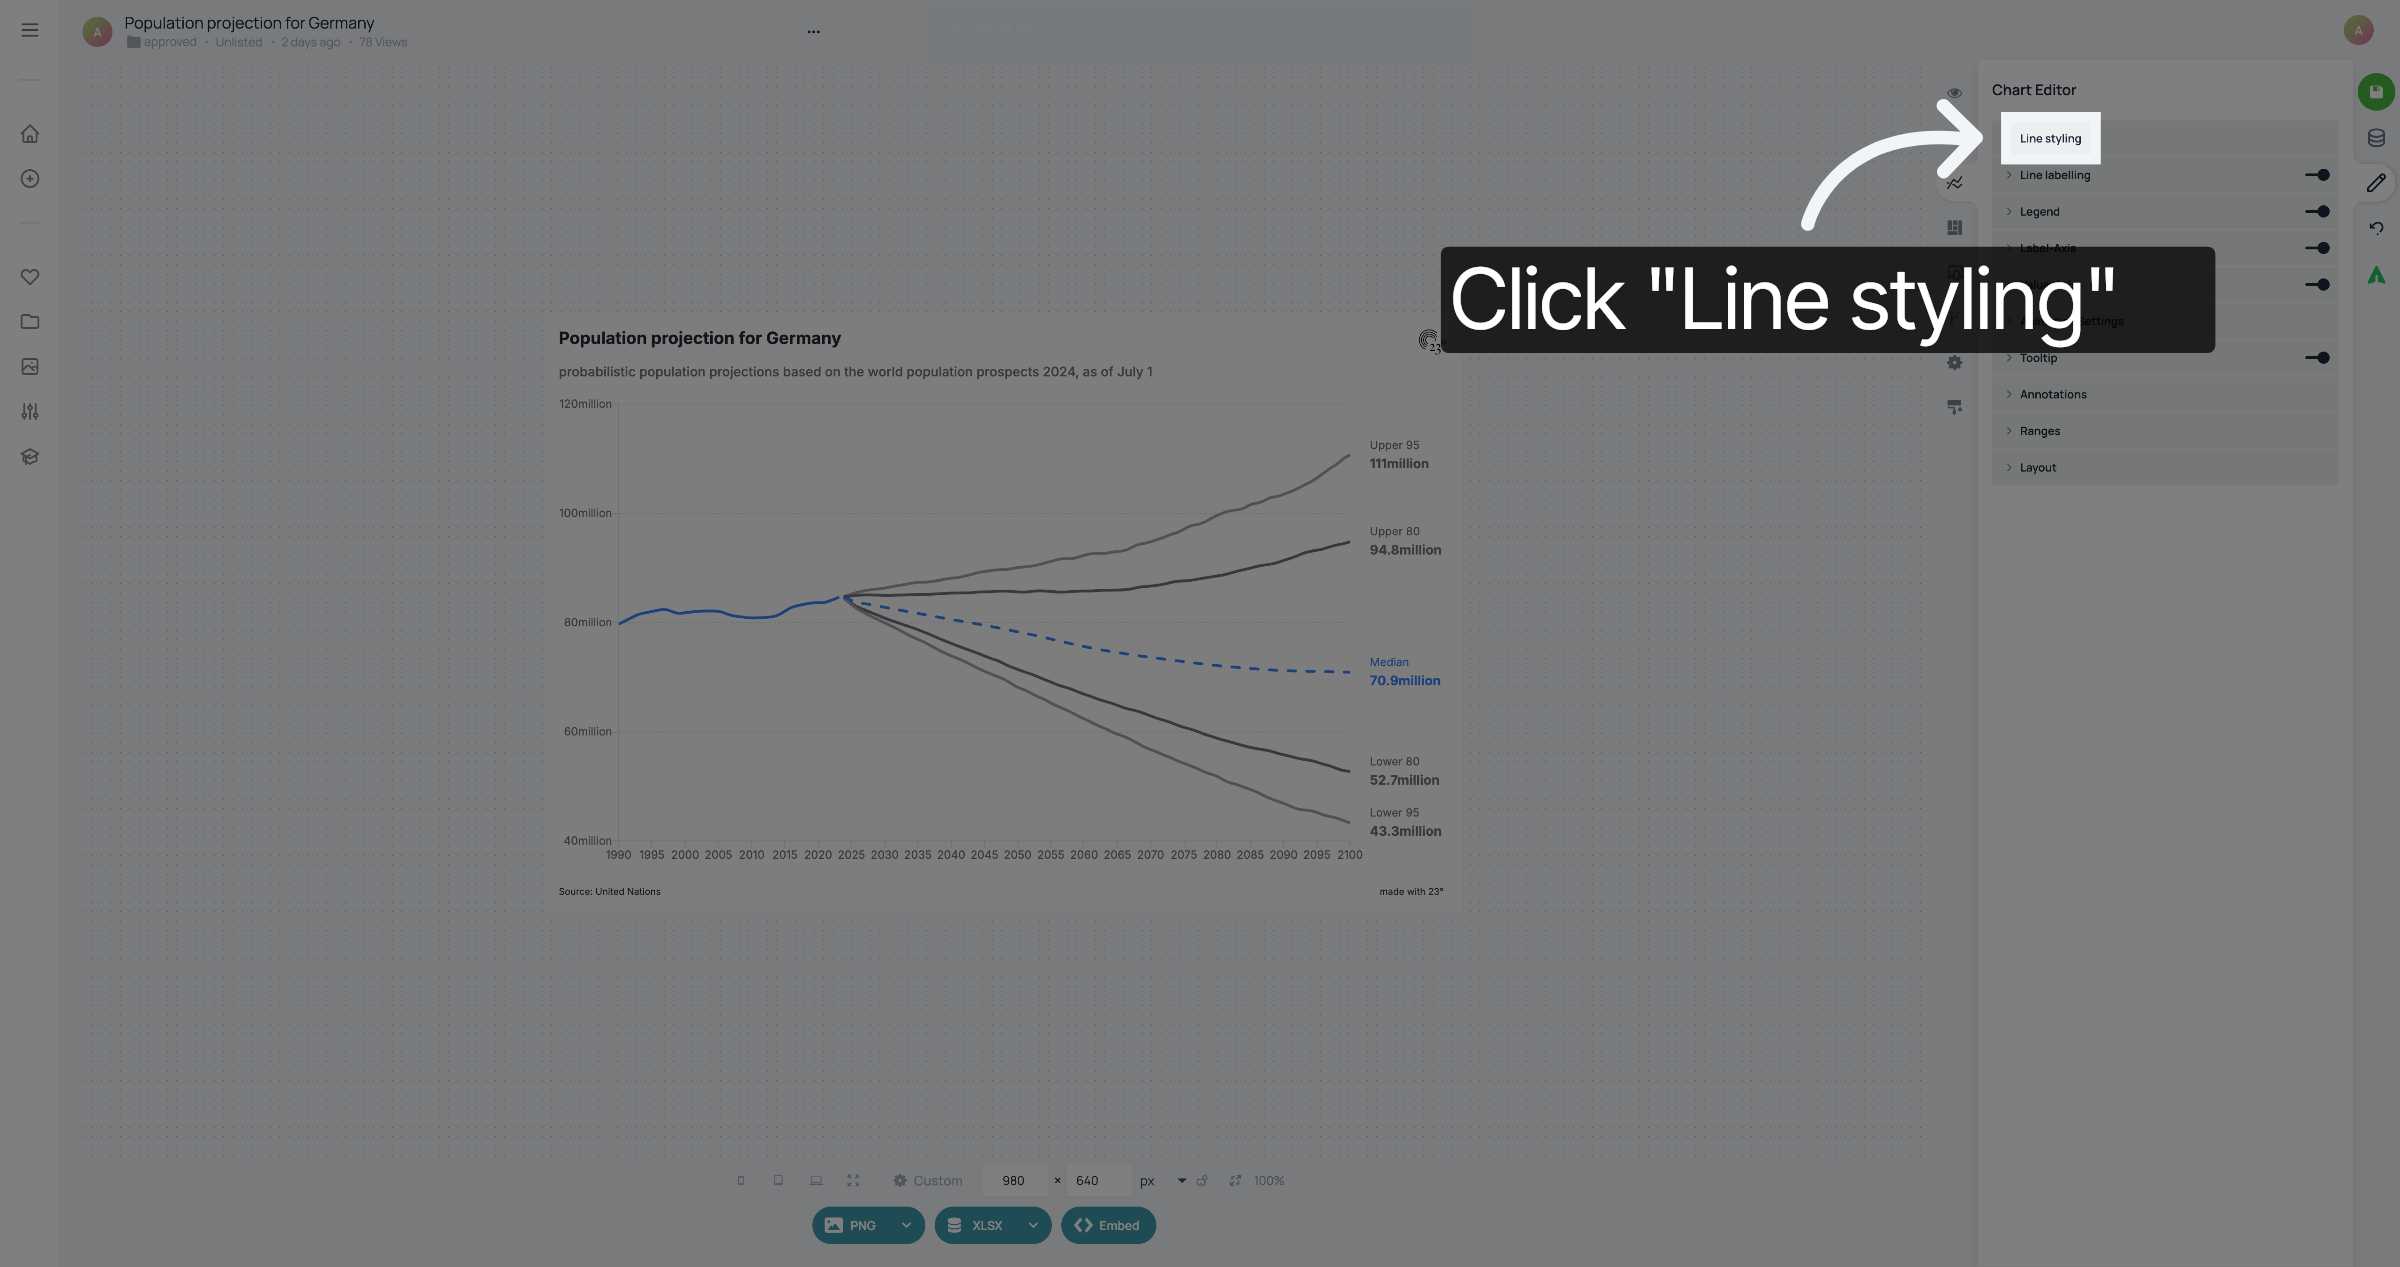
2. Click "Line styling"
Click "Line styling"
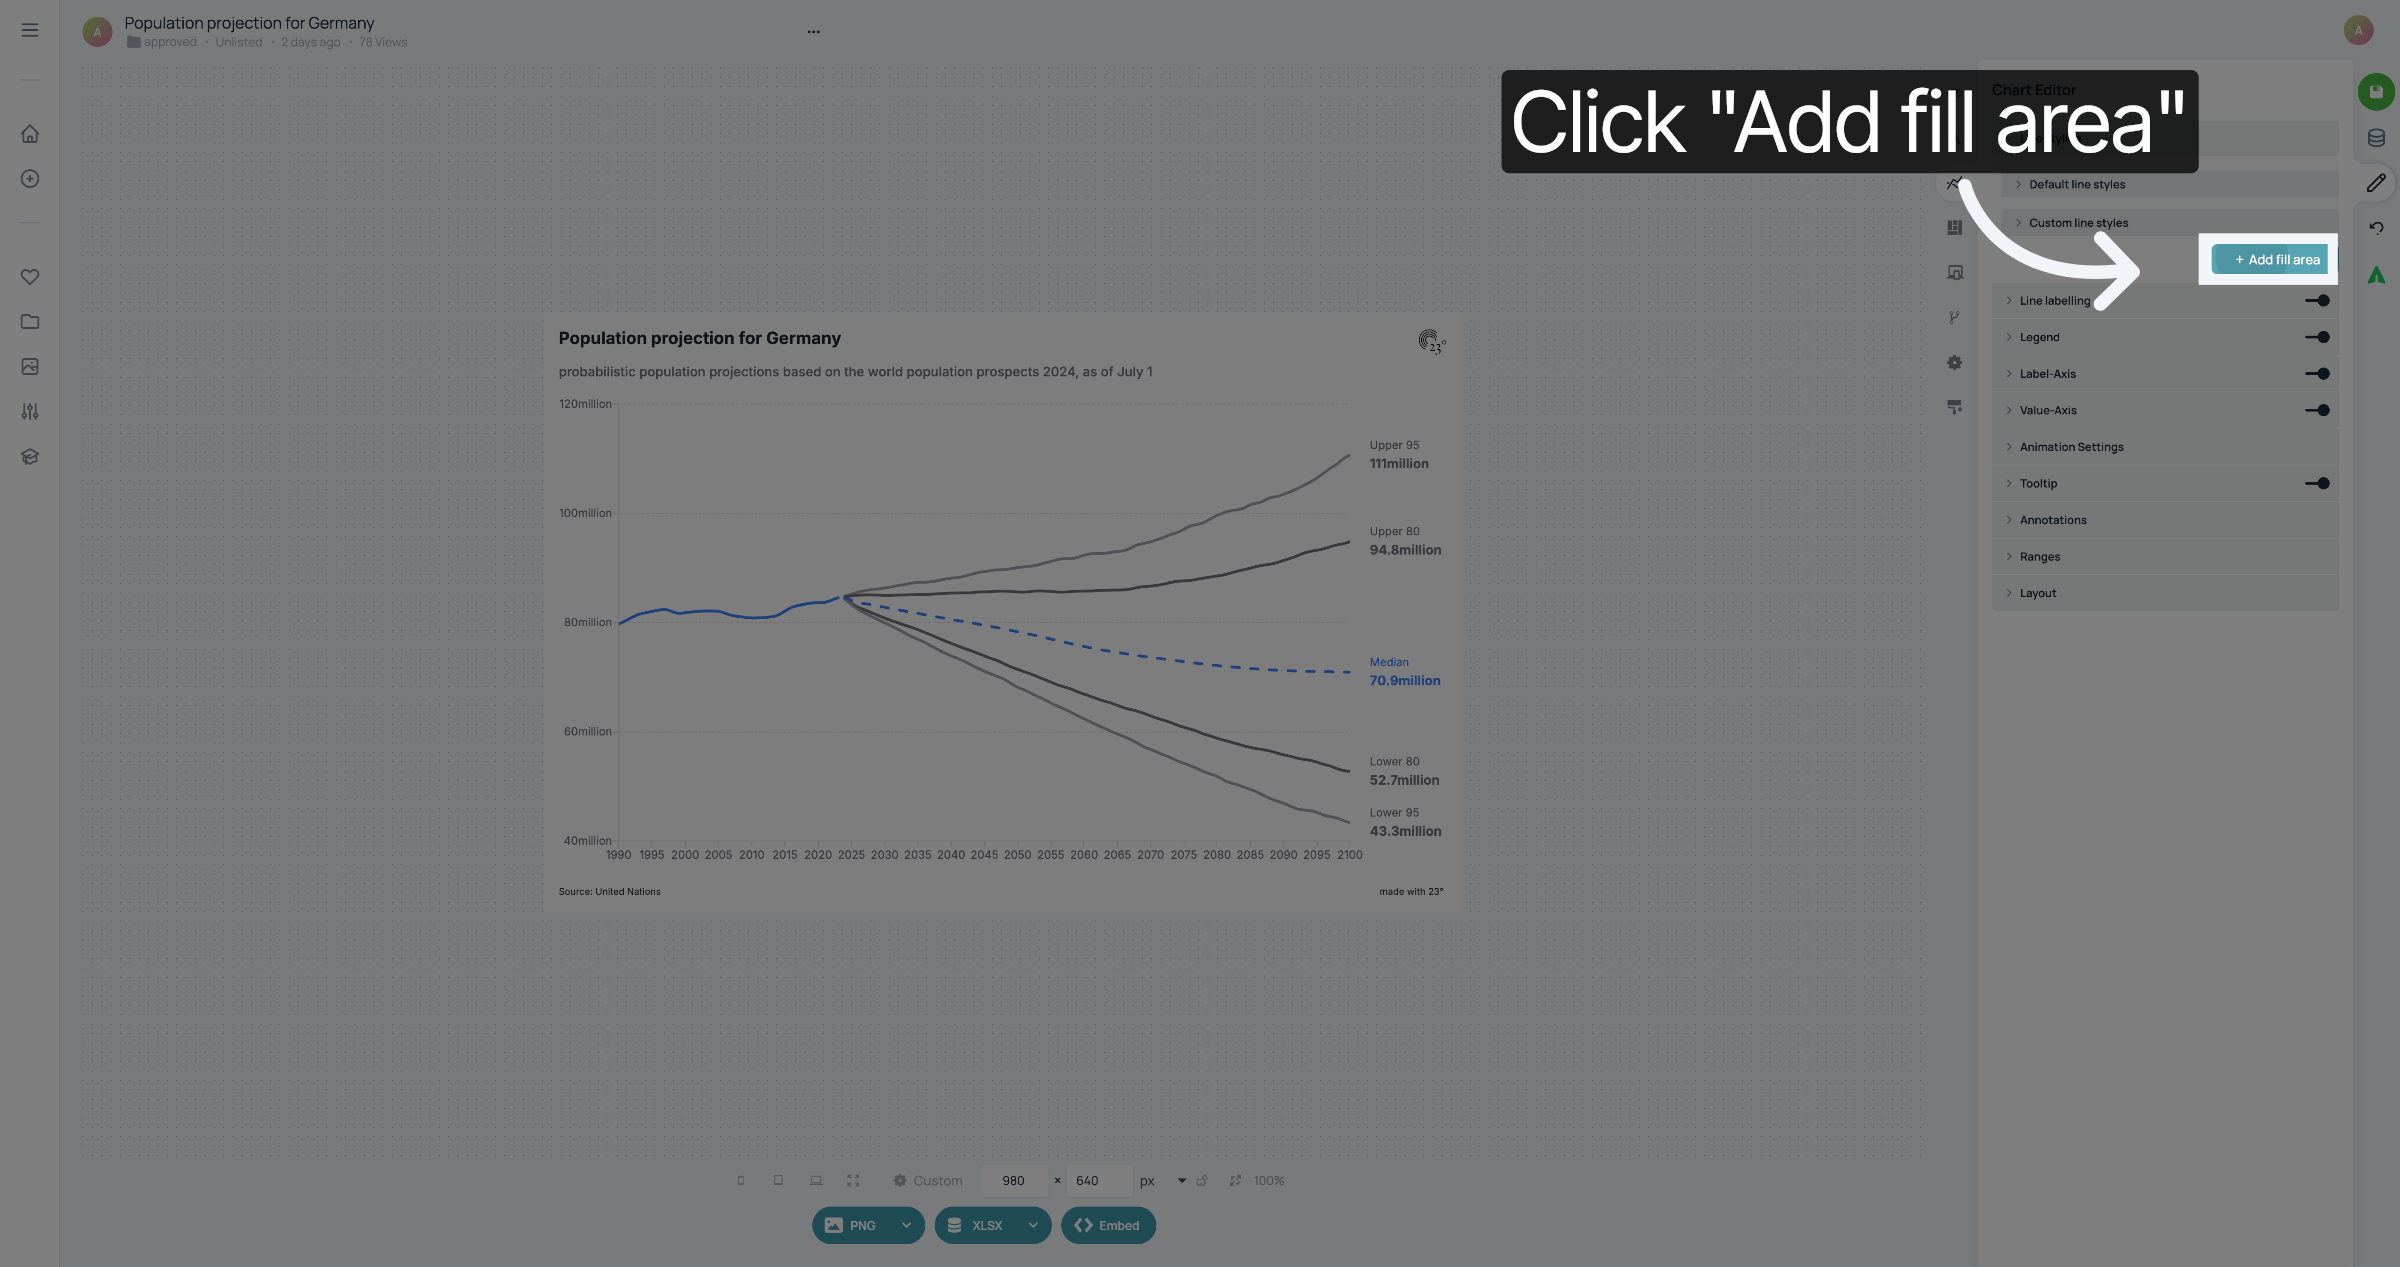
3. Add fill area
Click "Add fill area".
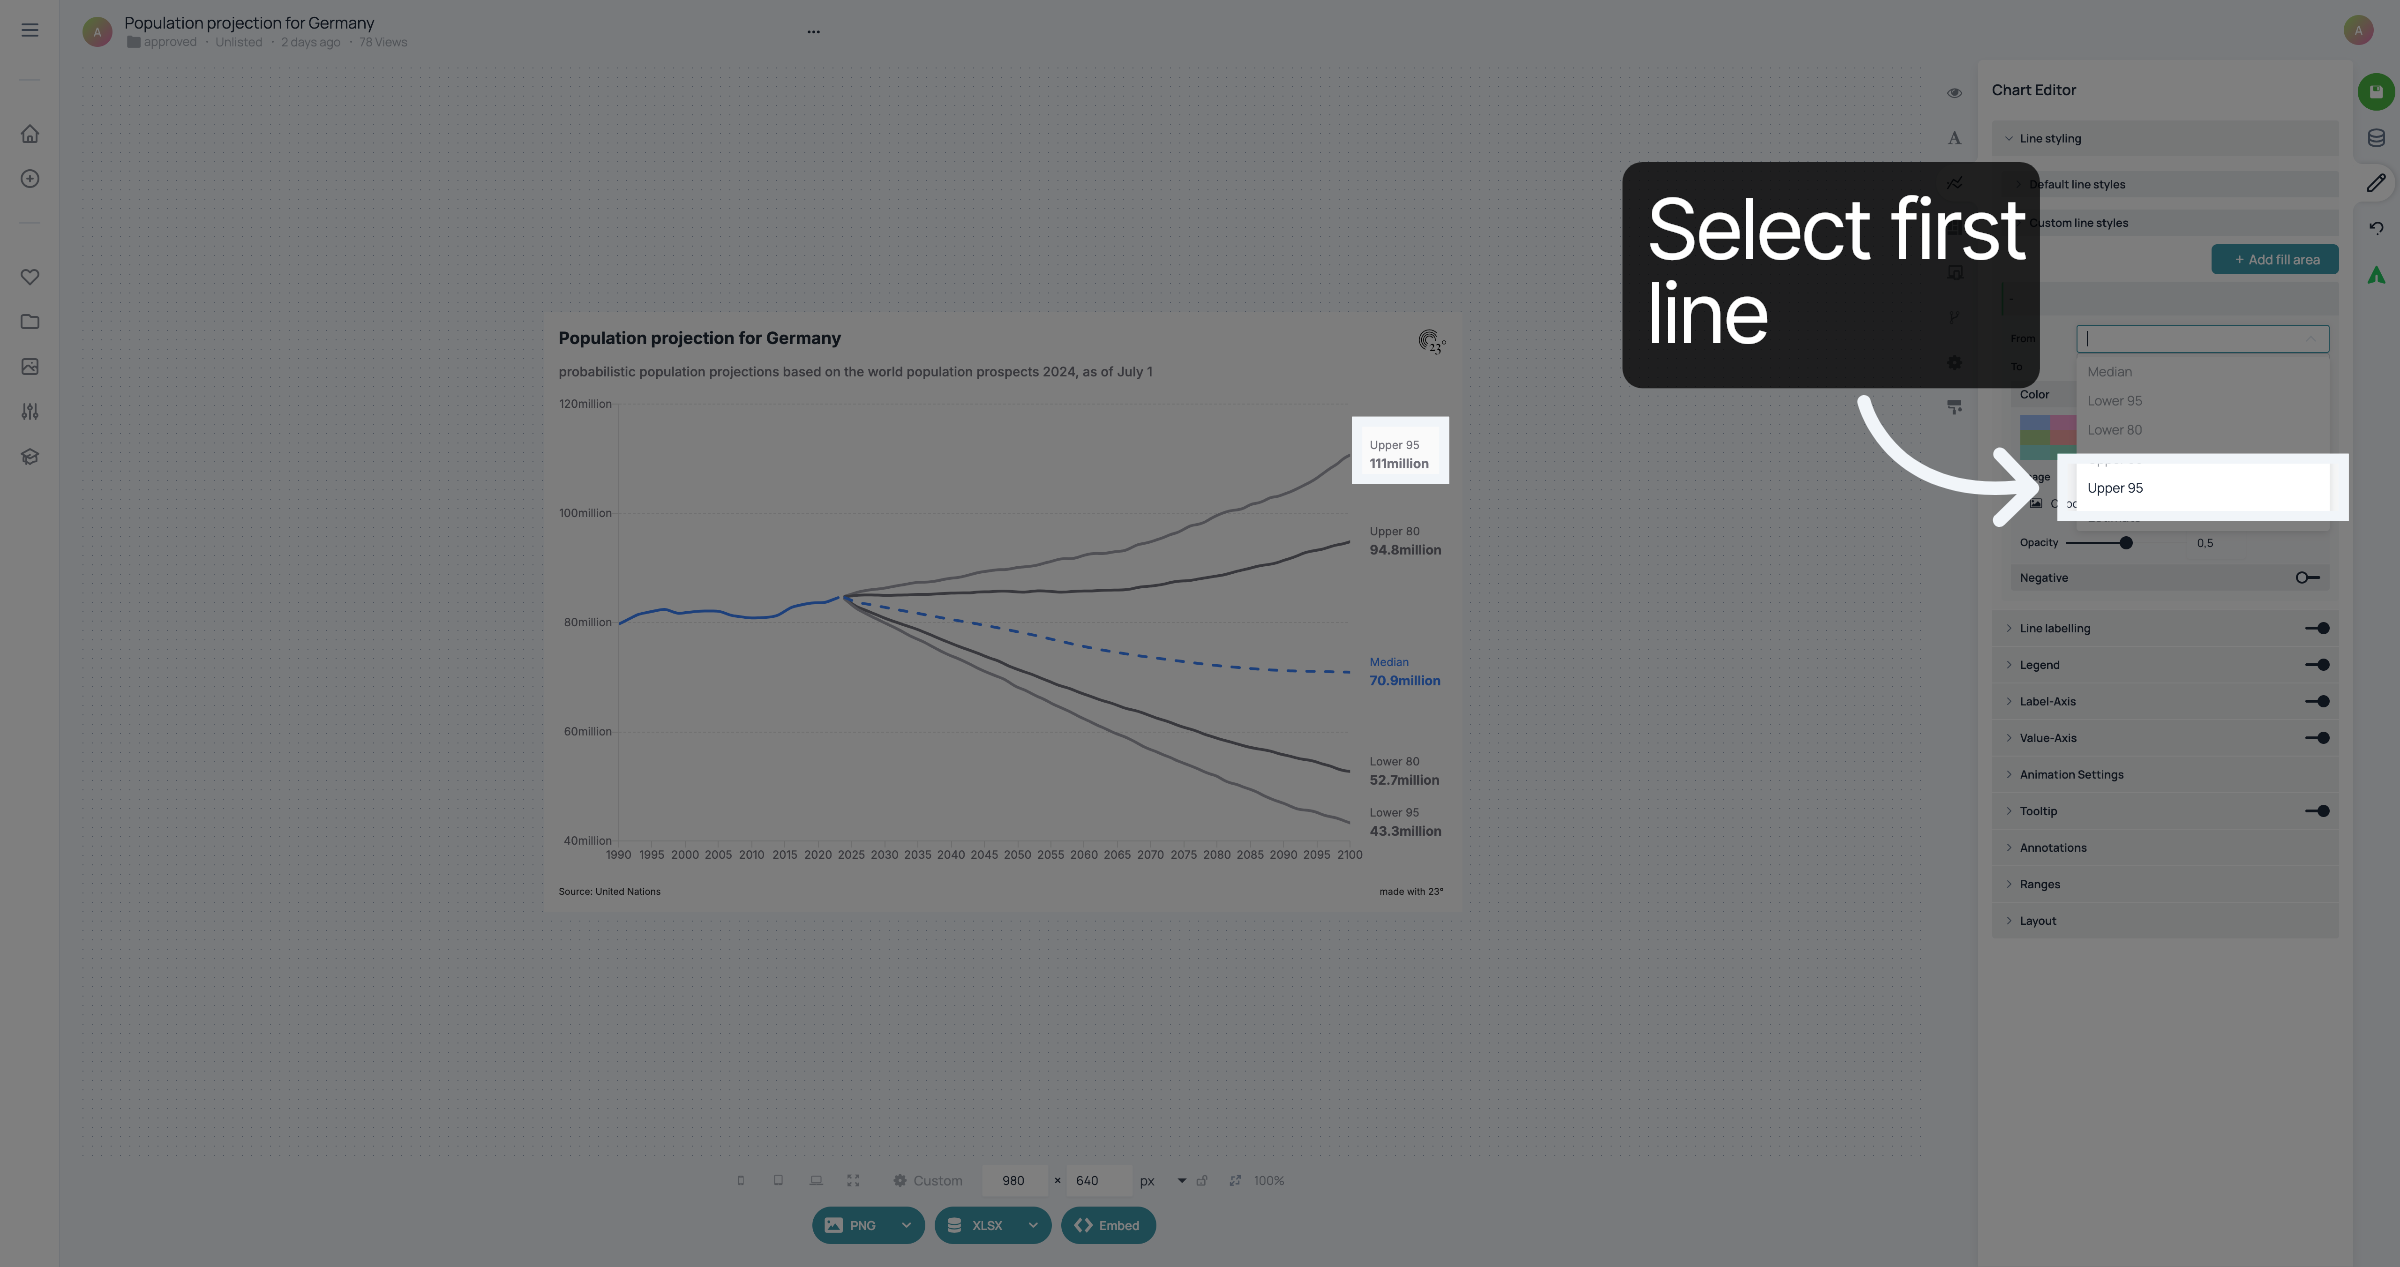
4. Select first line
To fill the area between two lines, select one of the lines from the dropdown
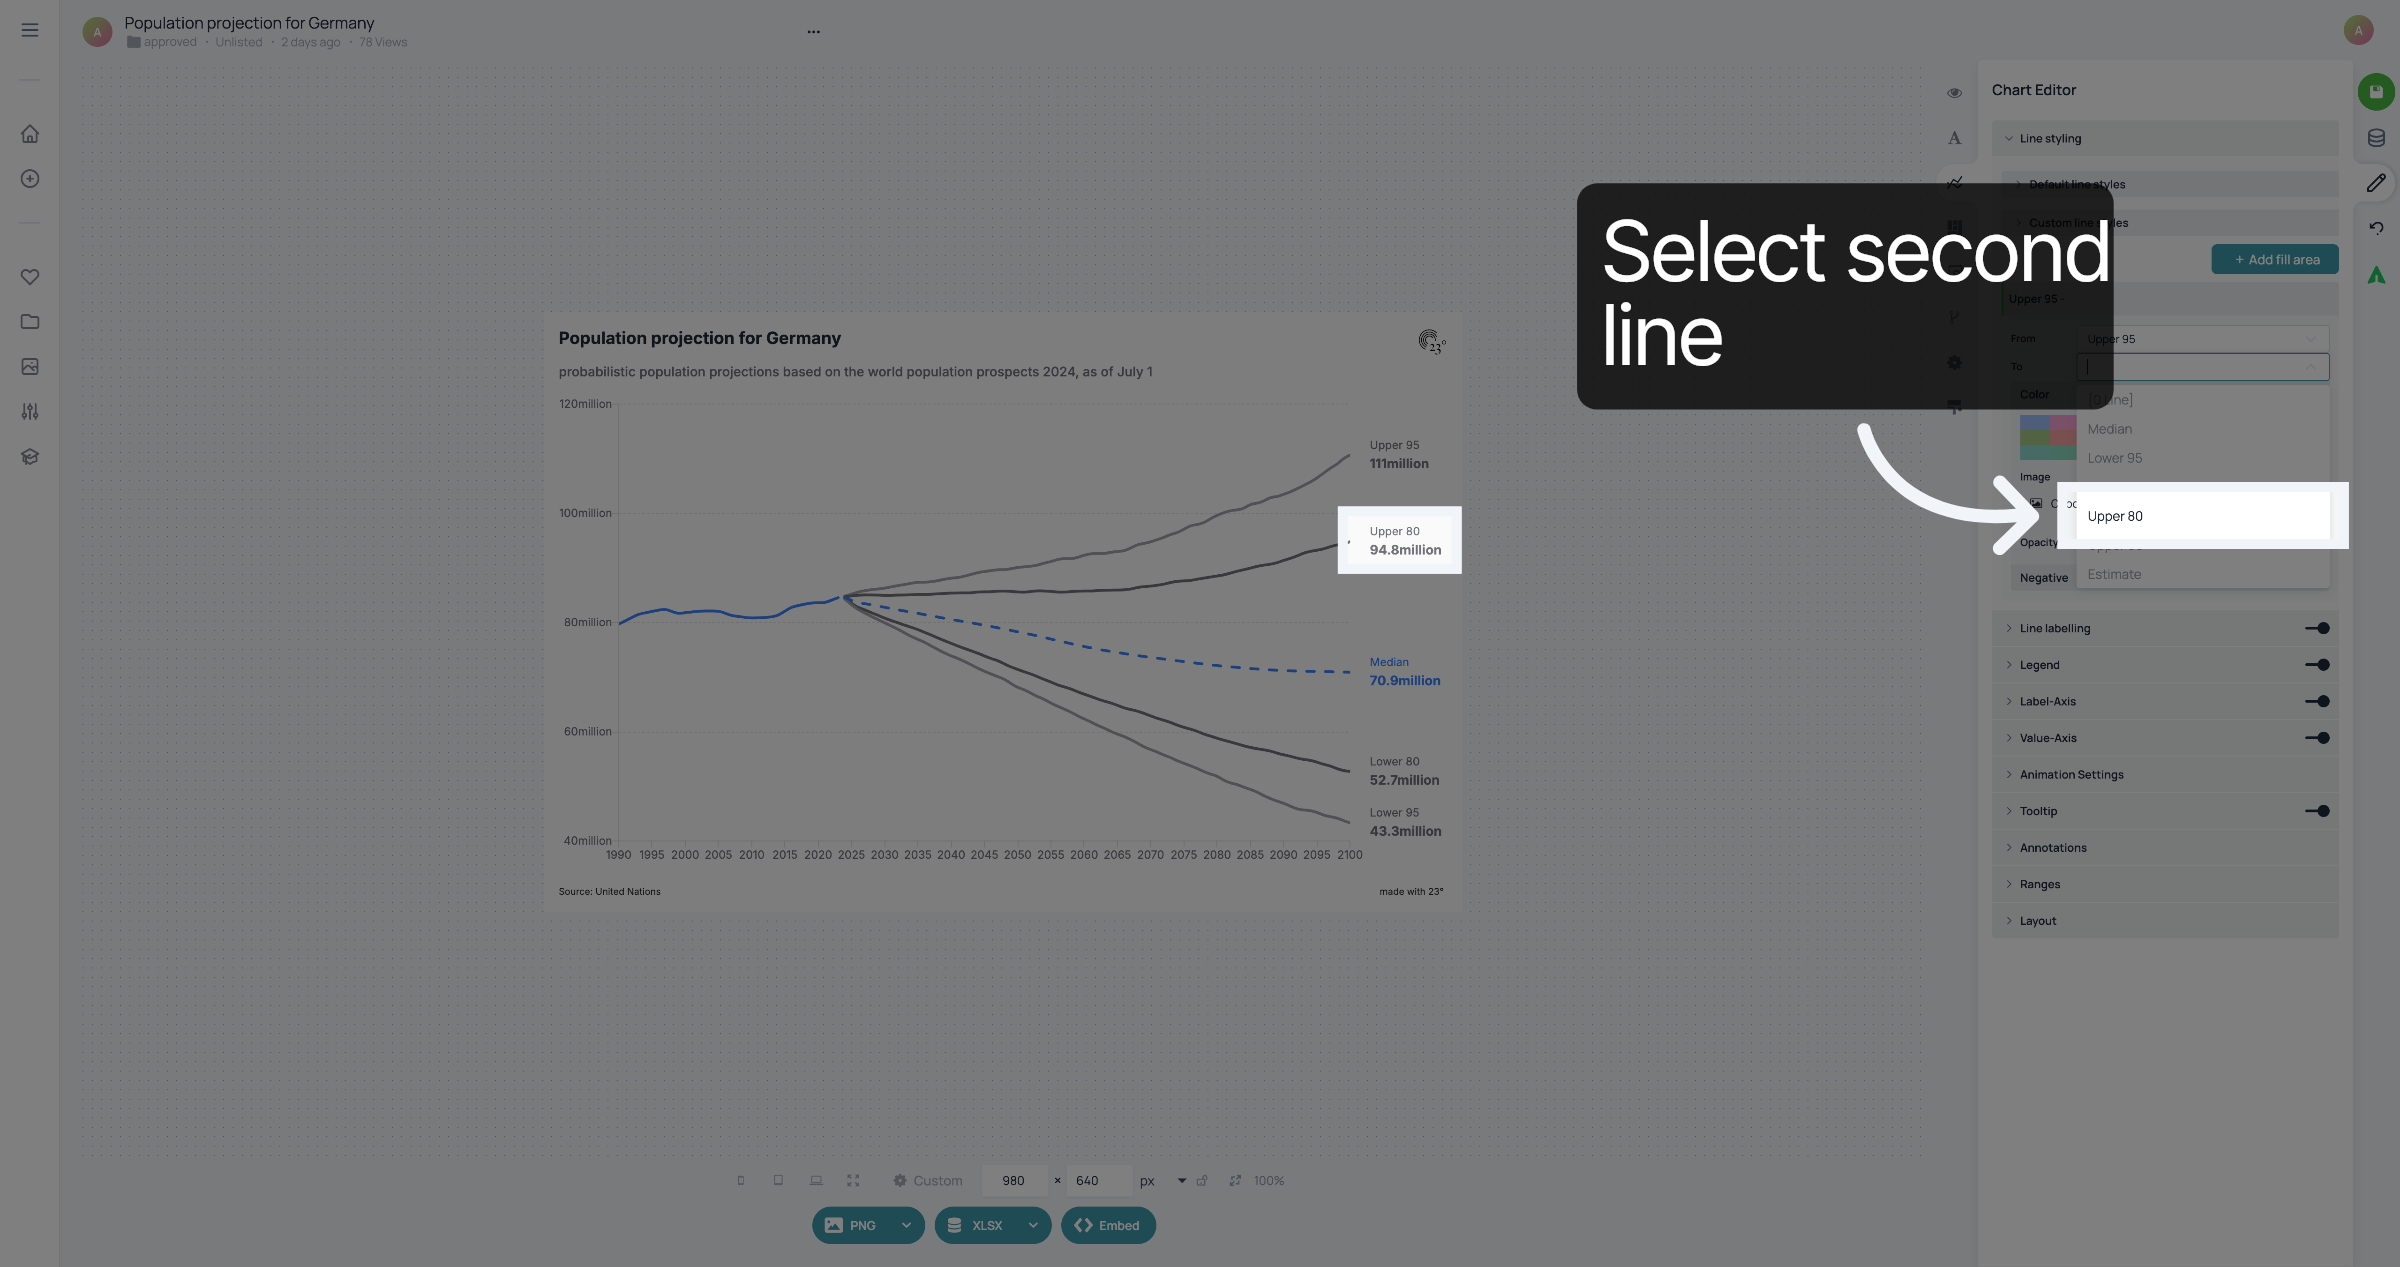
5. Select second line
Next, select the second line.
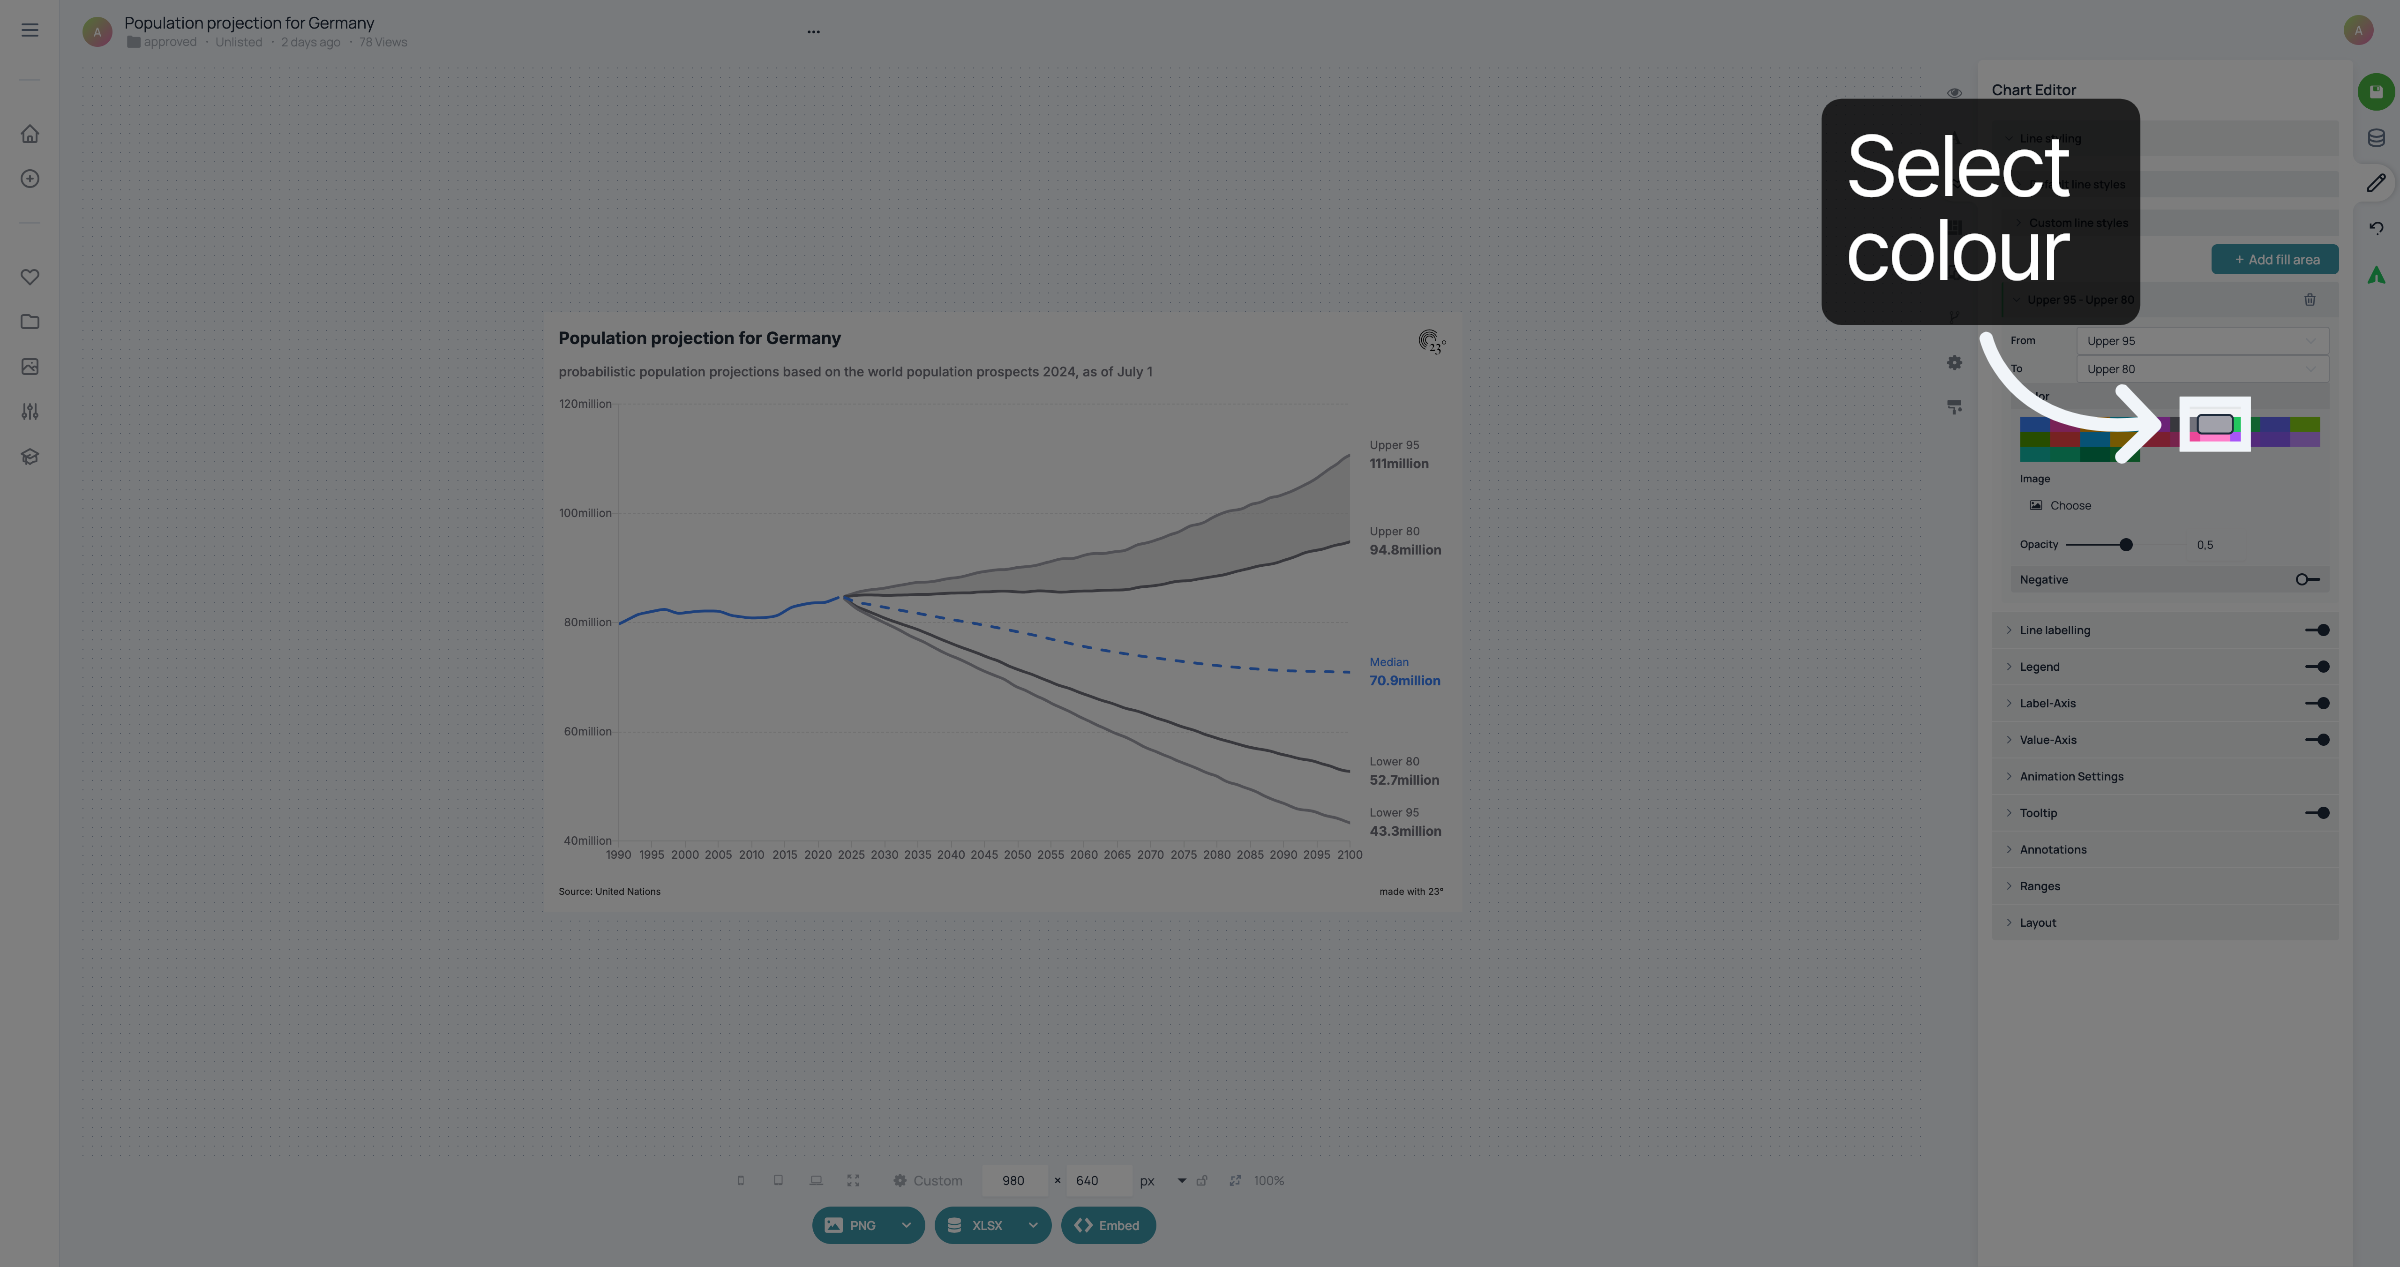
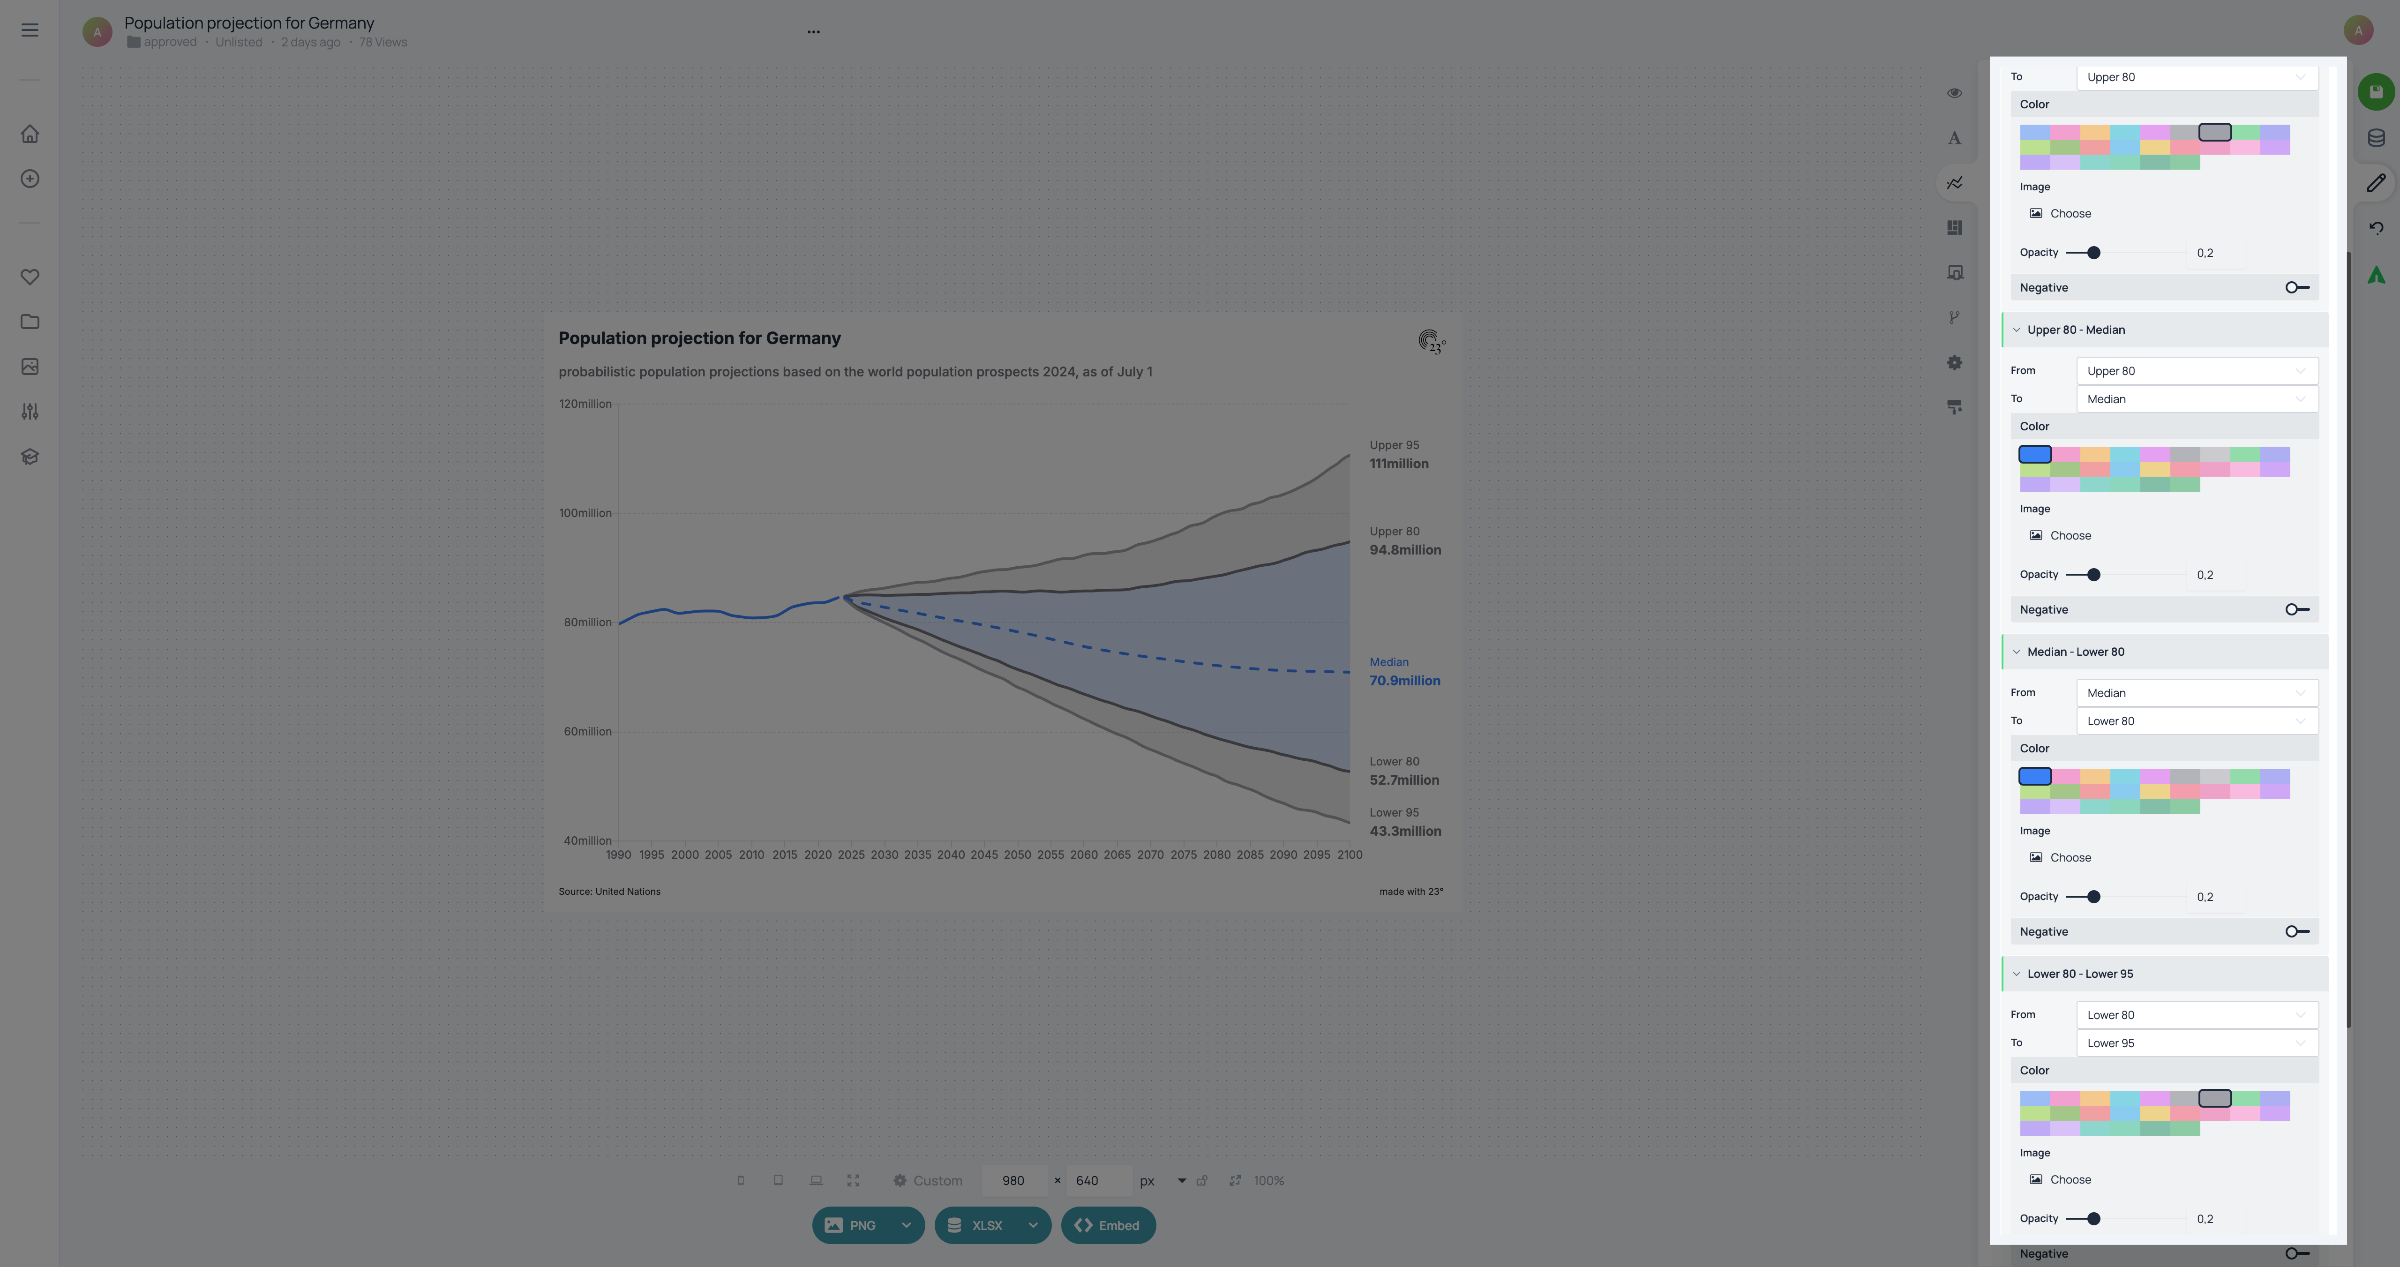
6. Select colour
After you have selected the lines, choose the colour you want to fill the area with.
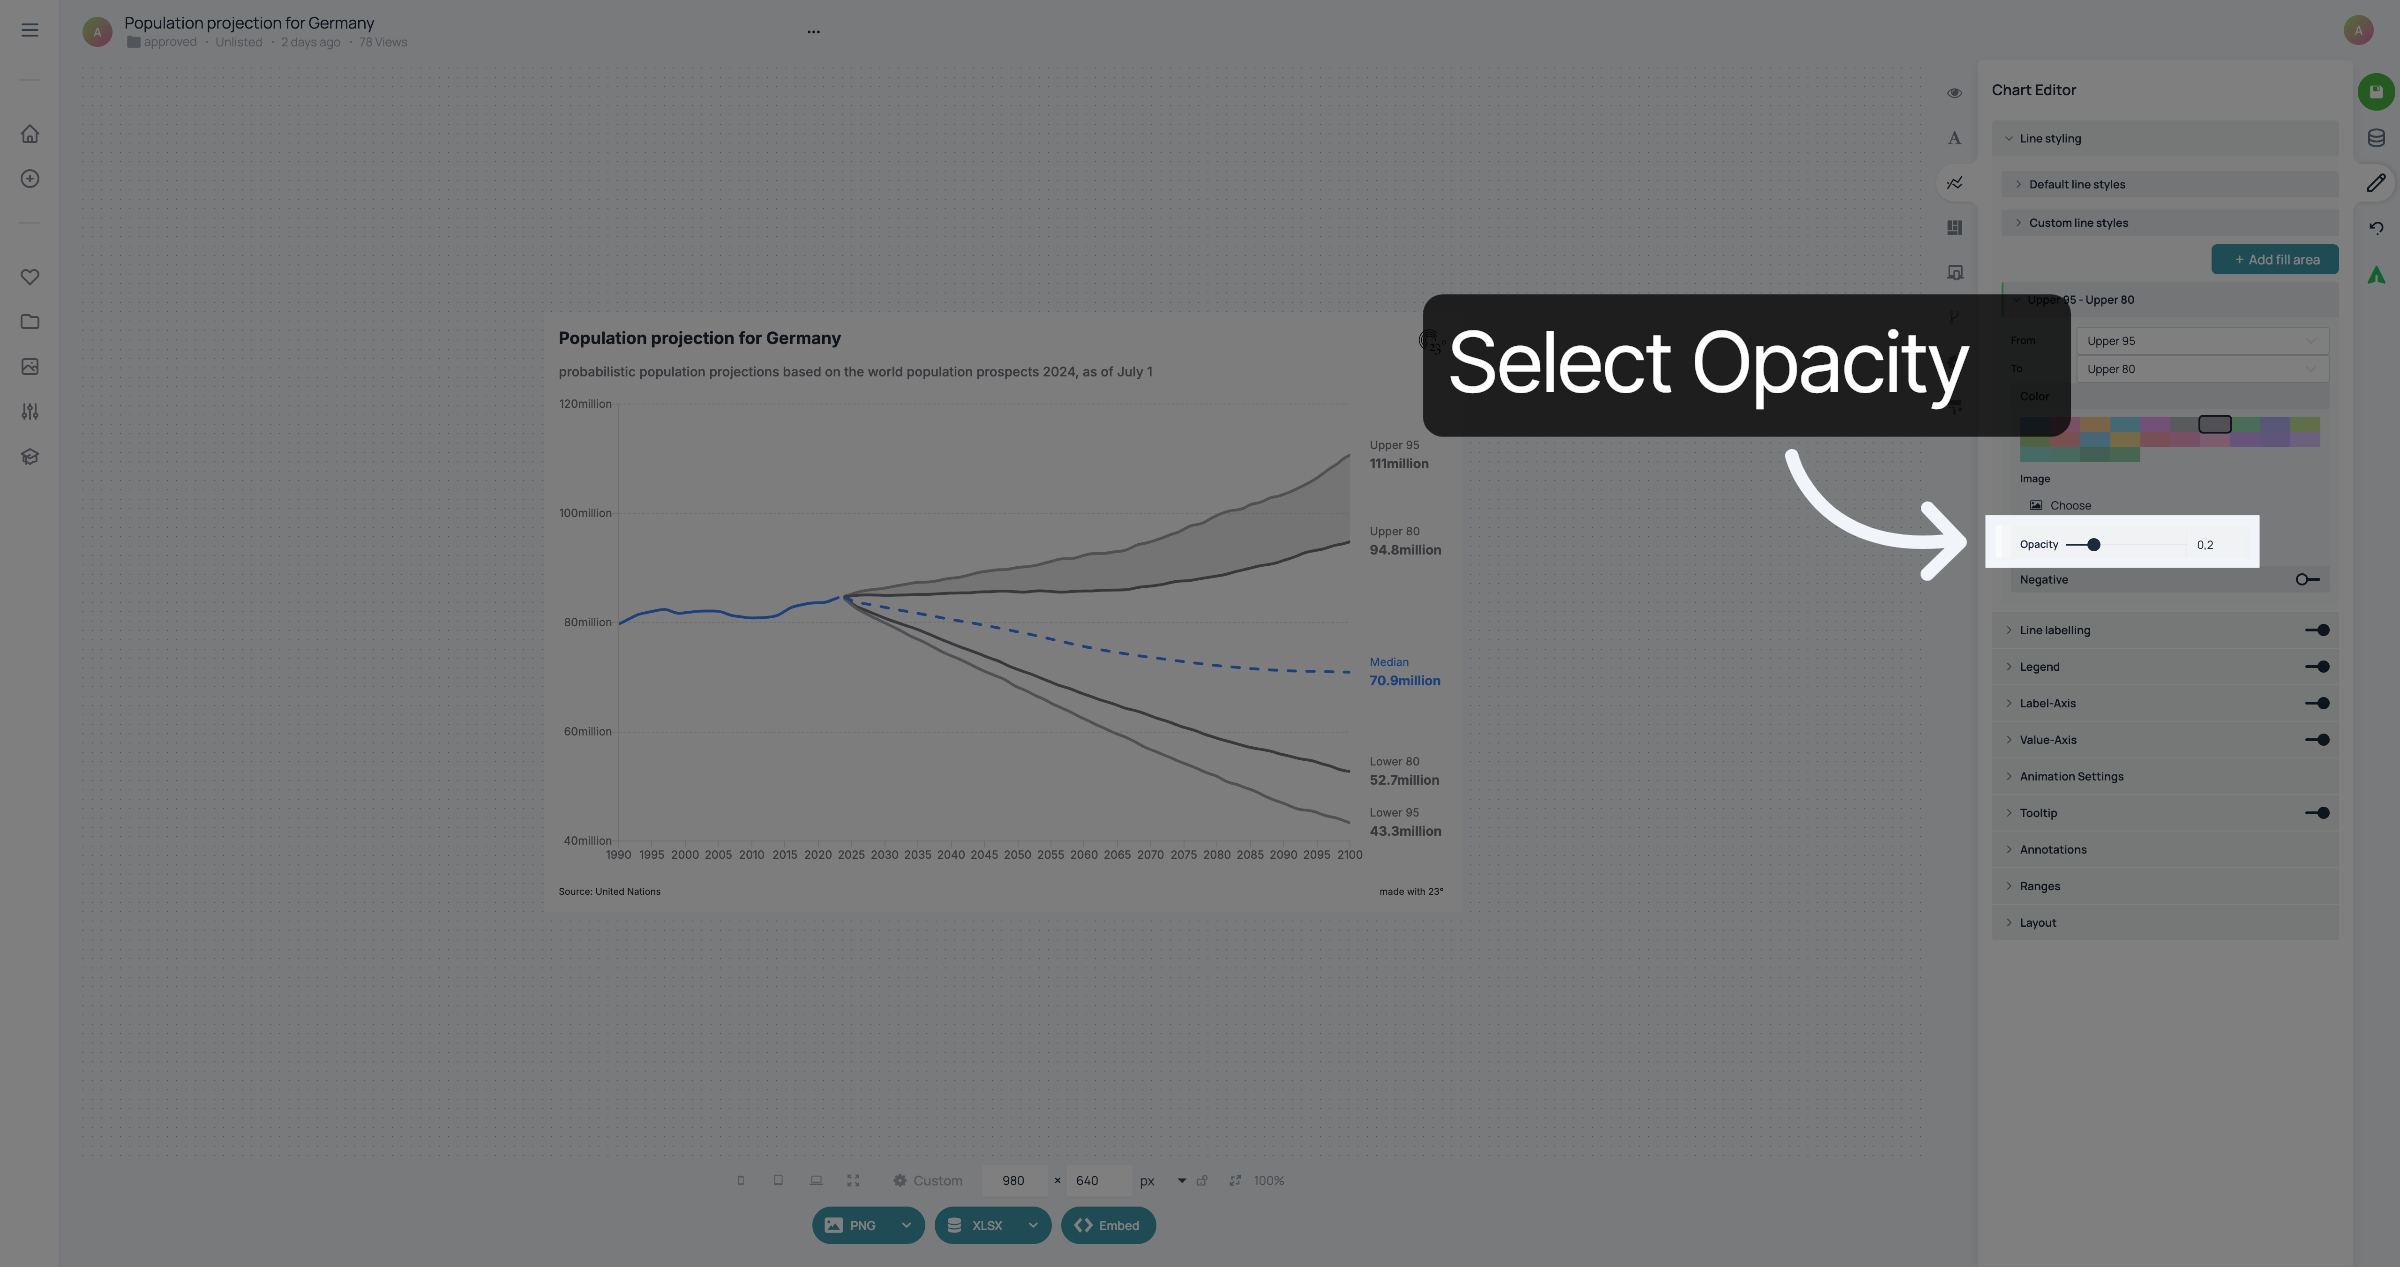
7. Select opacity
If you want to, you can also select an opacity for the area.
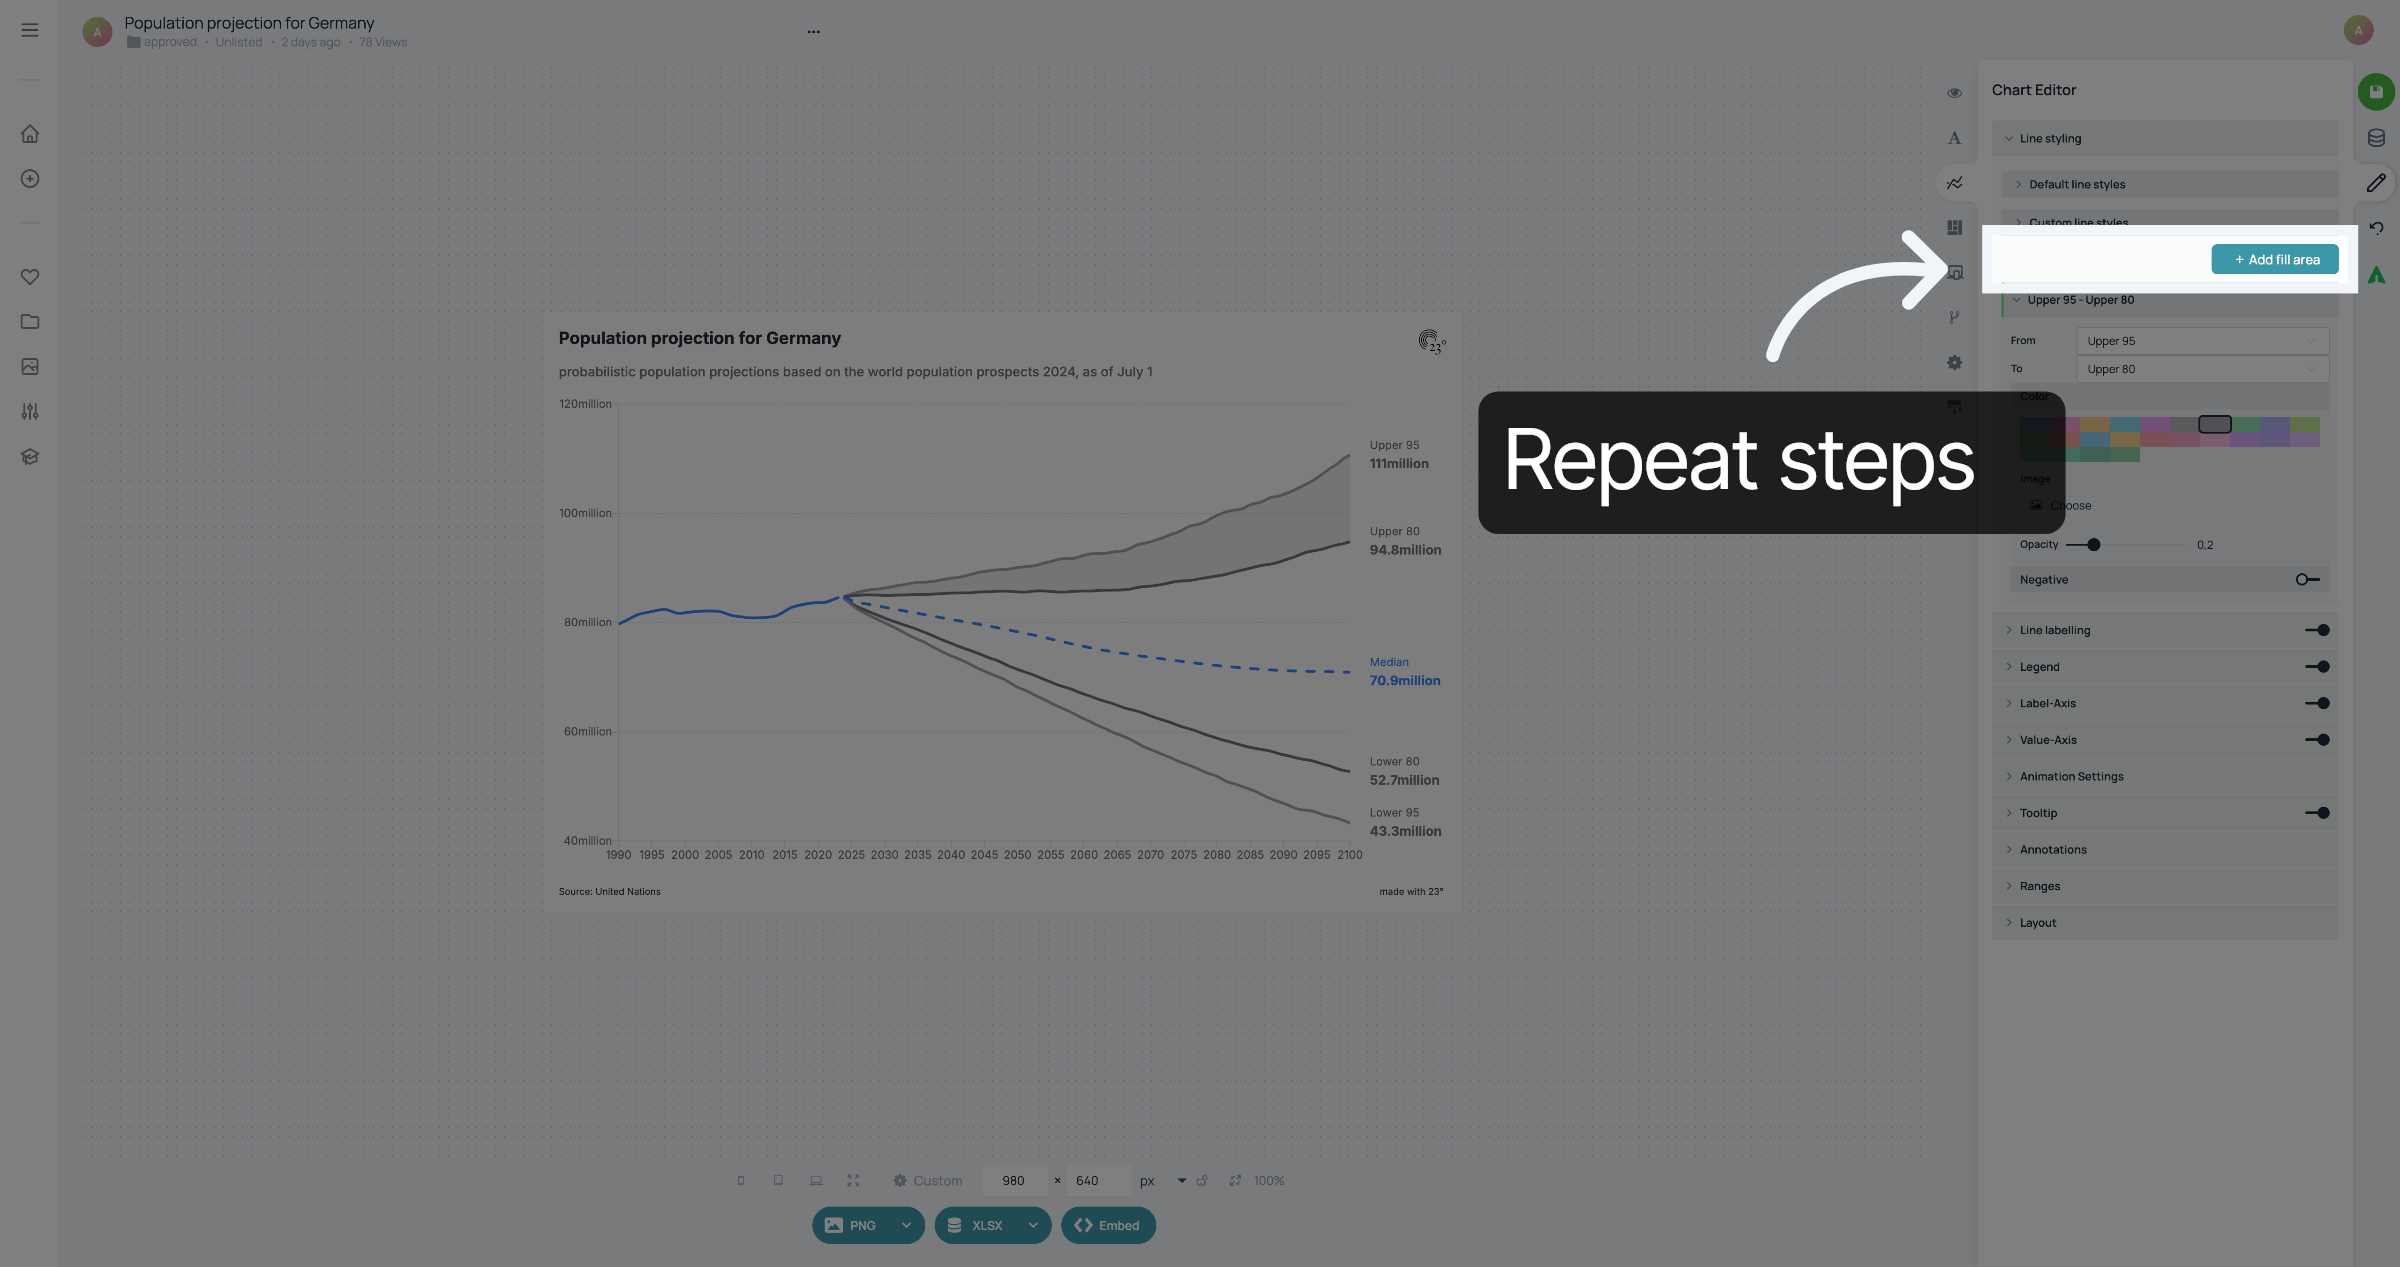
8. Repeat steps
To fill another area, click "Add fill area" again and repeat the steps.
9. Repeat steps
You can choose a colour and opacity for every area.
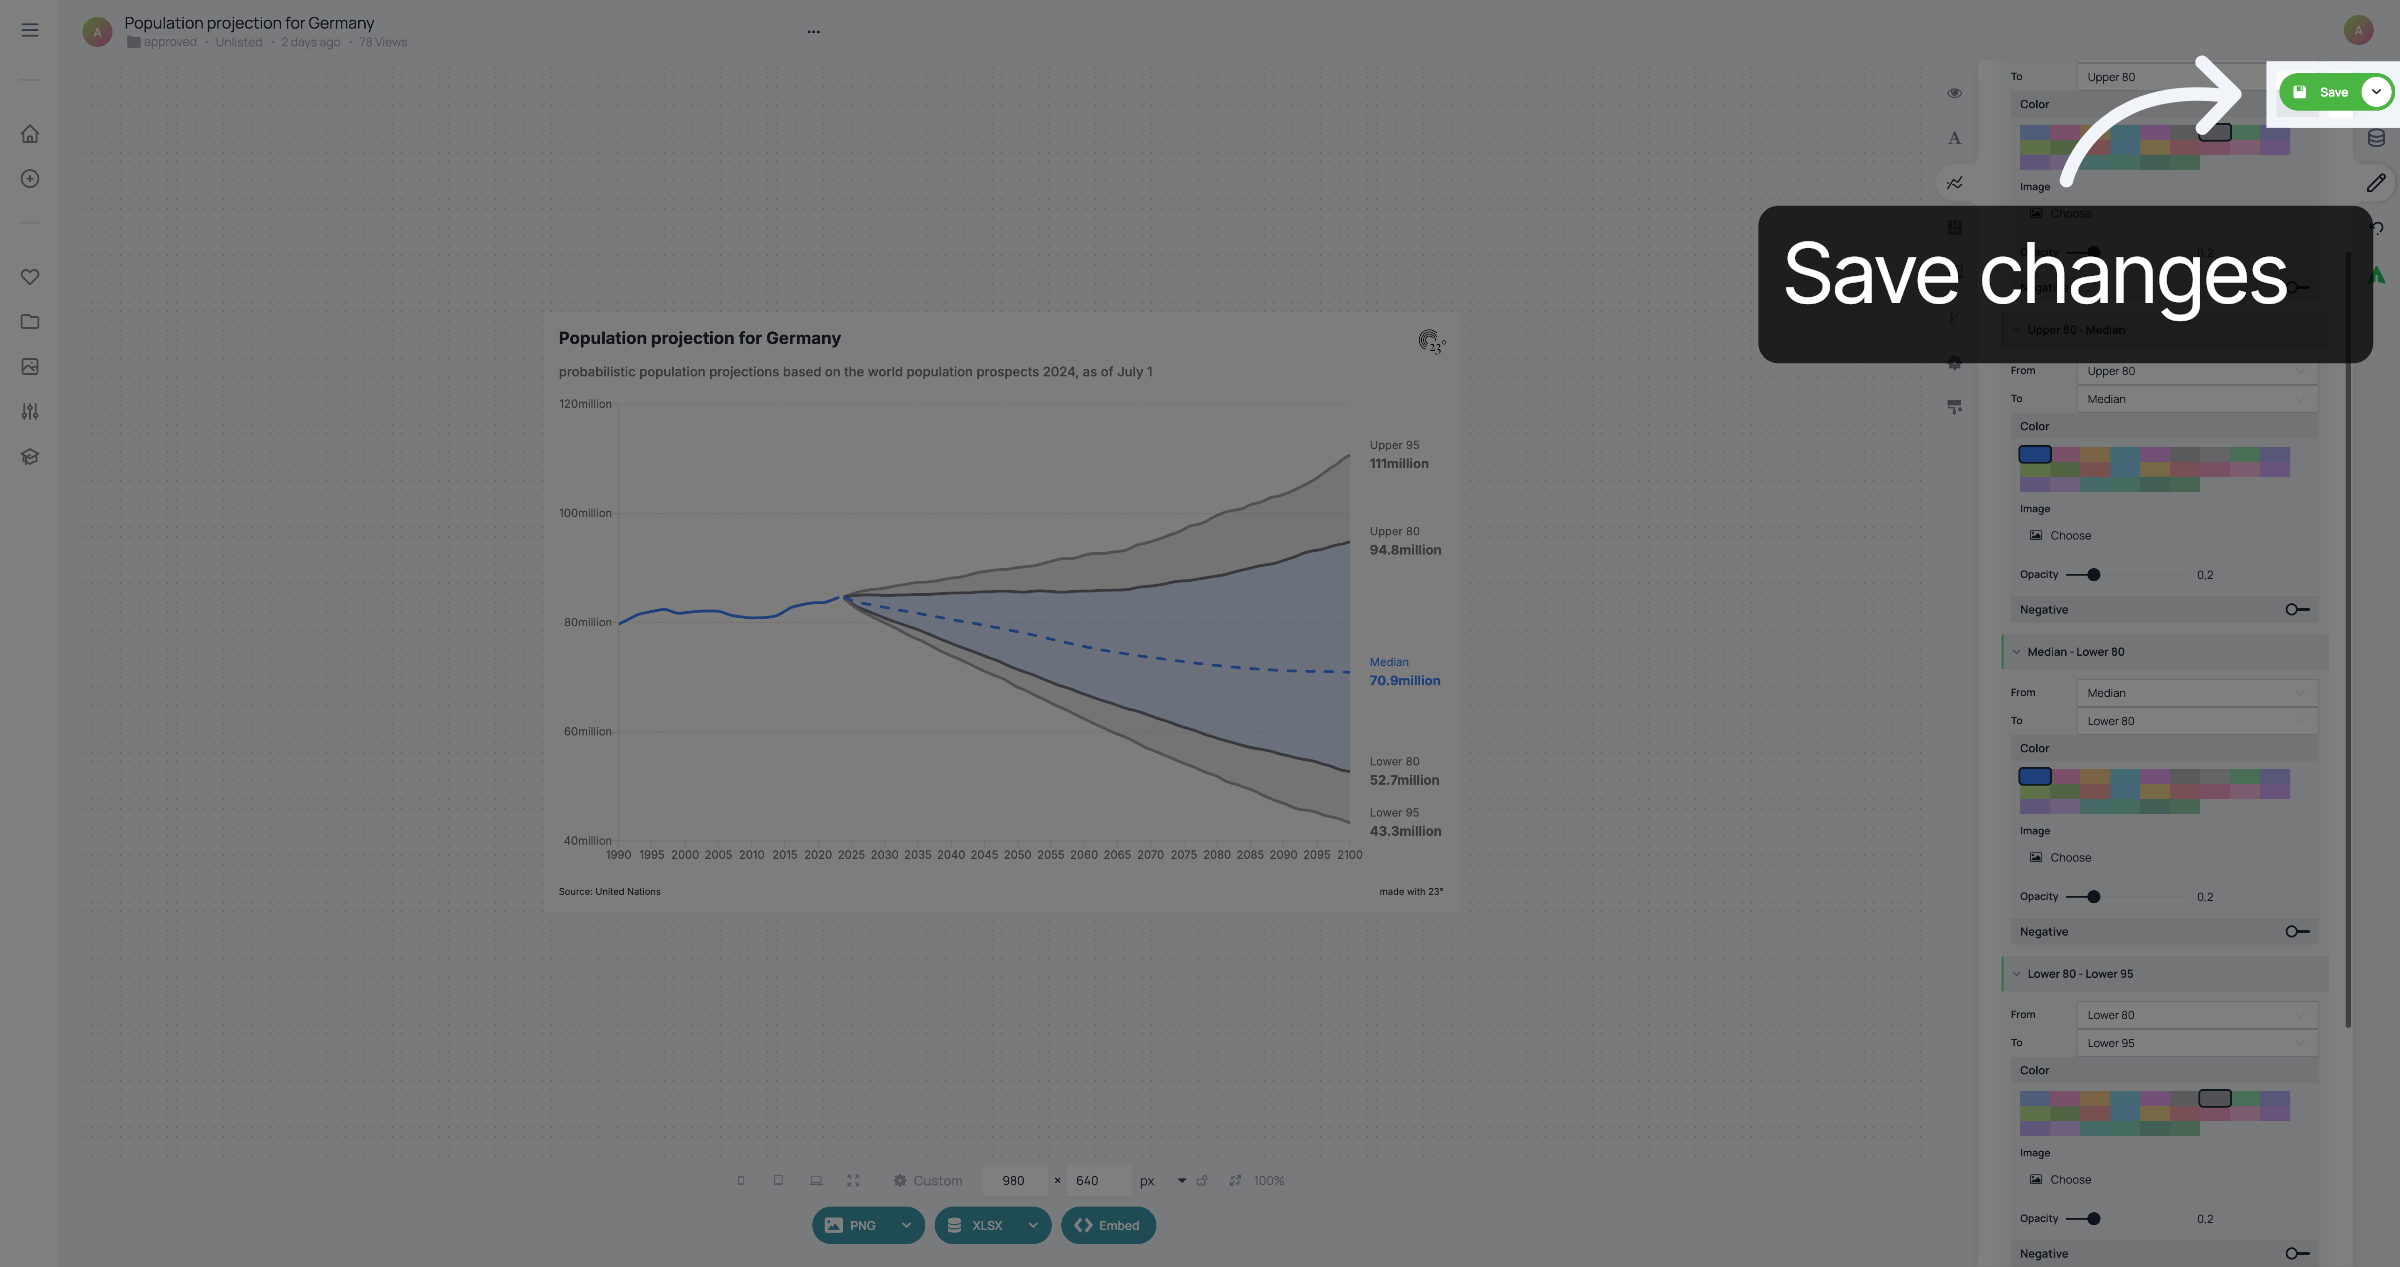
10. Save changes
When you're done, don't forget to save your changes.
You have successfully filled the areas between lines in your line chart.