Filters: Buttons
This tutorial guides you through configuring button filters to customize your data visualization effectively.
You will learn how to add, adjust, and style button filters to enhance your statistics display.
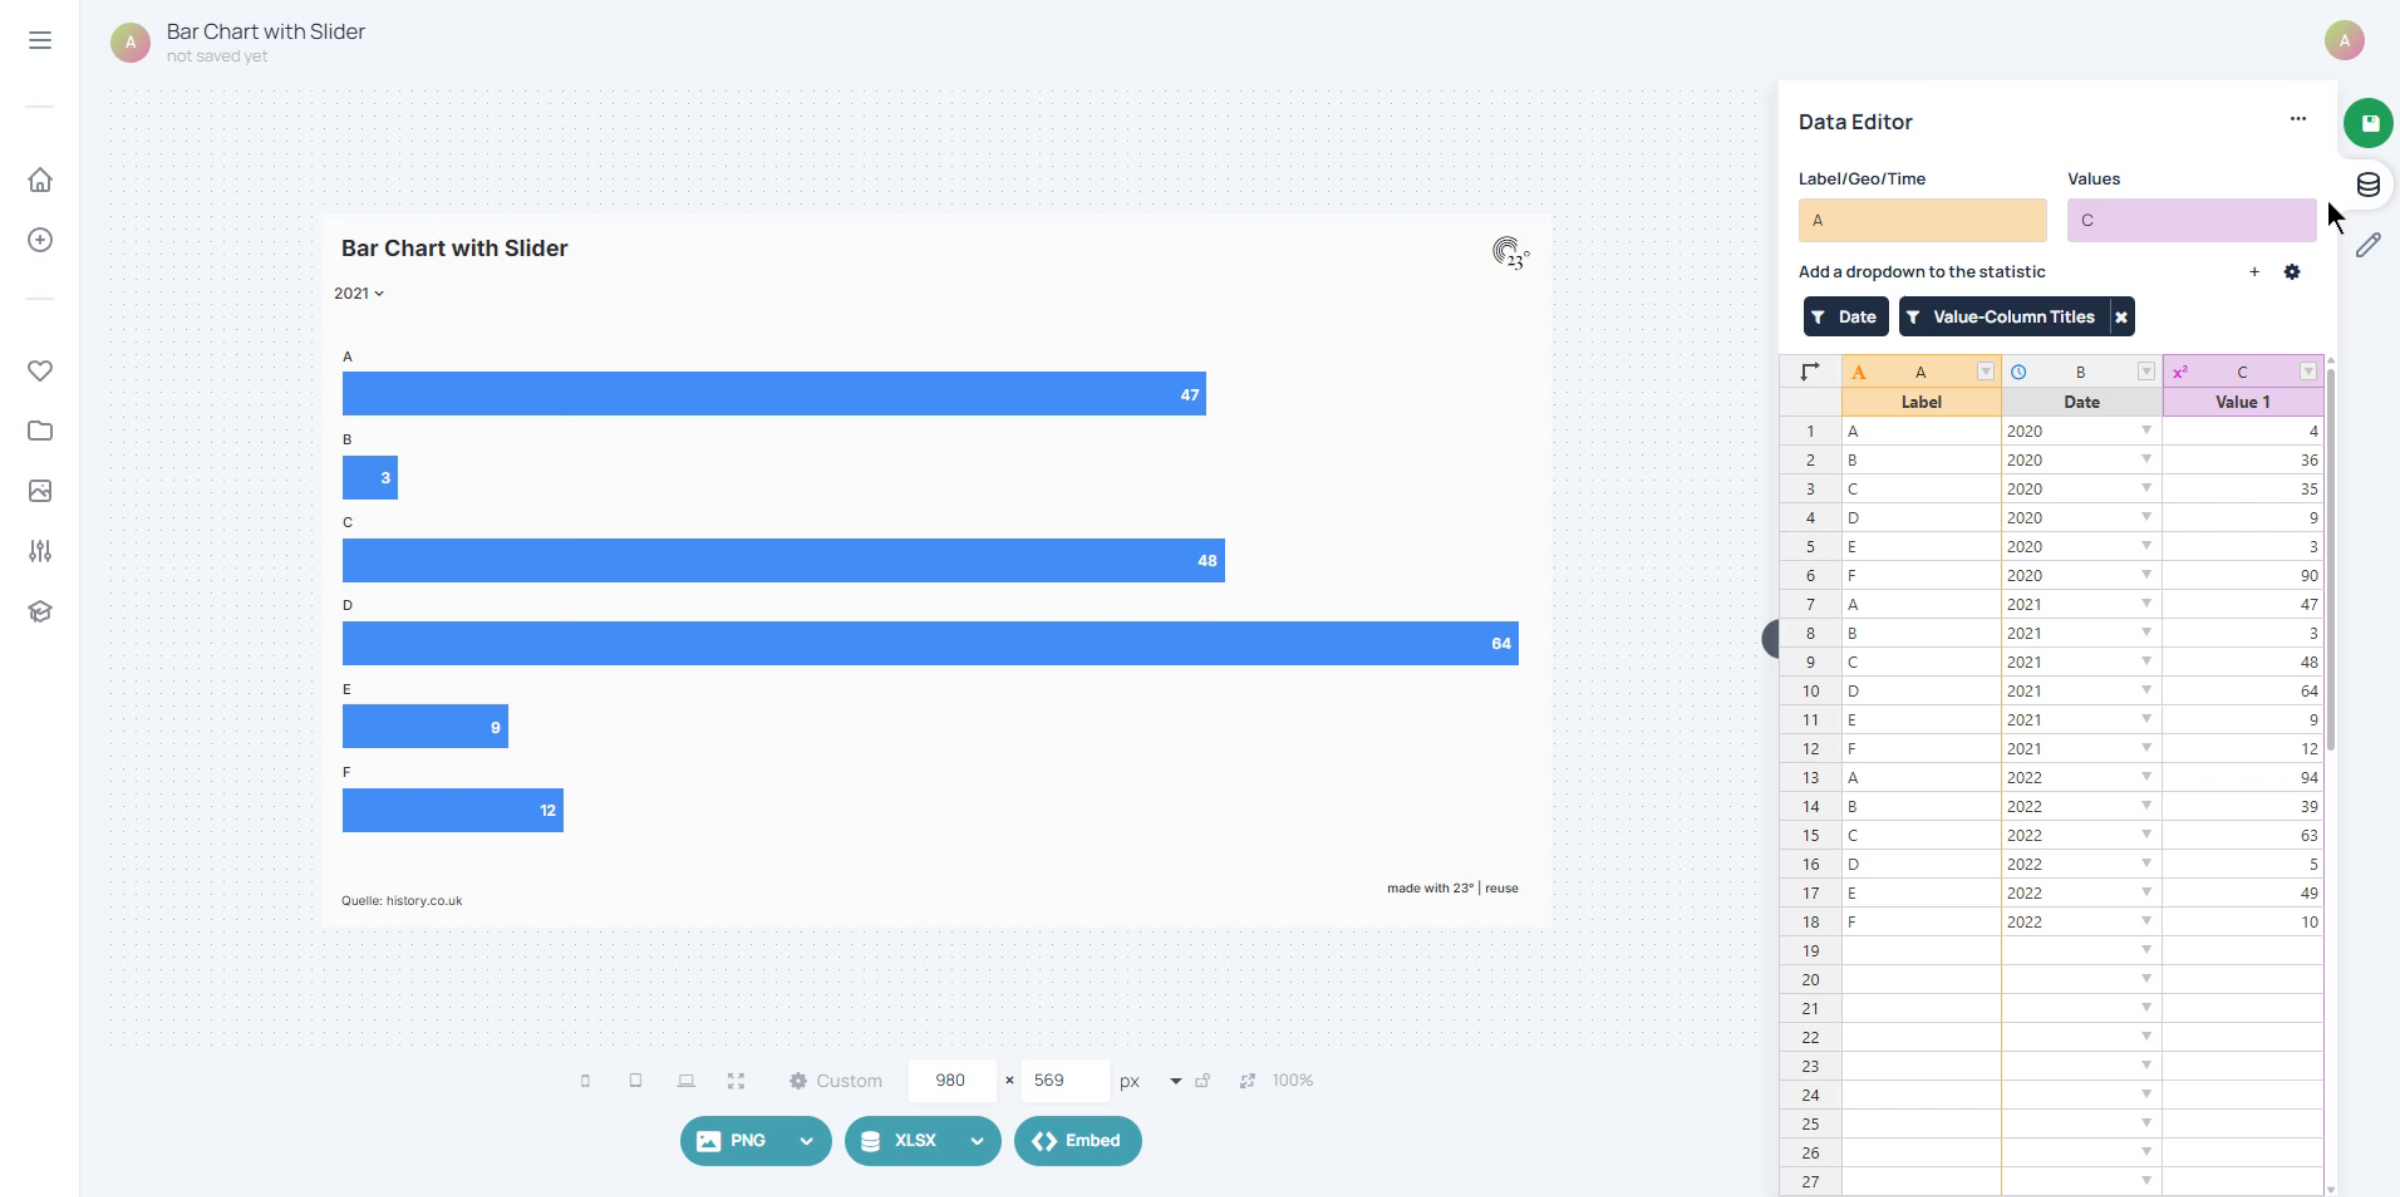
To switch your Dropdown Filter to a Button Filter go to the data editor
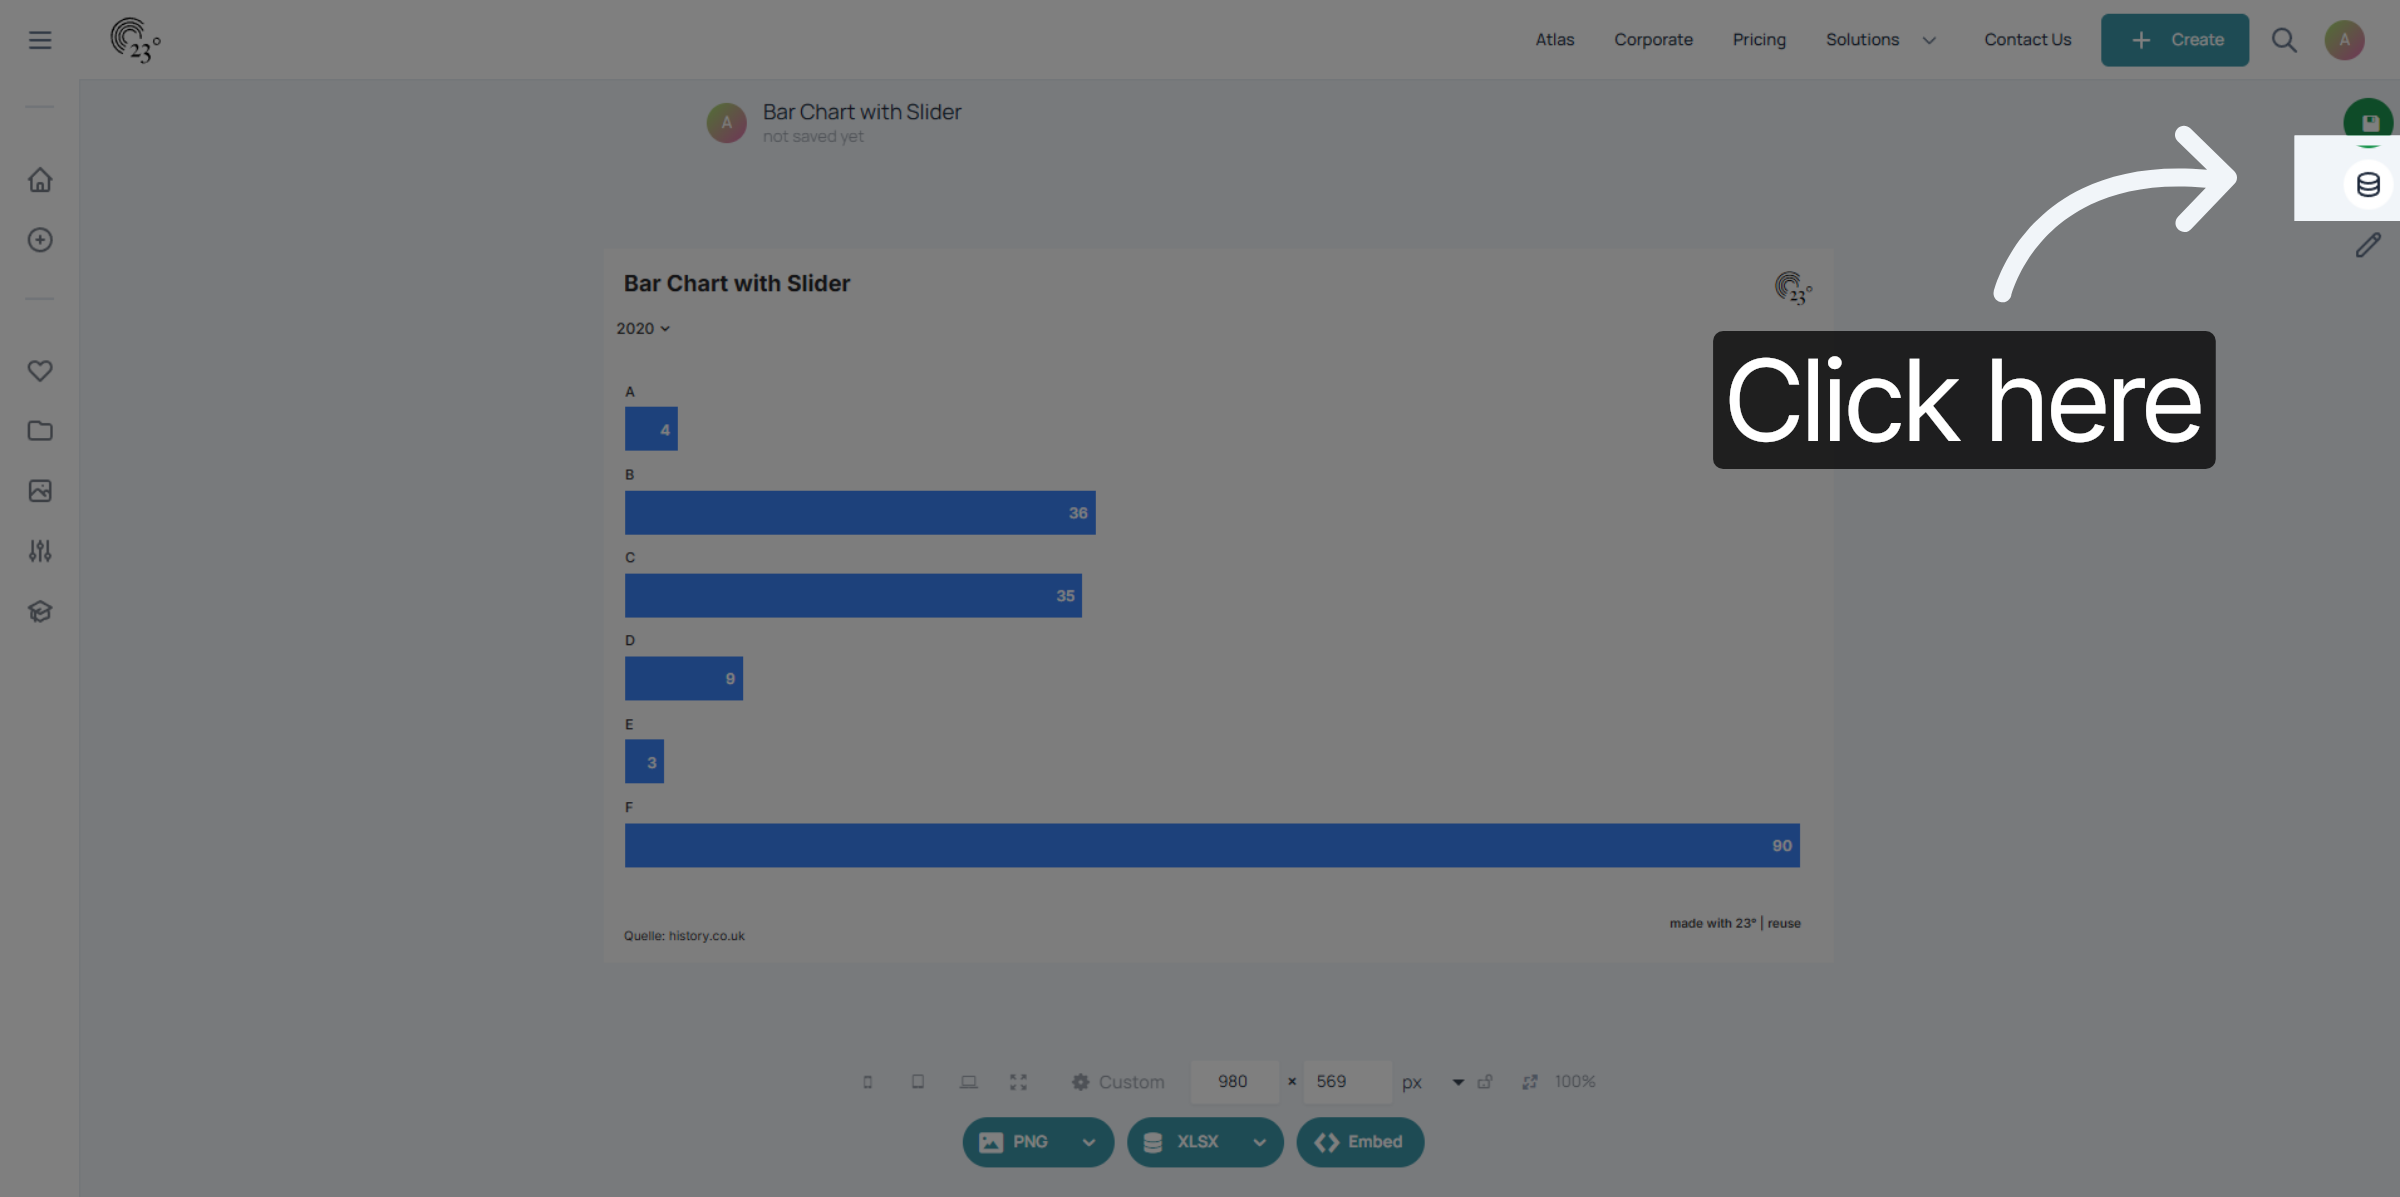
Select your filter.
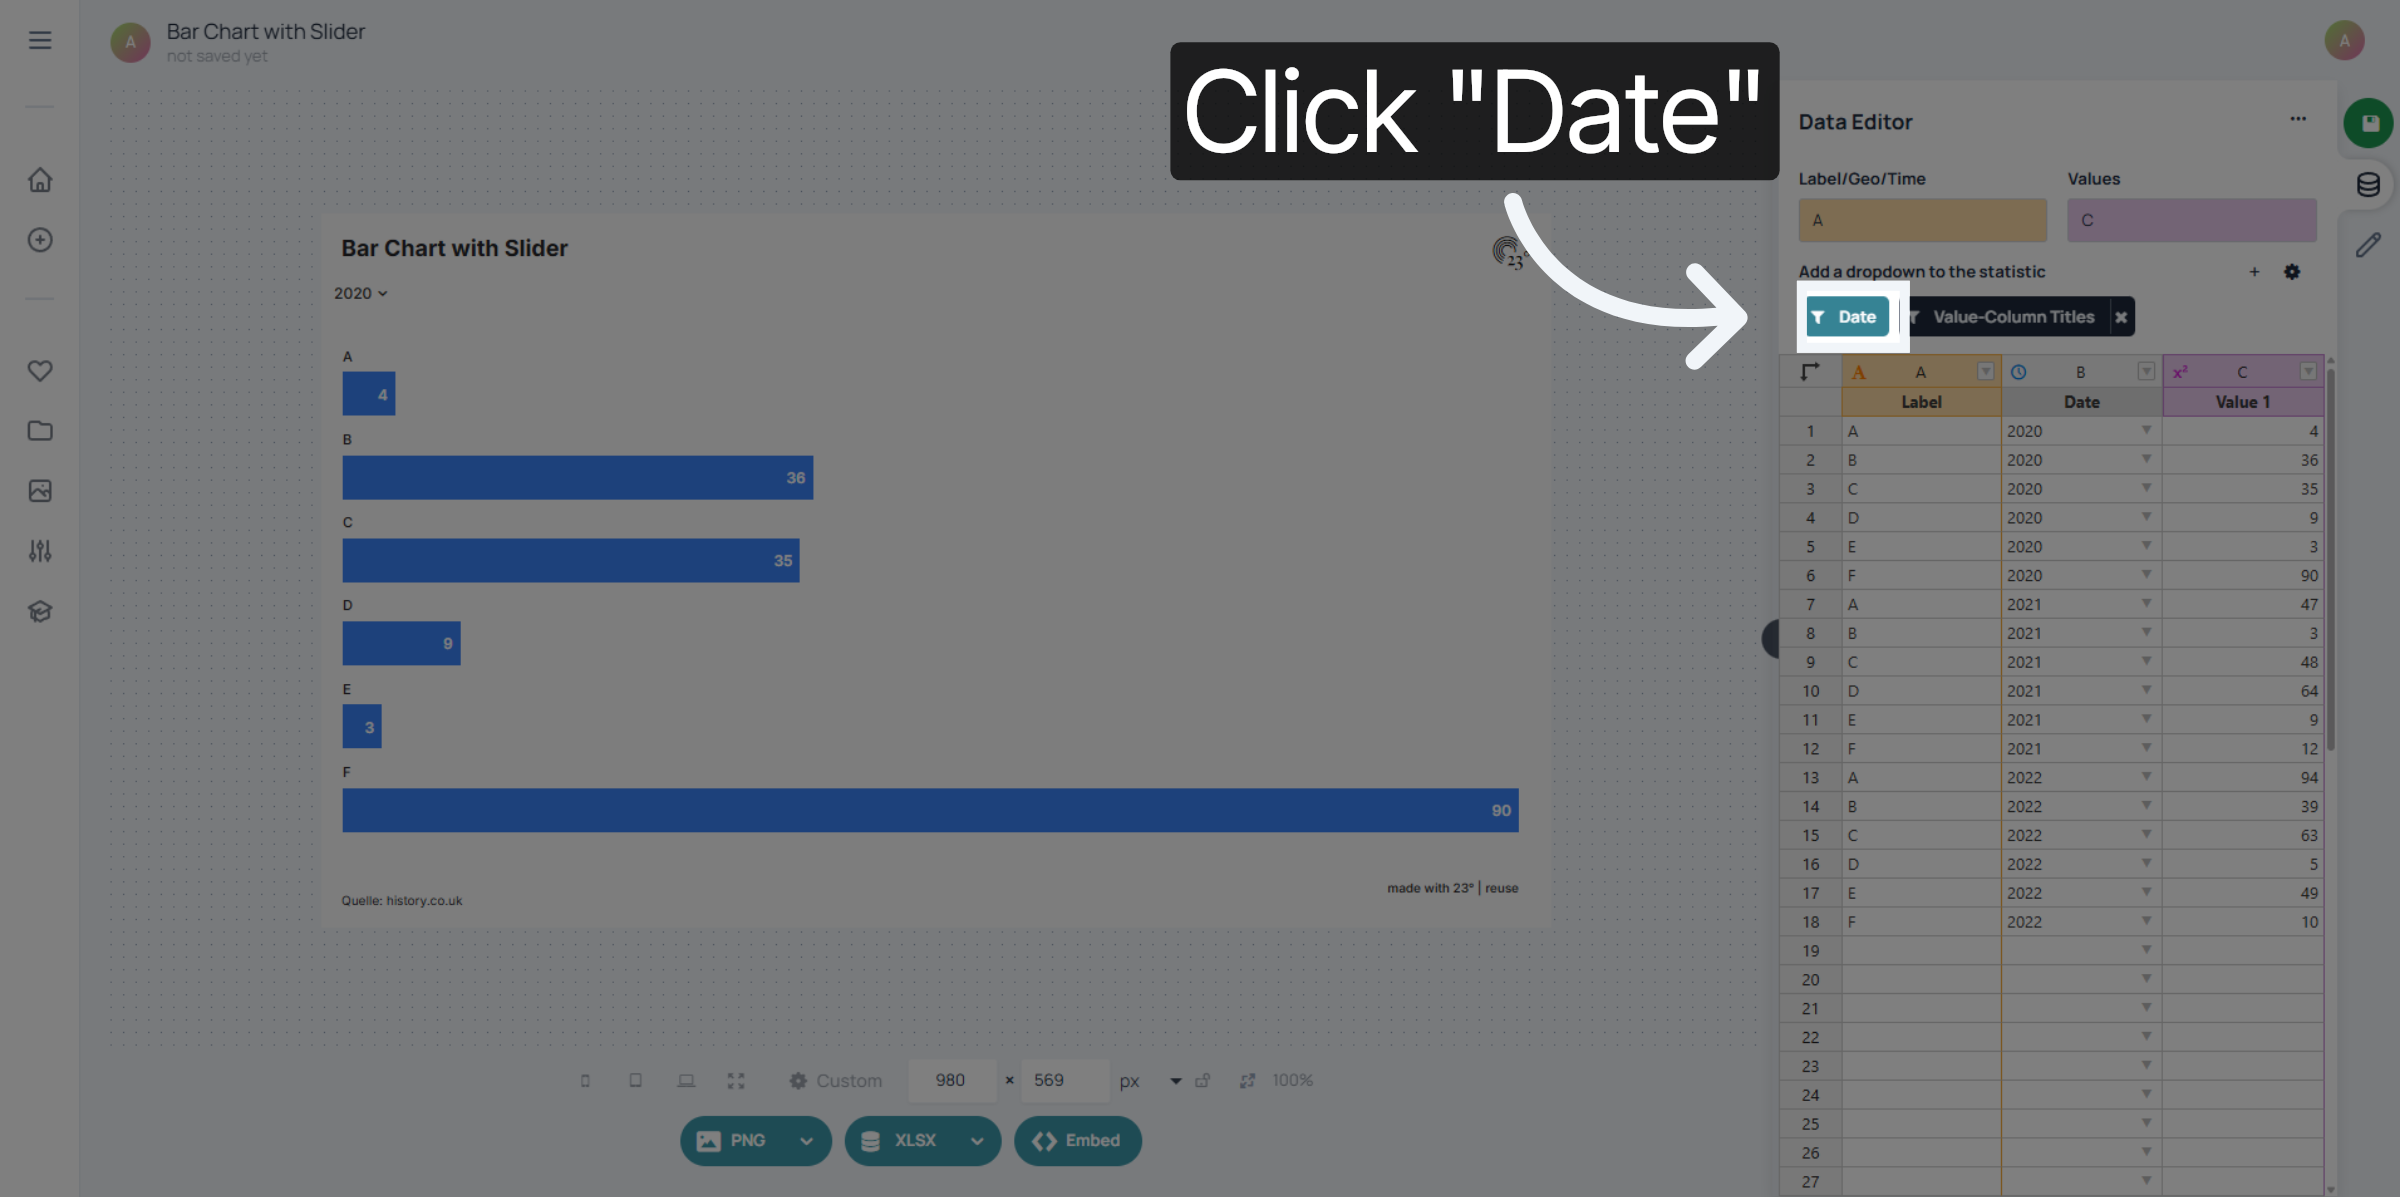
Click "Buttons" to apply button-based filters to your statistics.
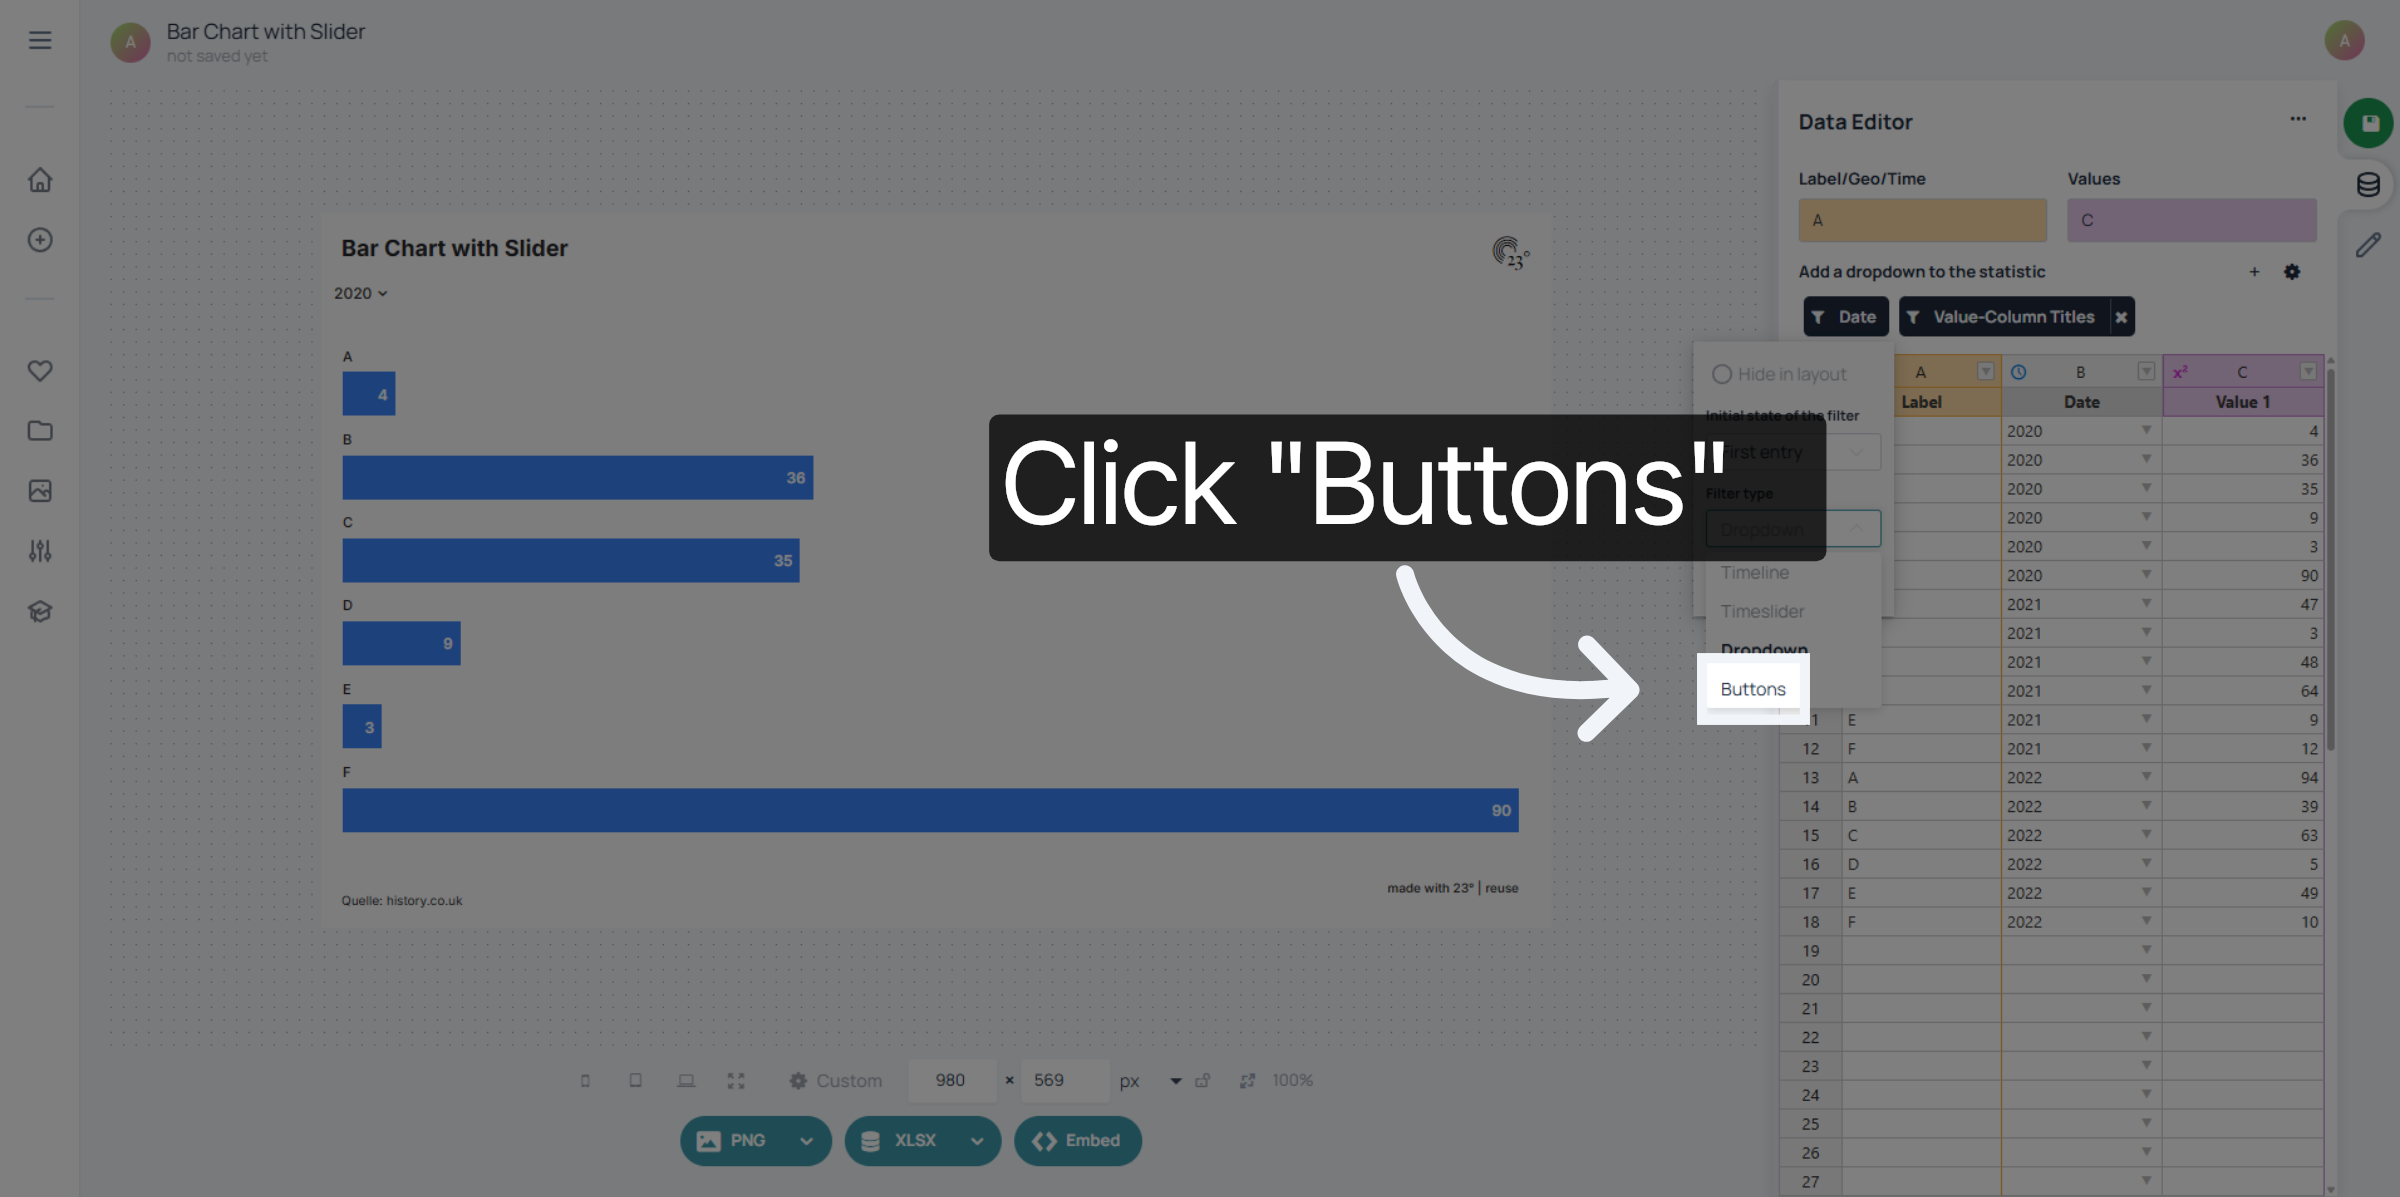
Go to the chart editor to get to the button filter settings.
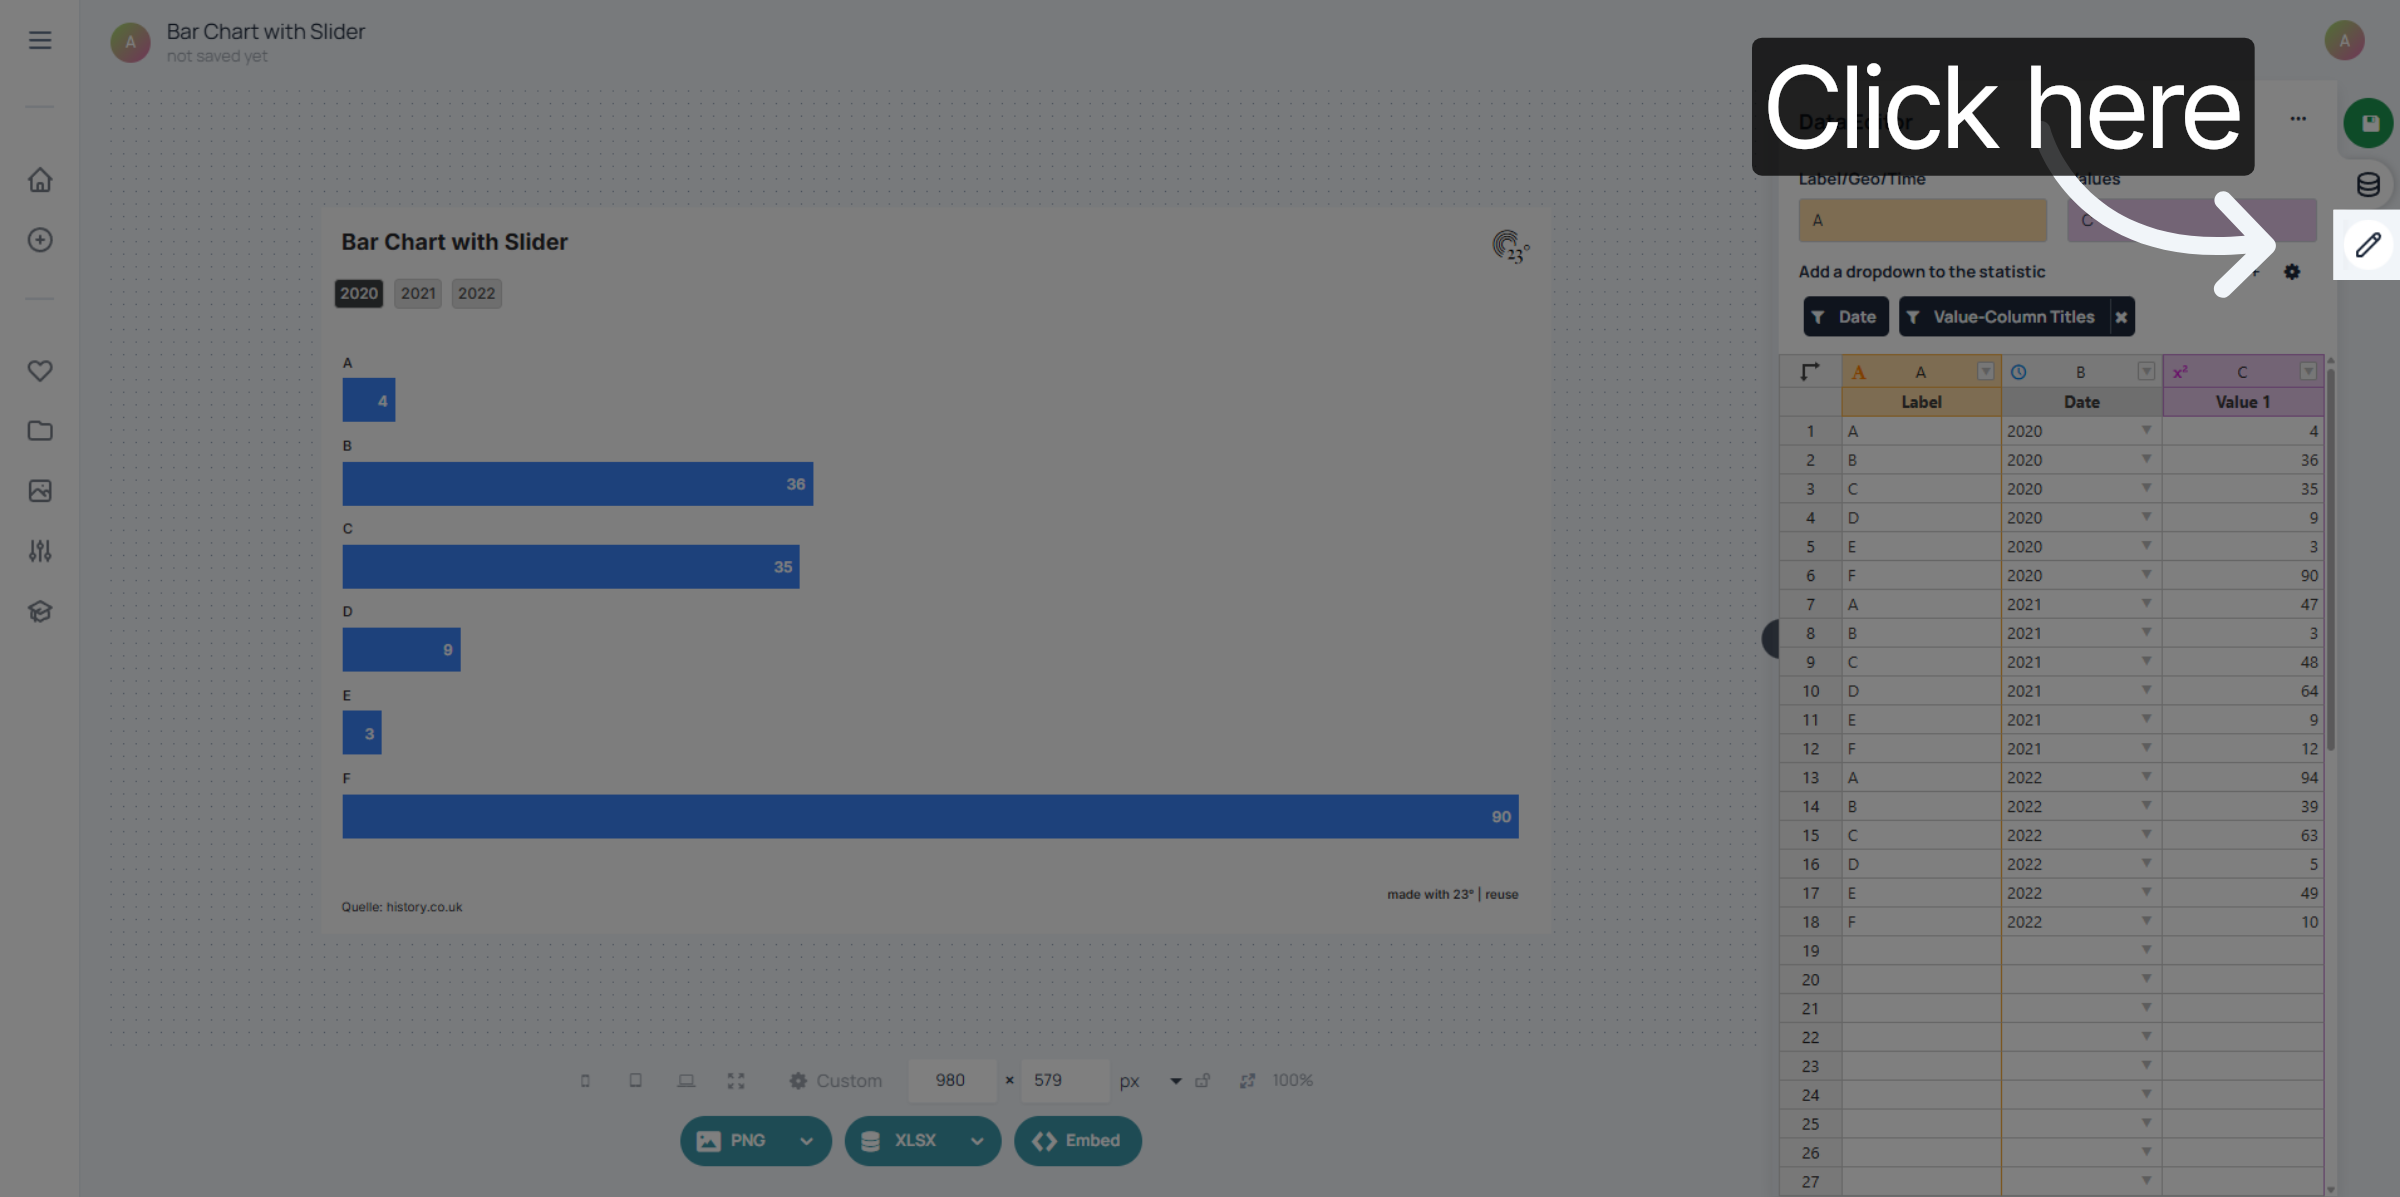
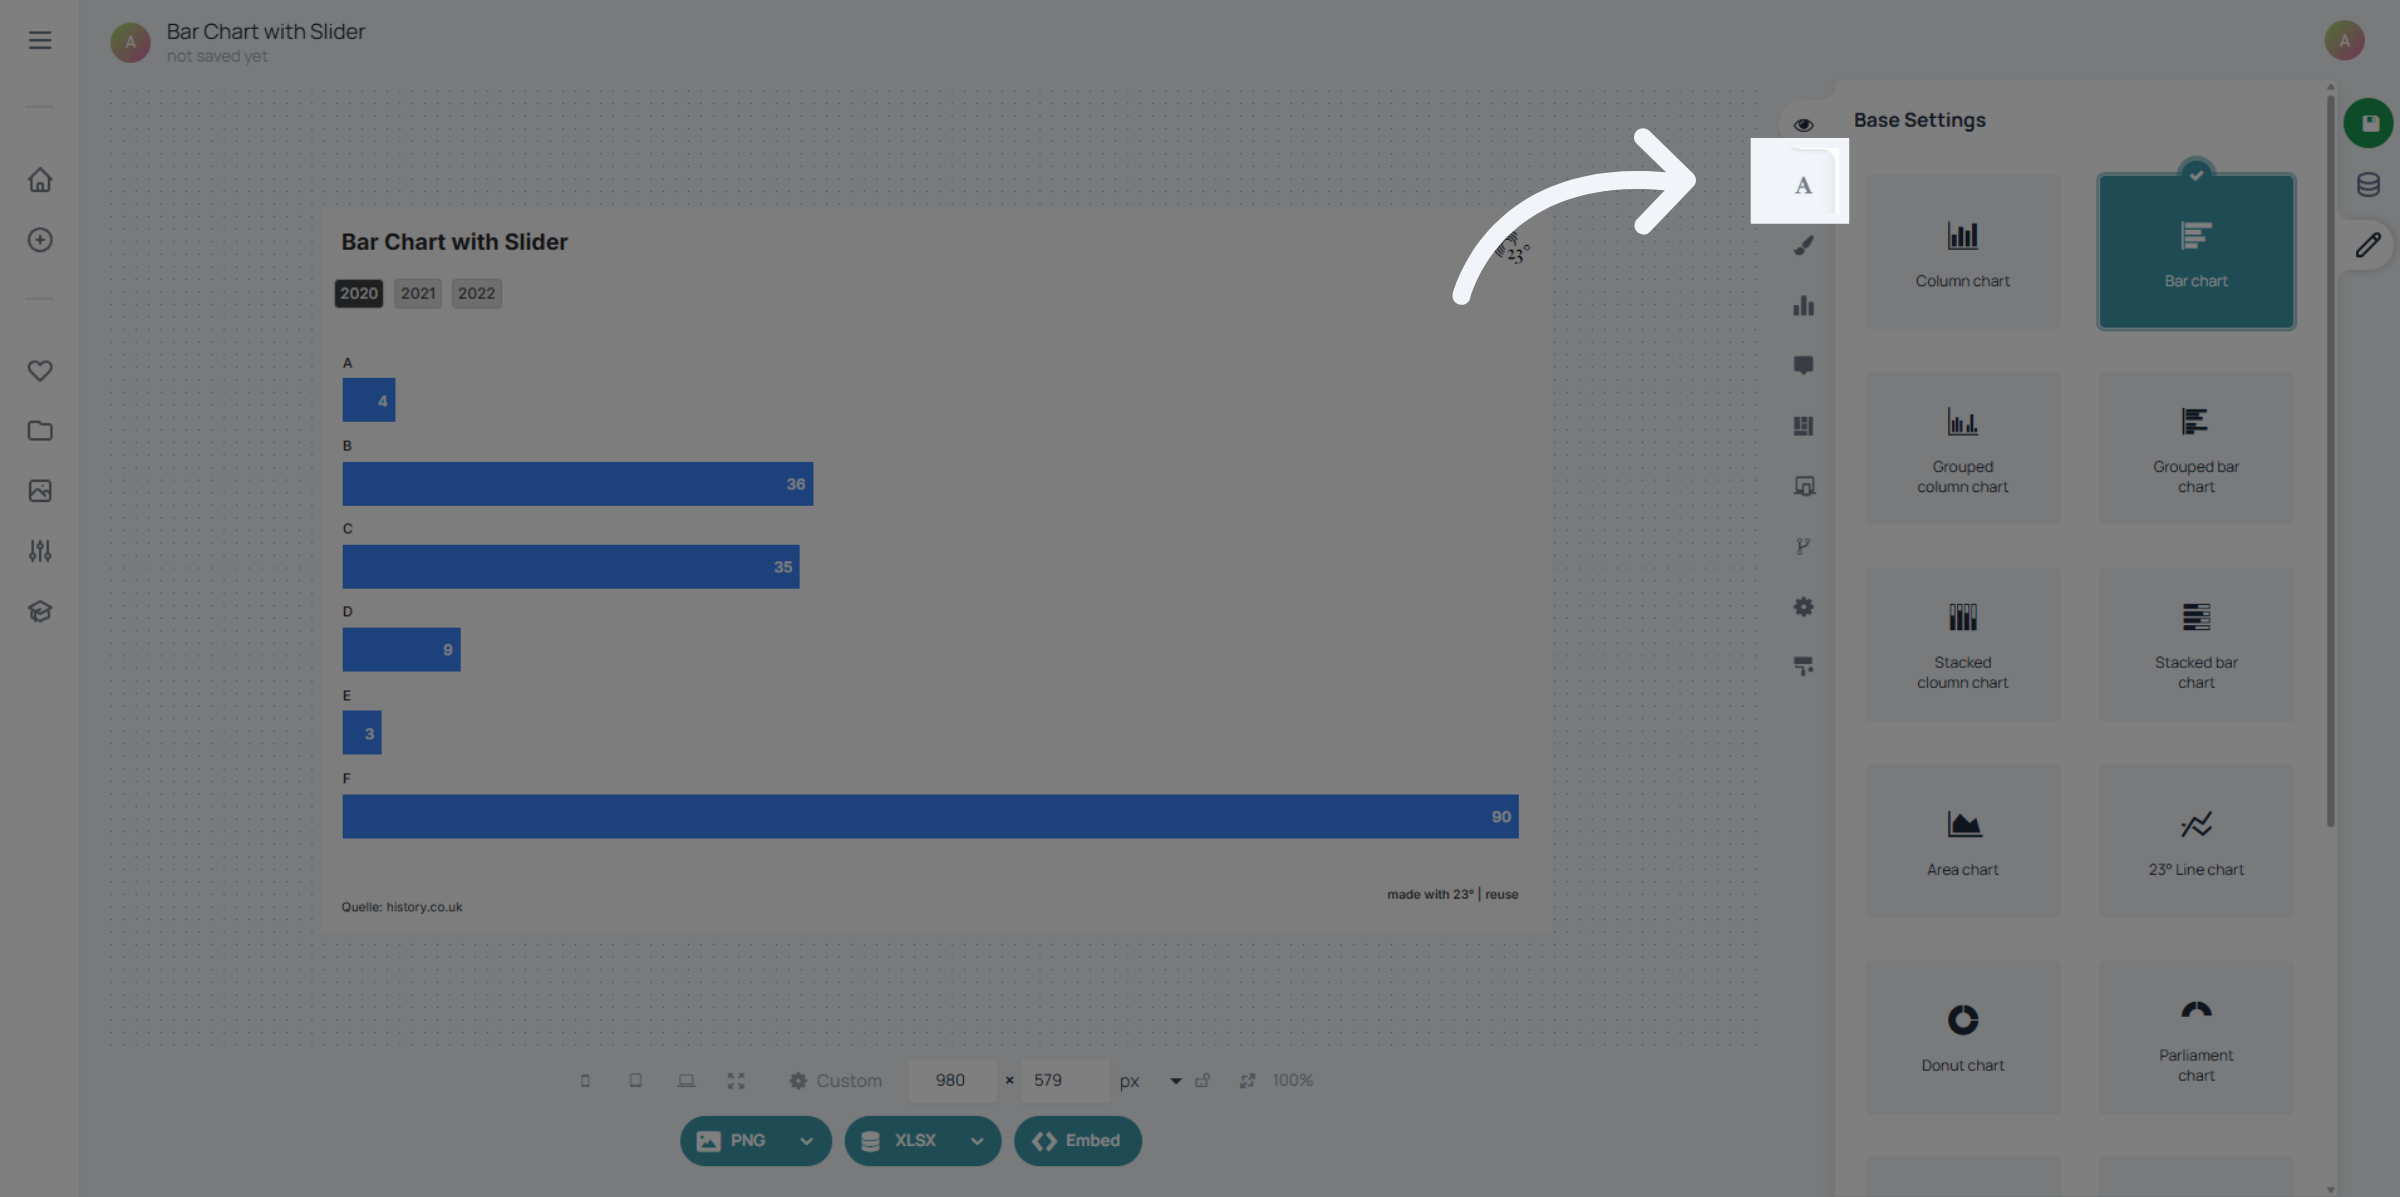
Go to the text editor.
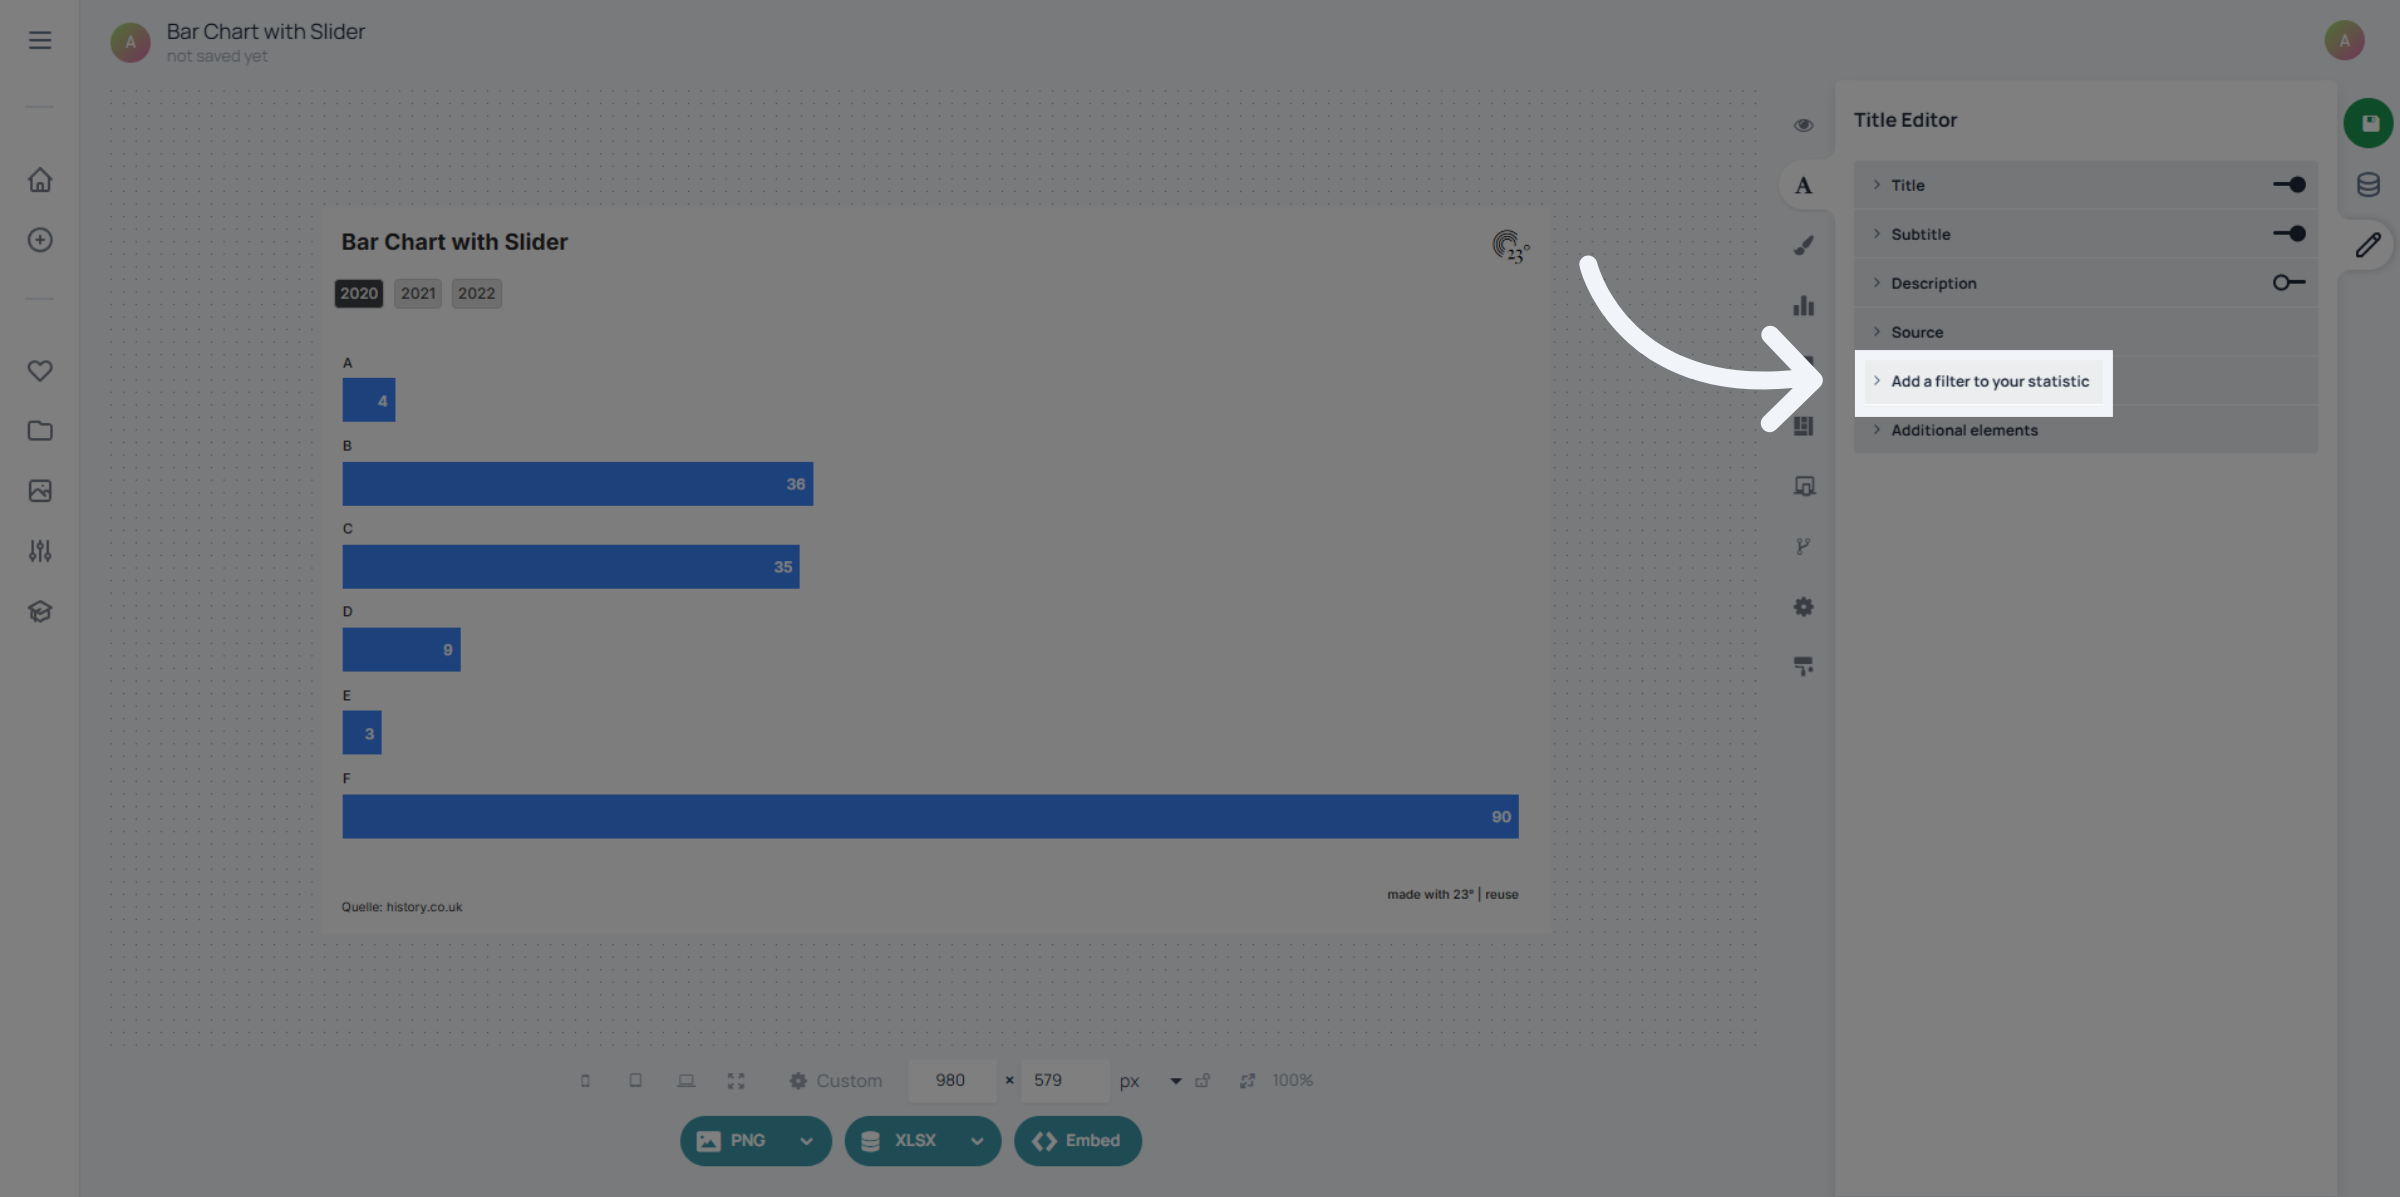
Go to add filter to your statistic.
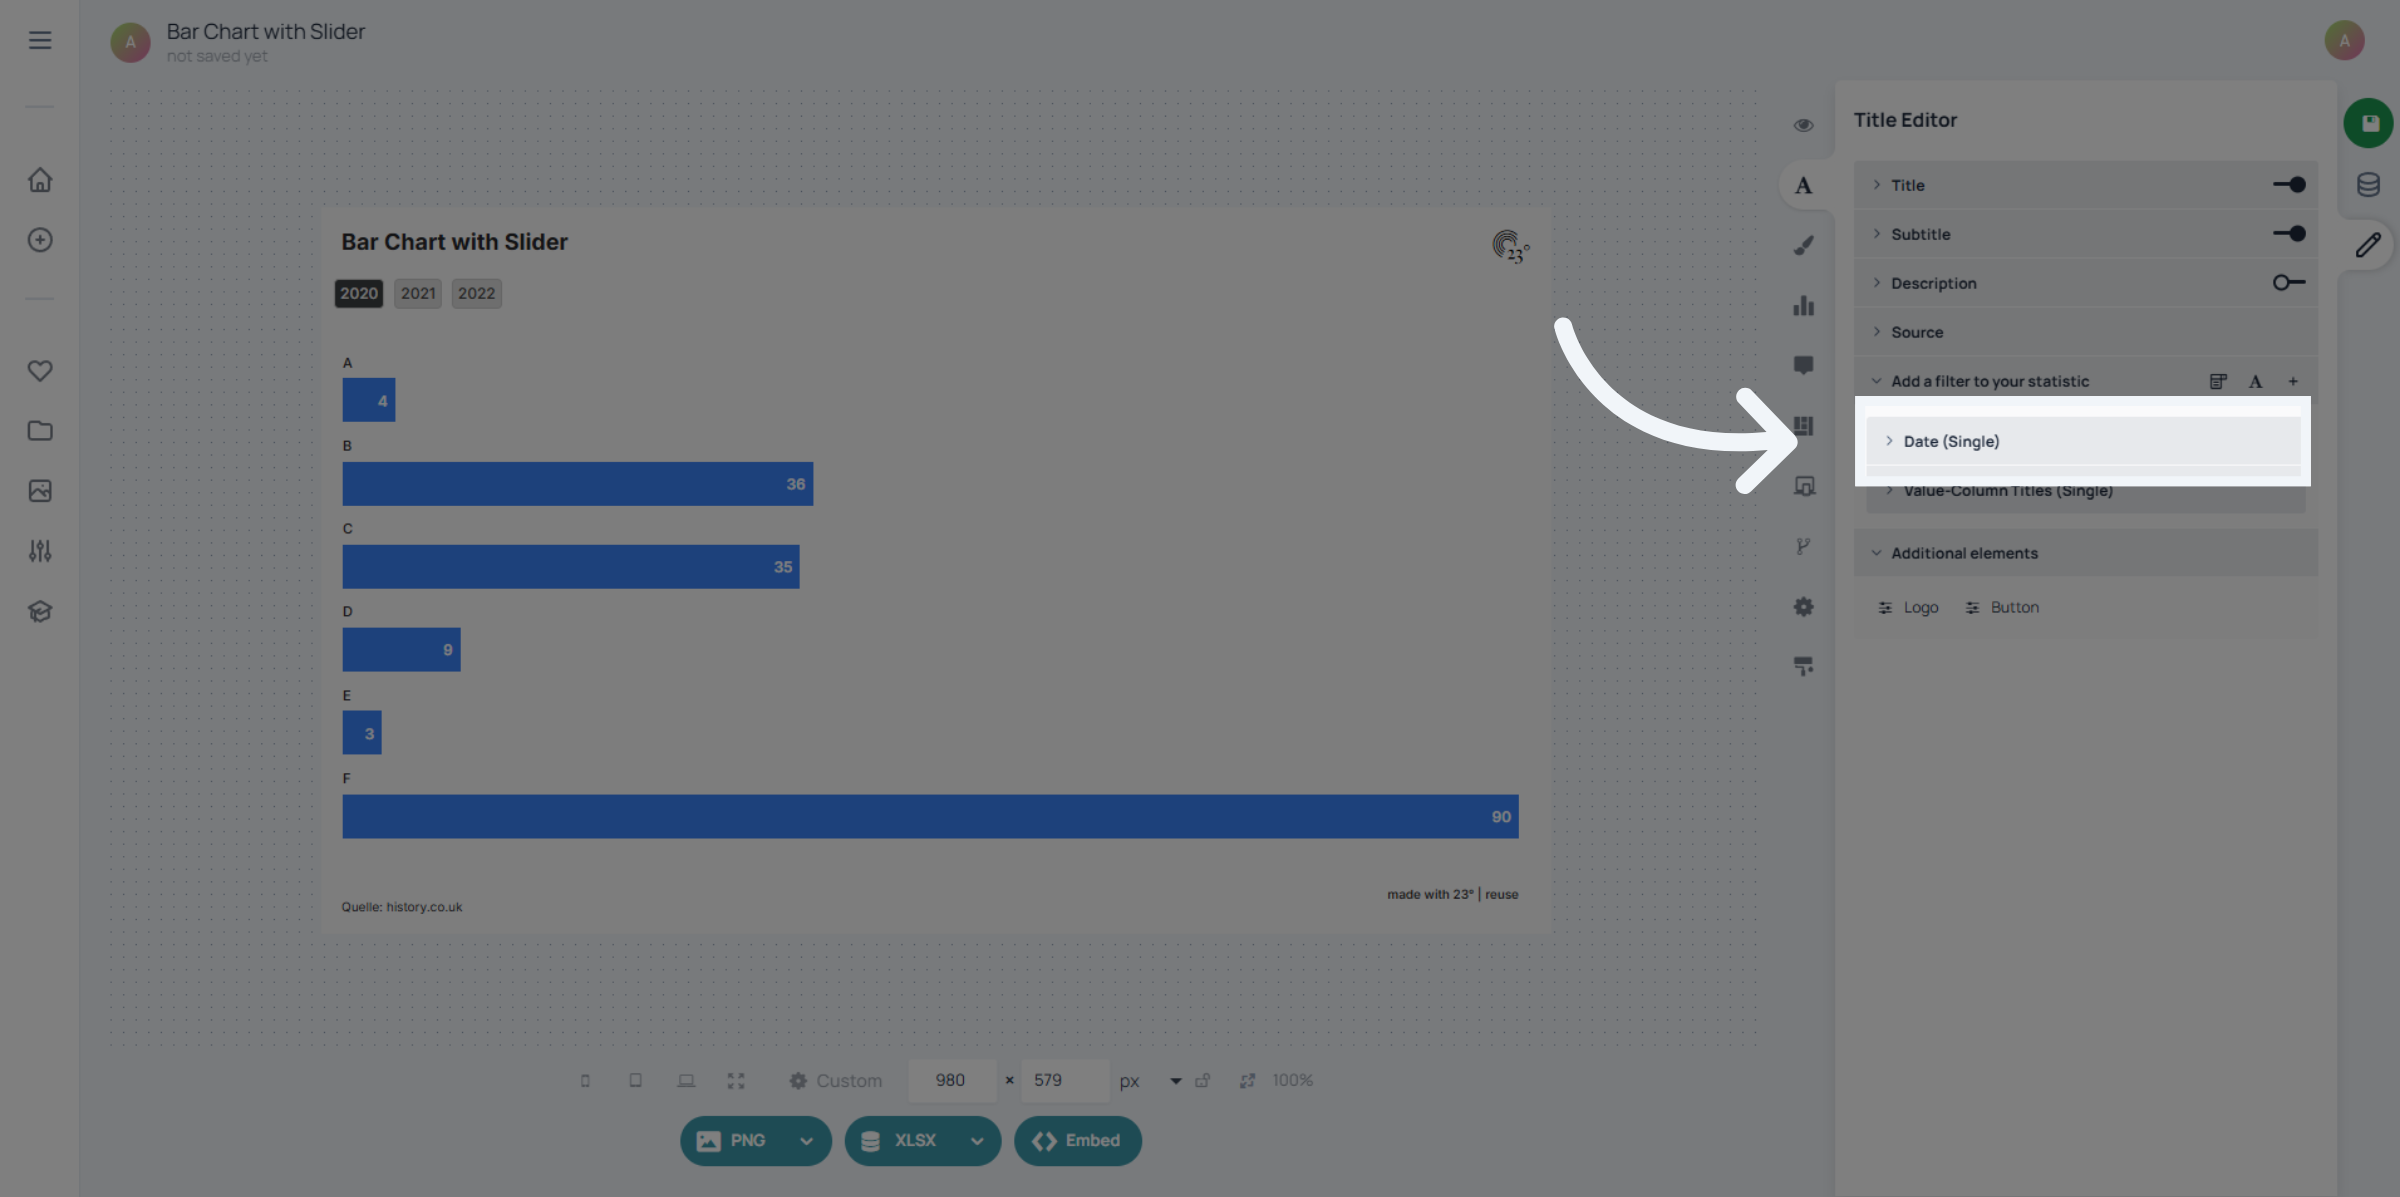
Select your filter.
Here you have all your button filter settings.
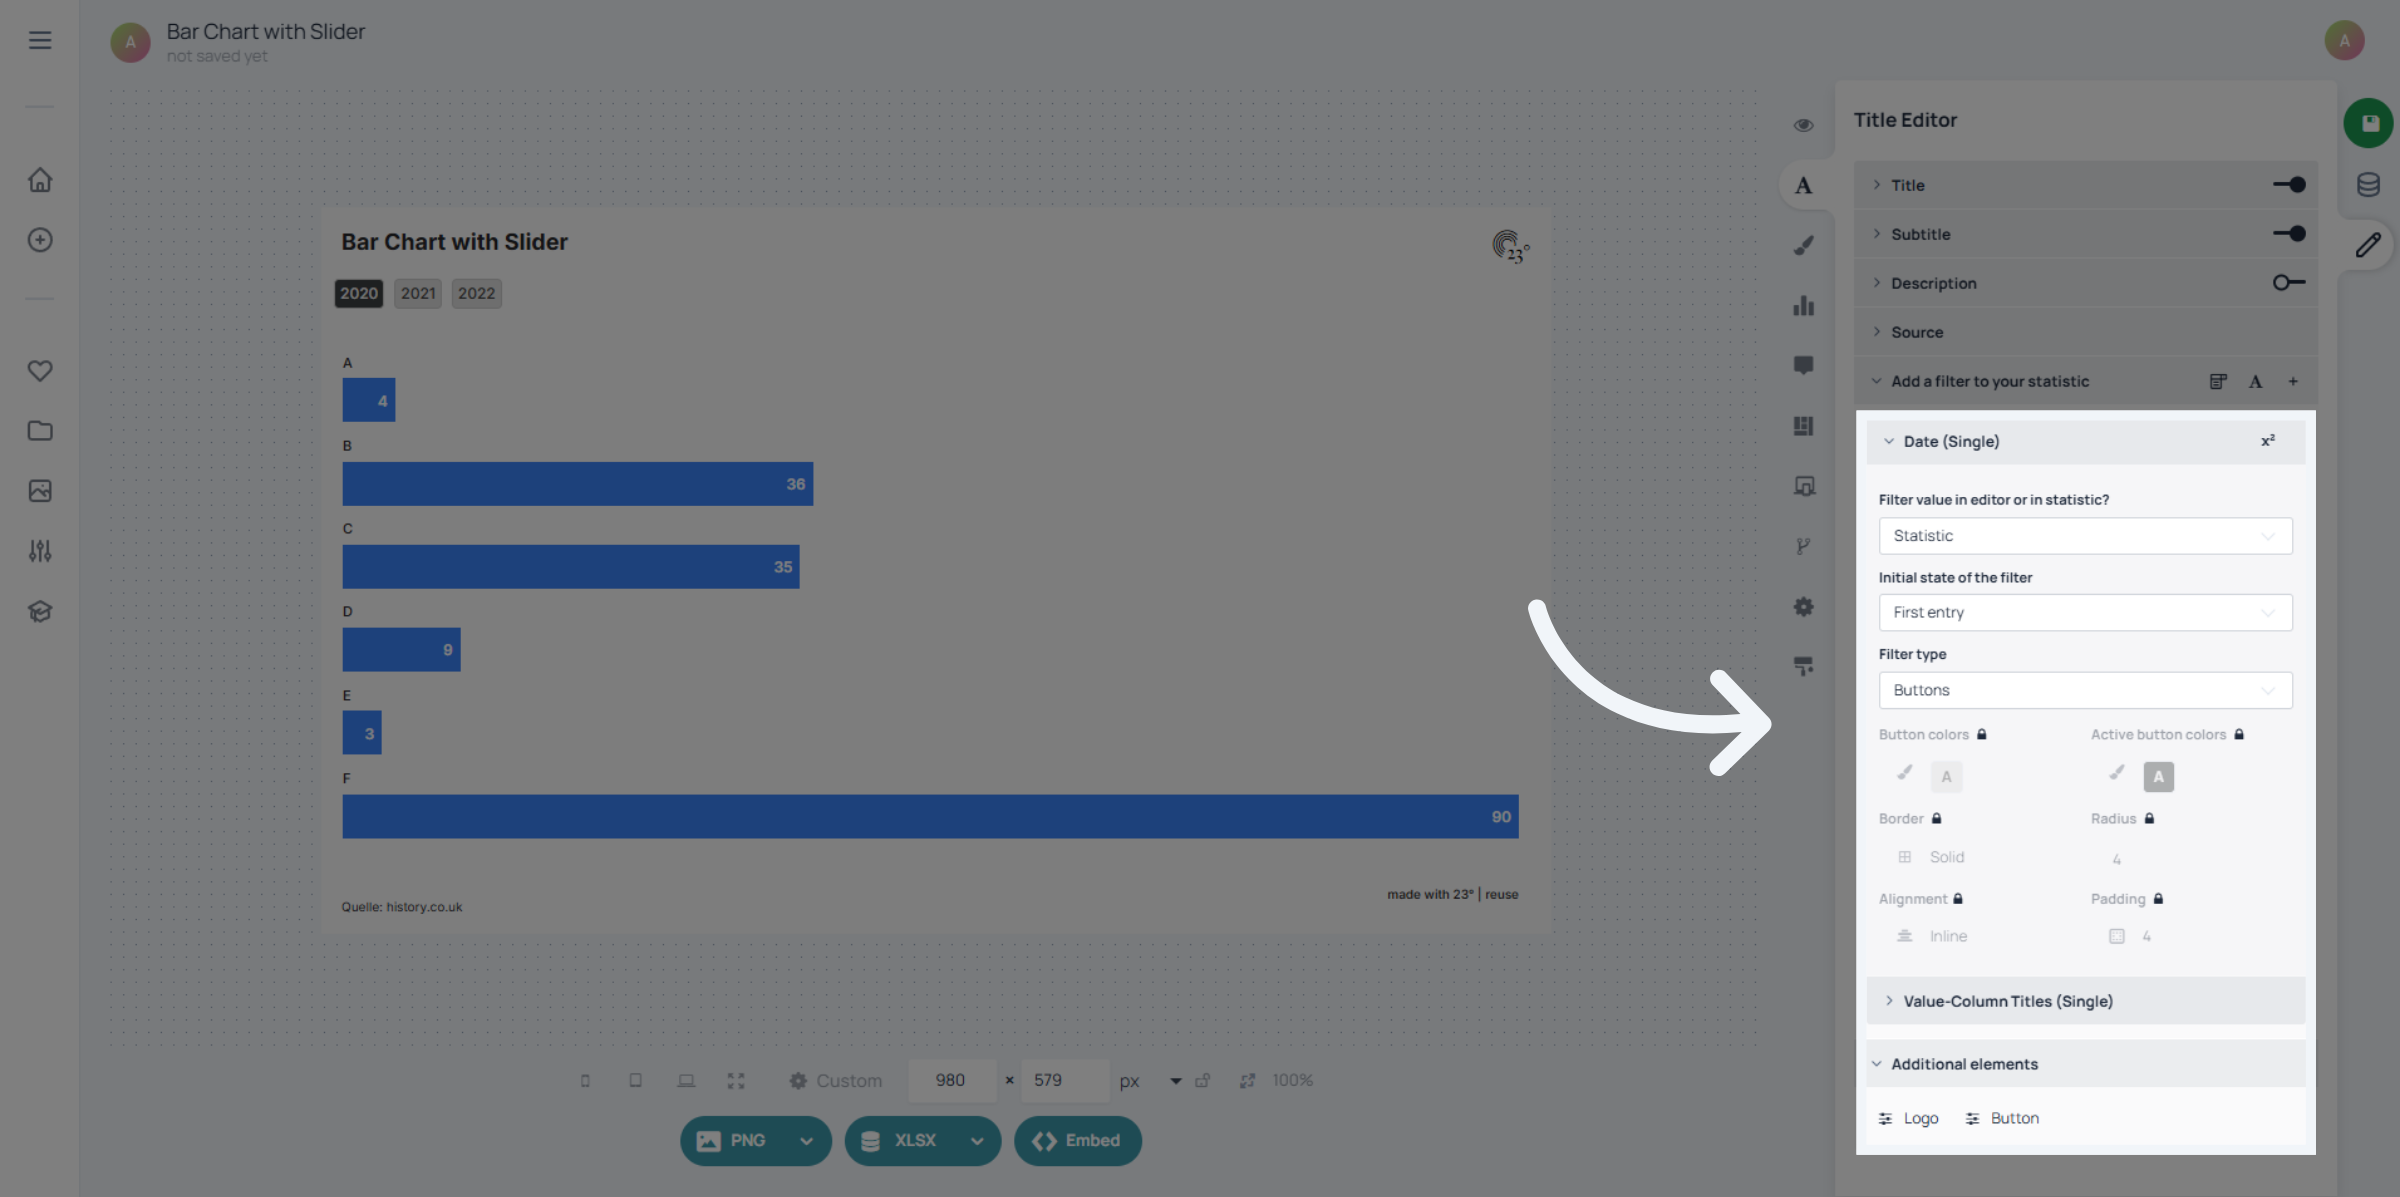
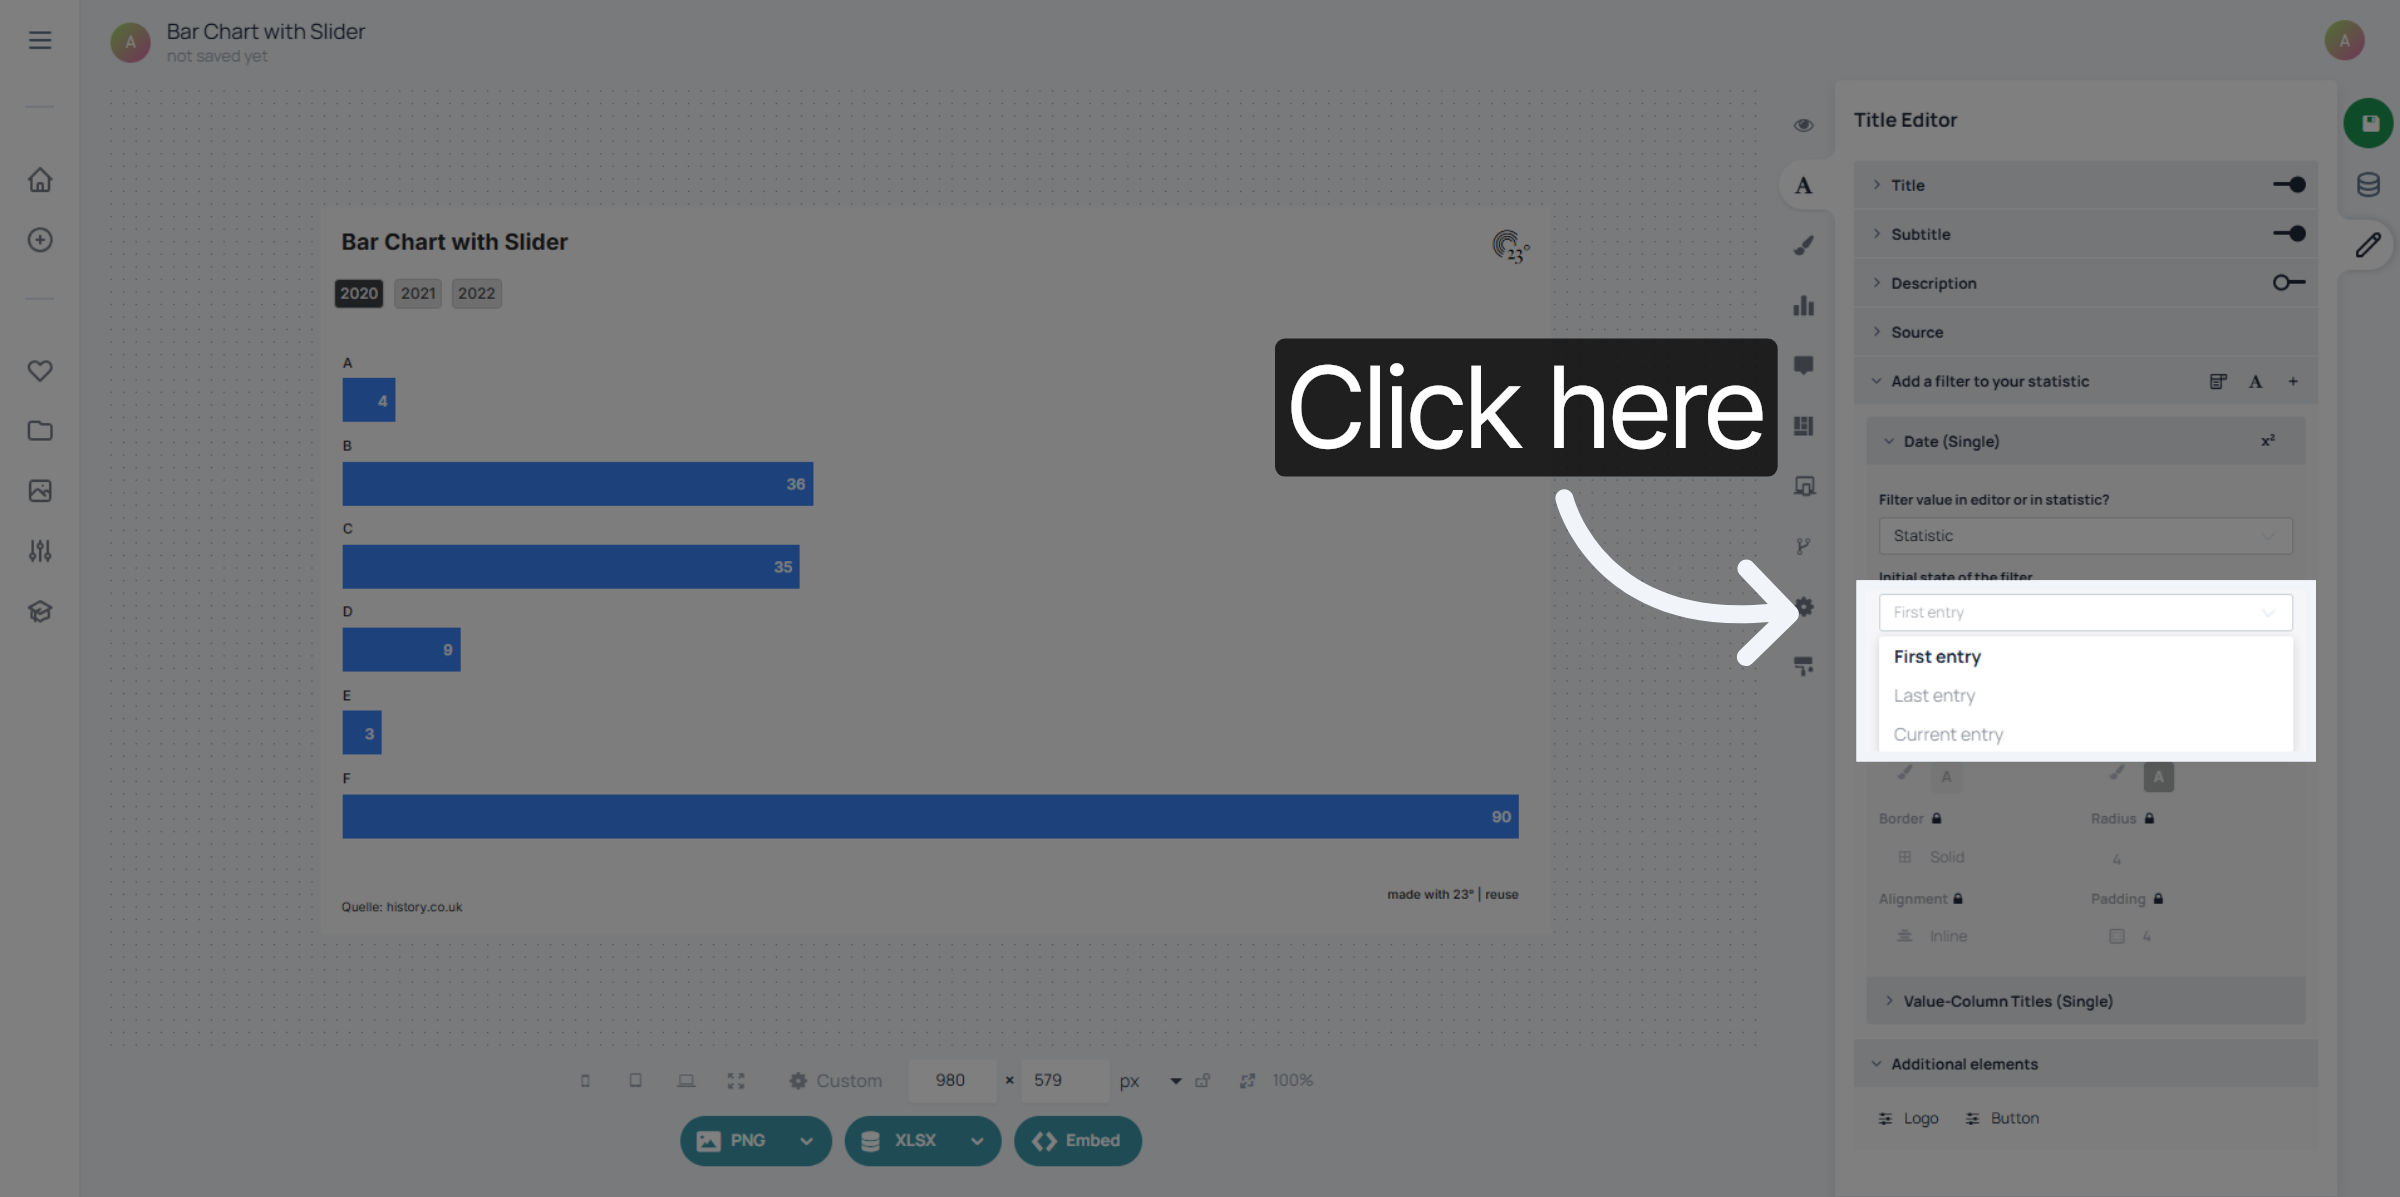
You can chooce which button is preselected in the chart. It can be the first, last or a custom selection. For the custom selection pick your button in the visualisation and save it for it to take affect.
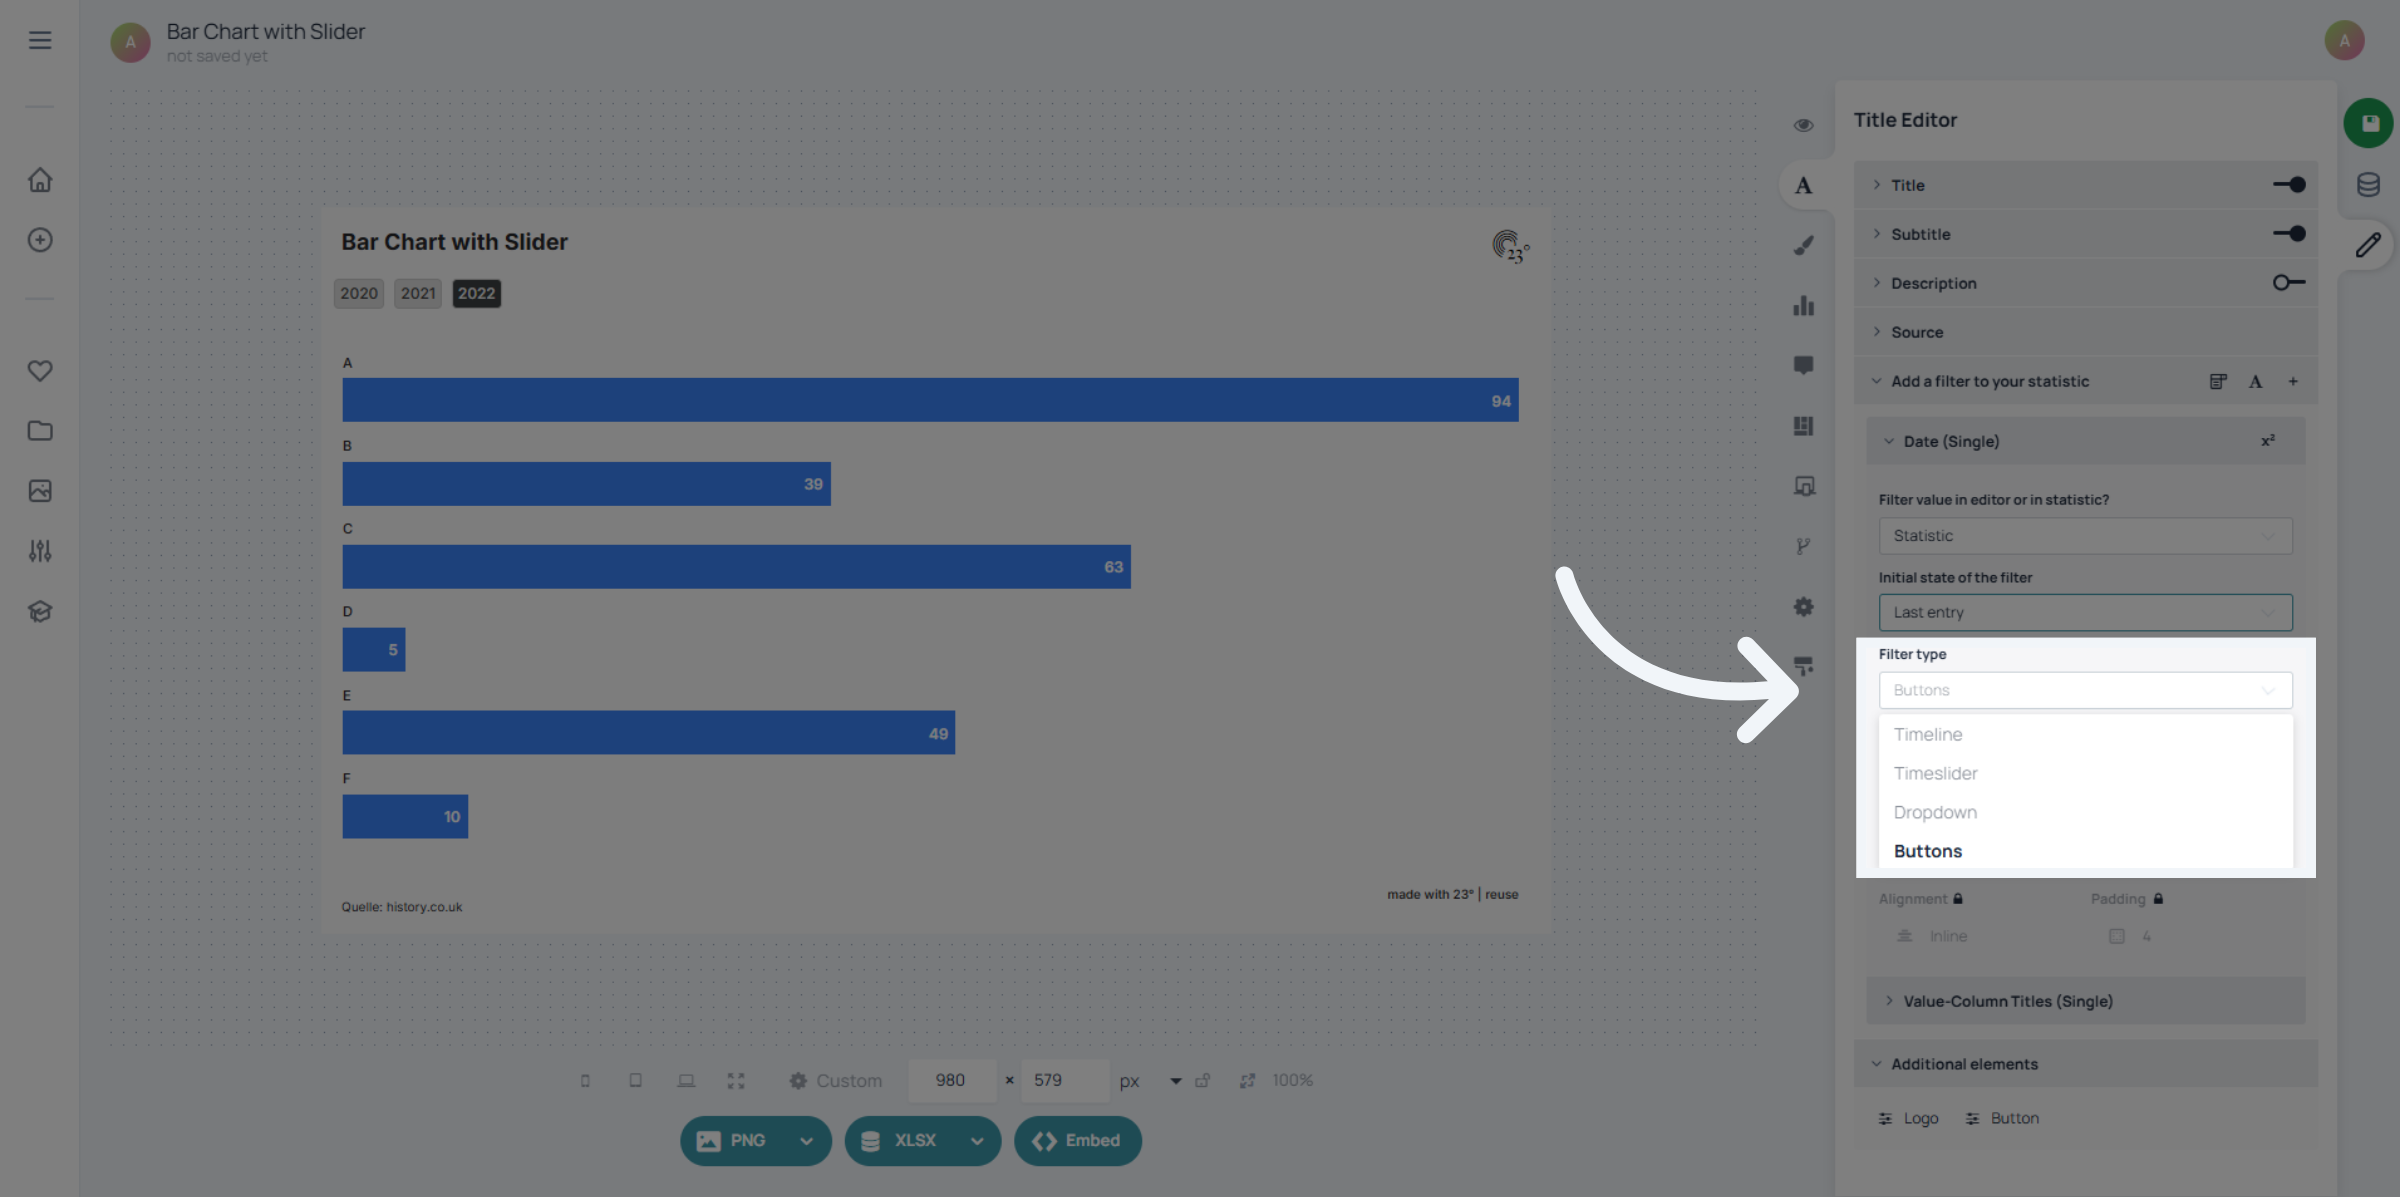
Here you can switch the filter type if you realise you need a different filter.
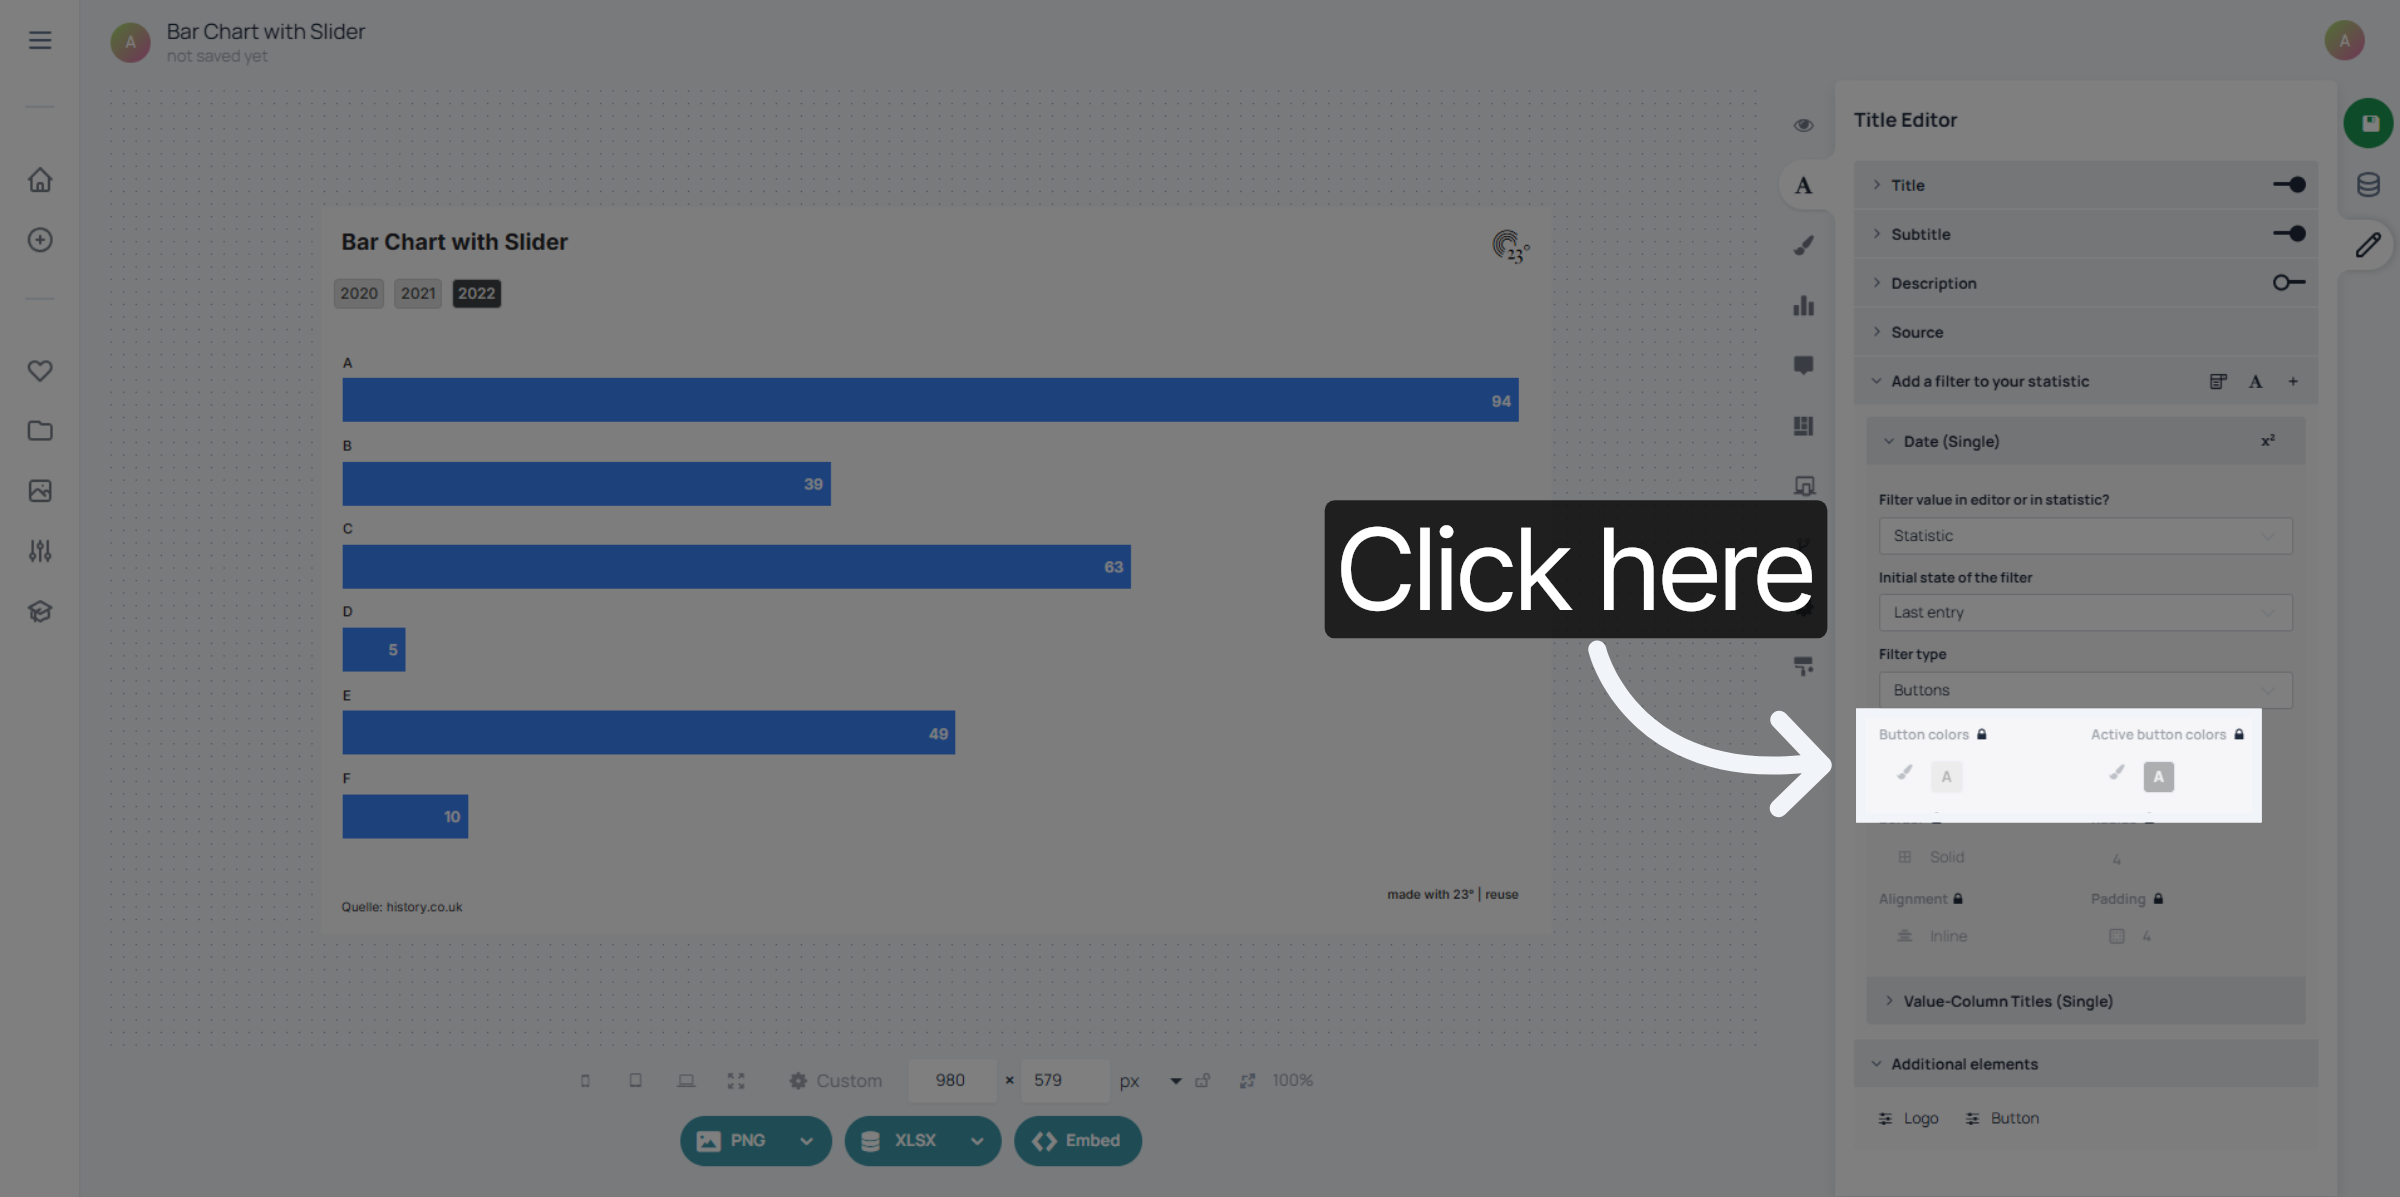
Here you can select the active and standard button text and background colours individually.
If you want more rounded buttons you can input a radius here.
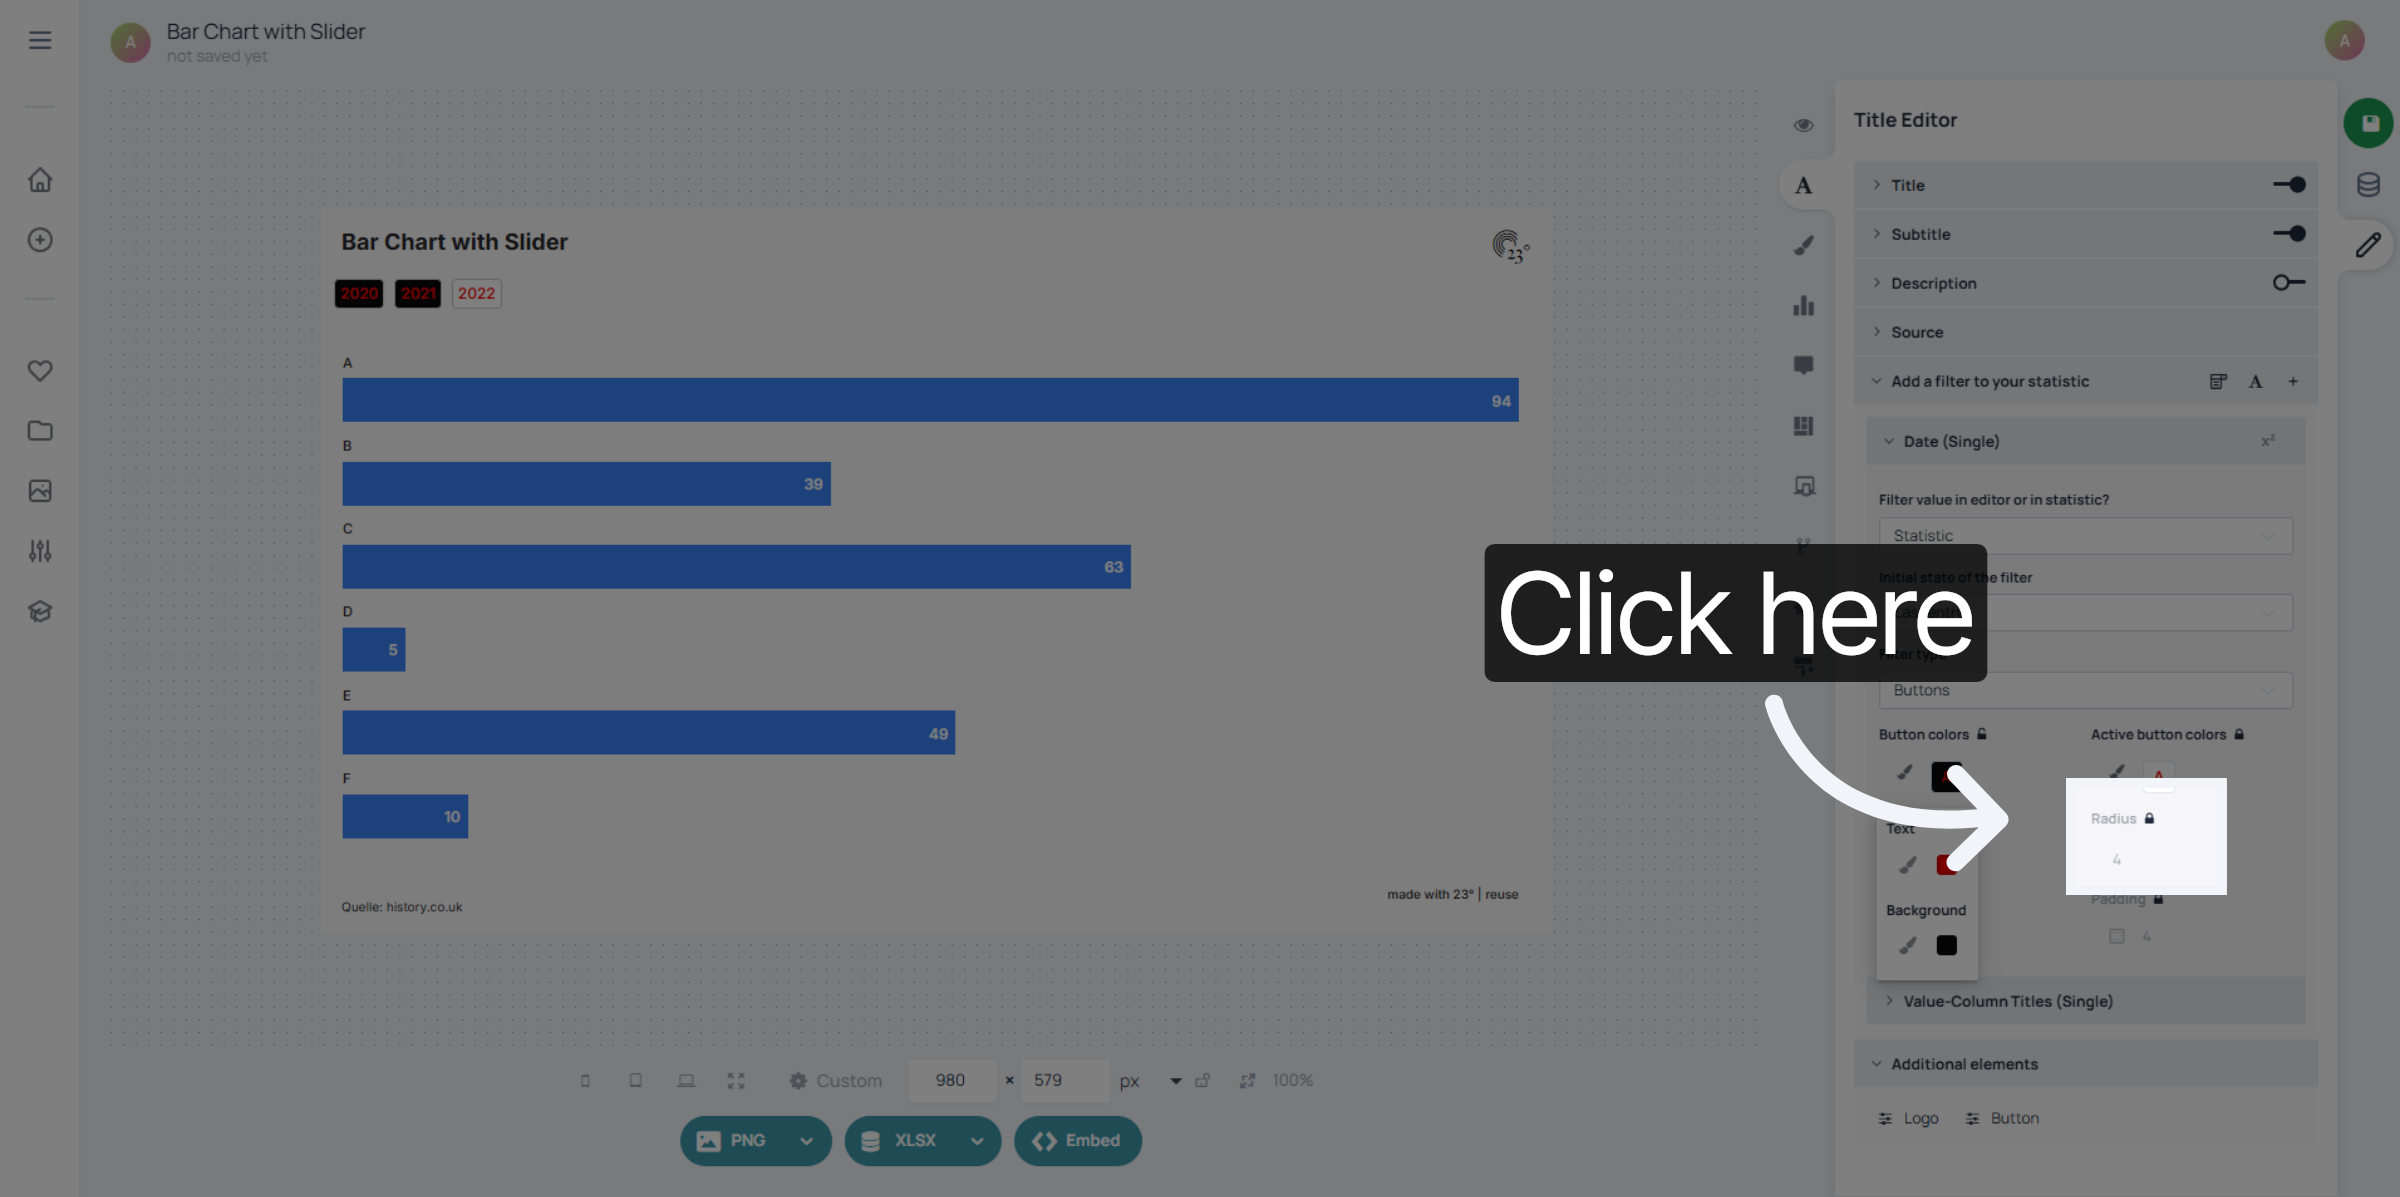
The Border width and colour can be edited here.
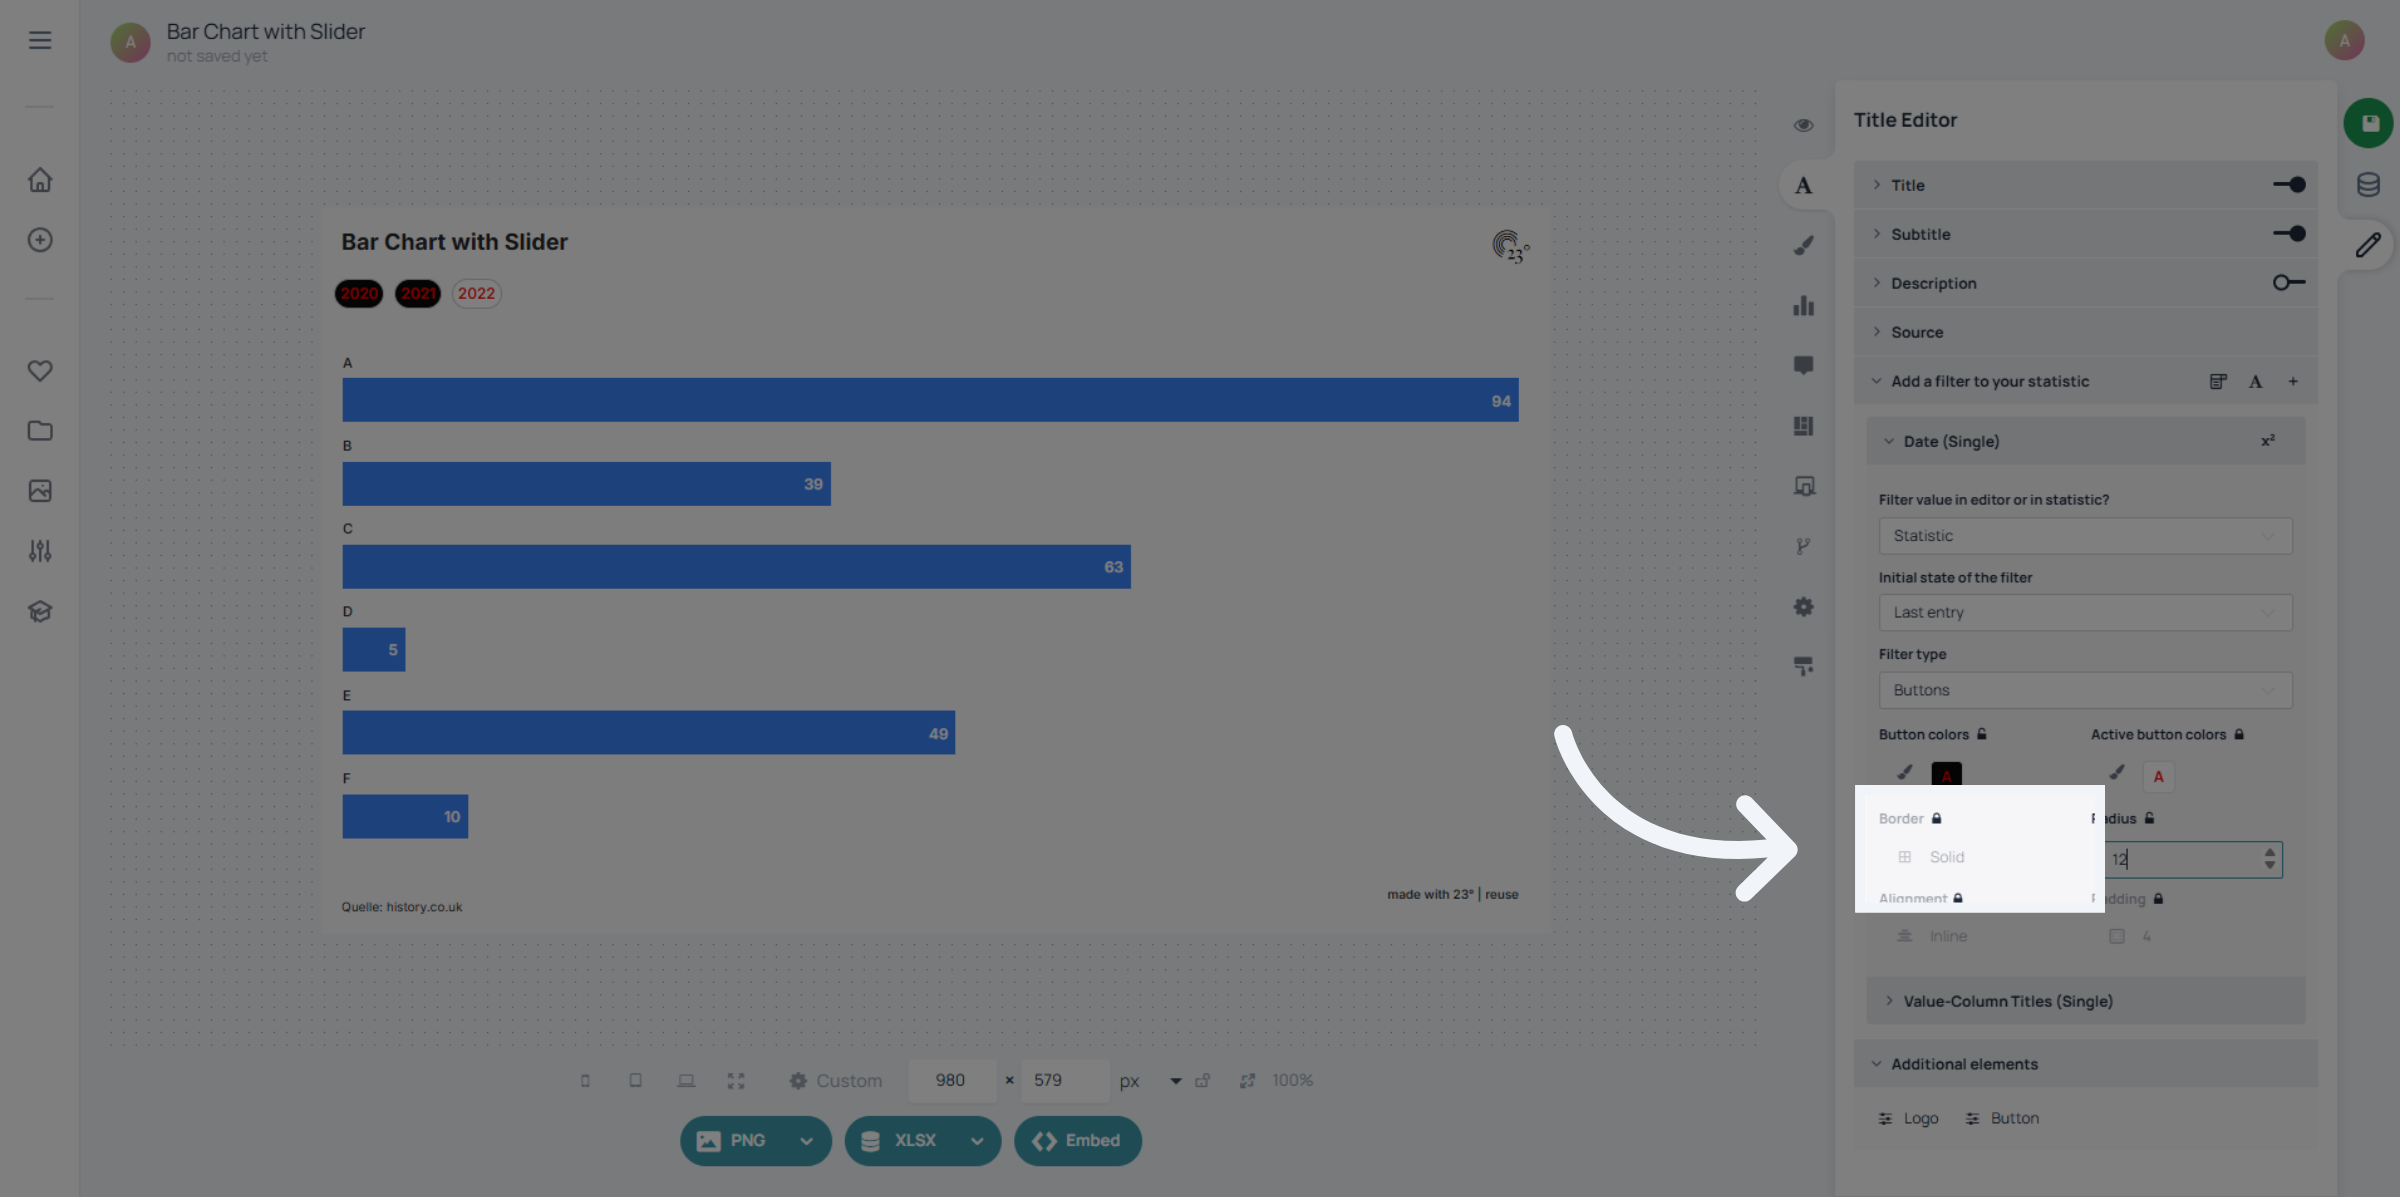
Here you have your button allignment options.
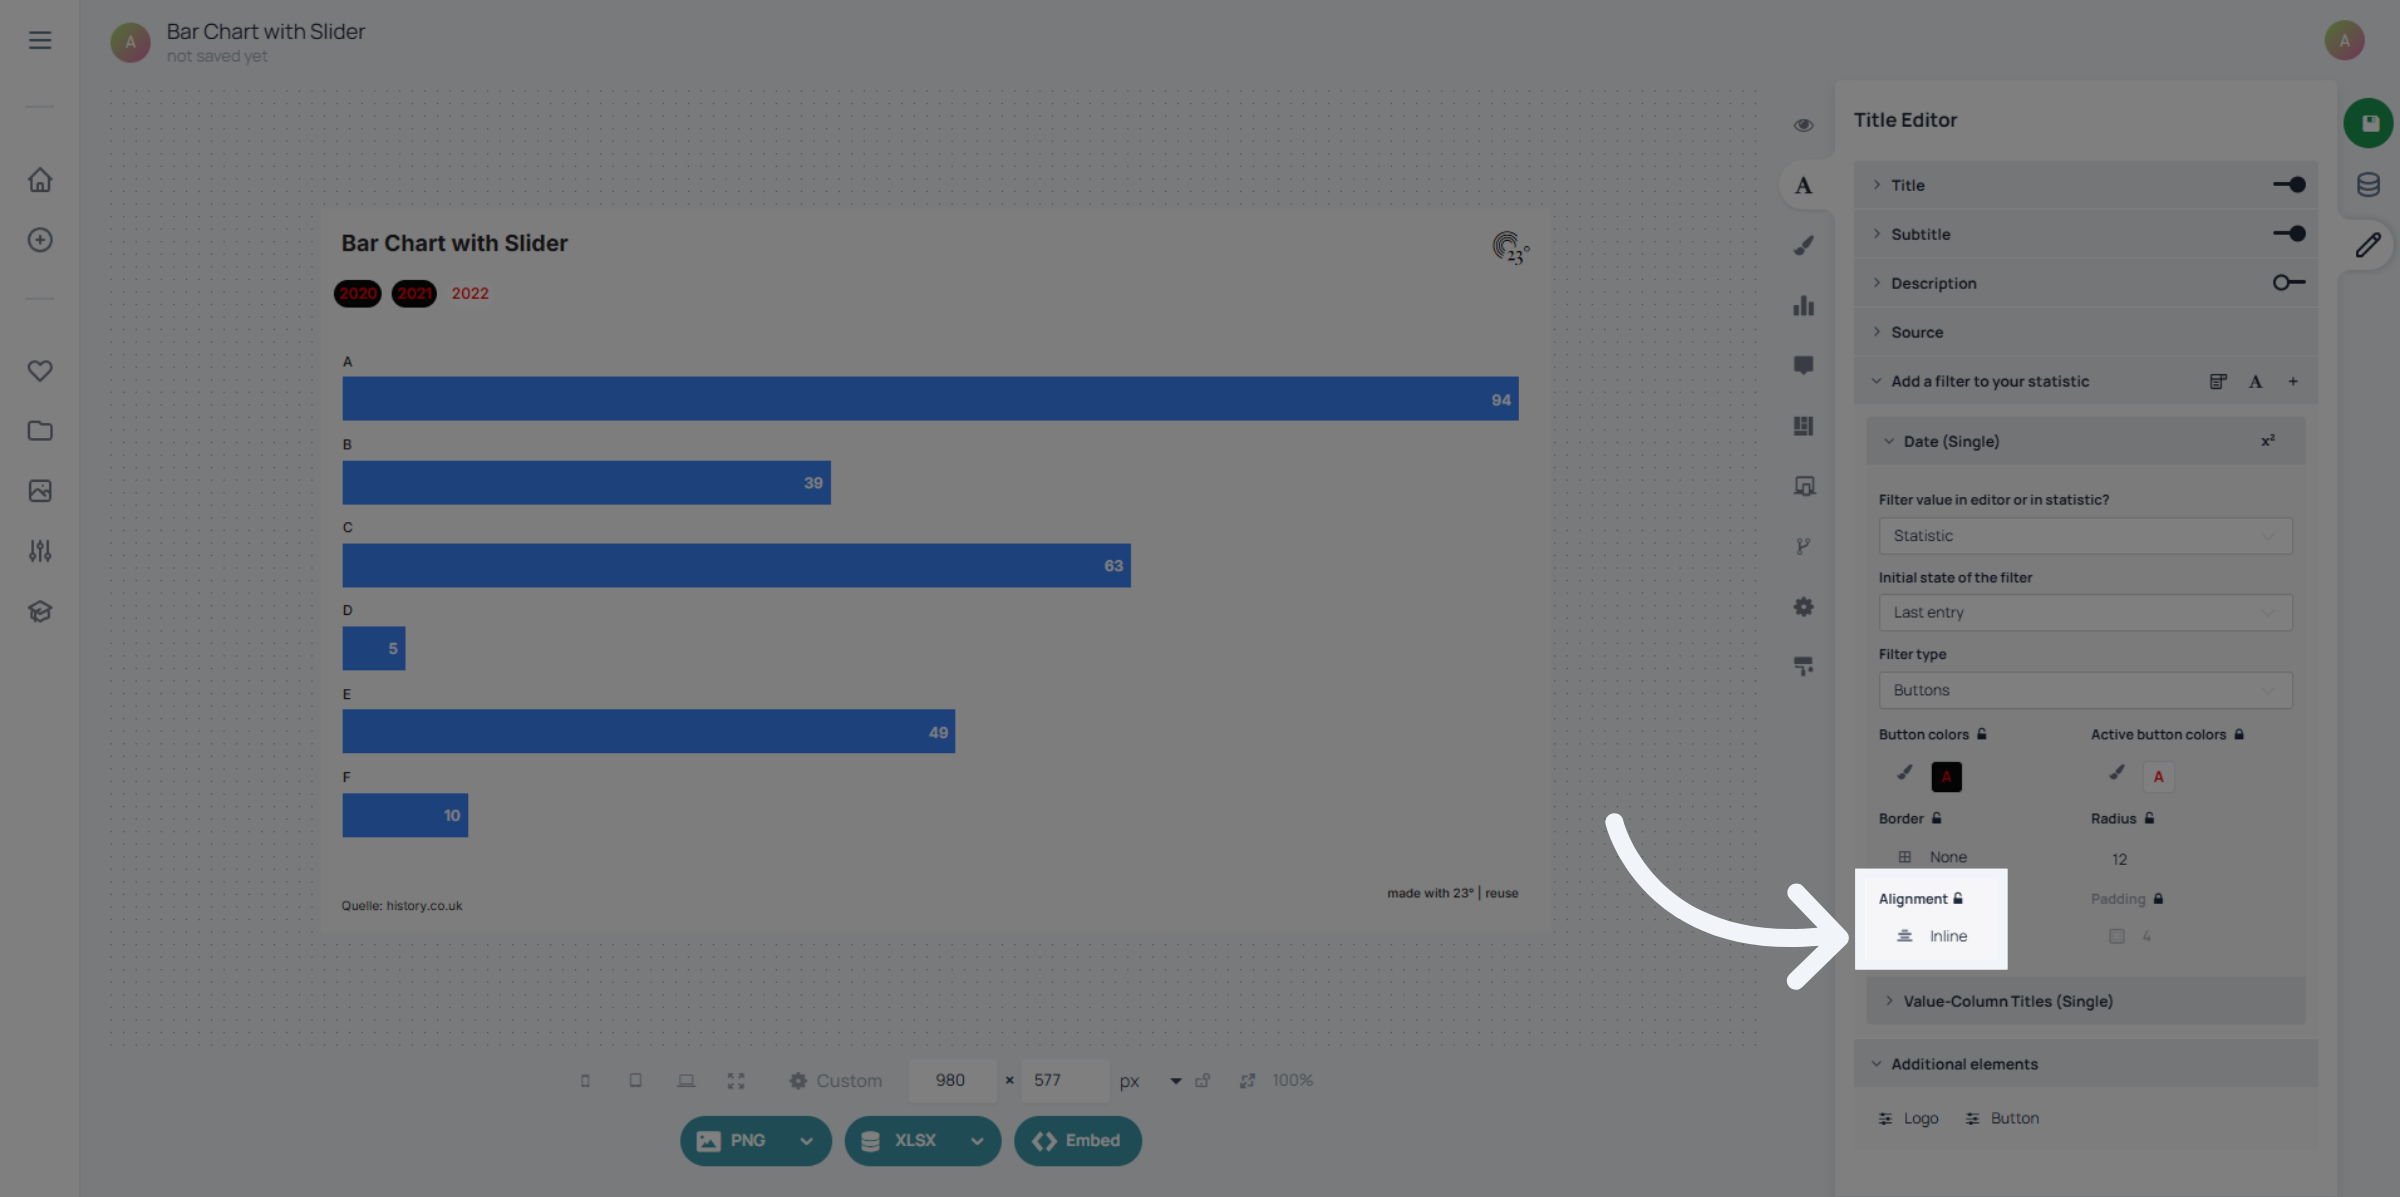
You can set your button containers to grow, select an allignment method and adjust the gap between the buttons.
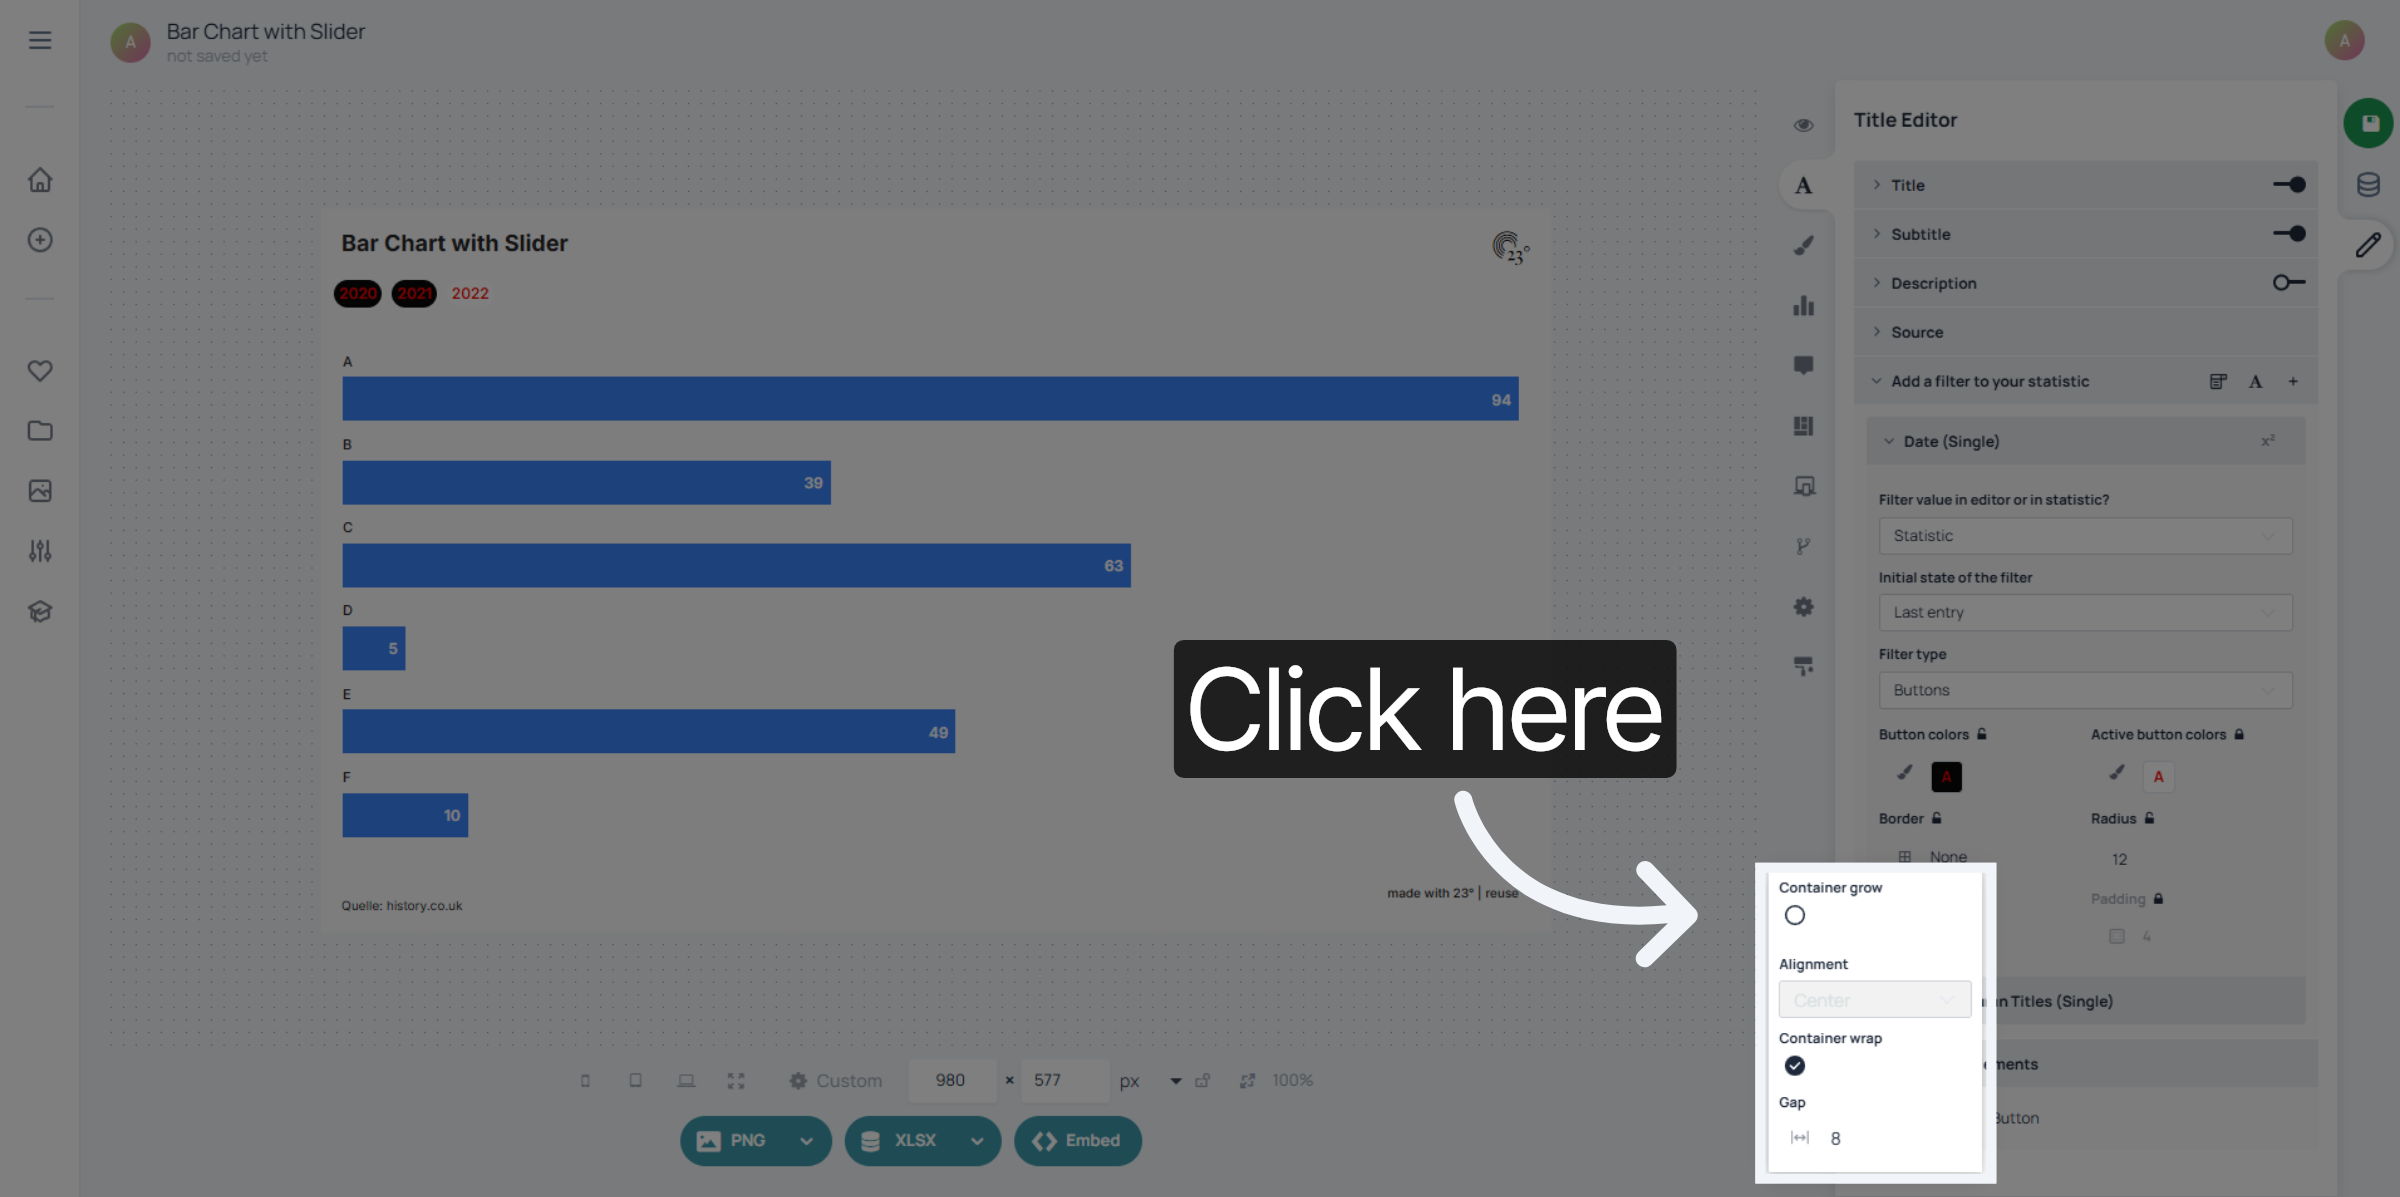
You have successfully configured button filters to customize your data visualization. Review your filter settings to ensure they meet your requirements and explore additional customization options as needed.