How to customize display settings of Extrude Maps
This tutorial shows how to customize the display settings of an extrude map in 23degrees.
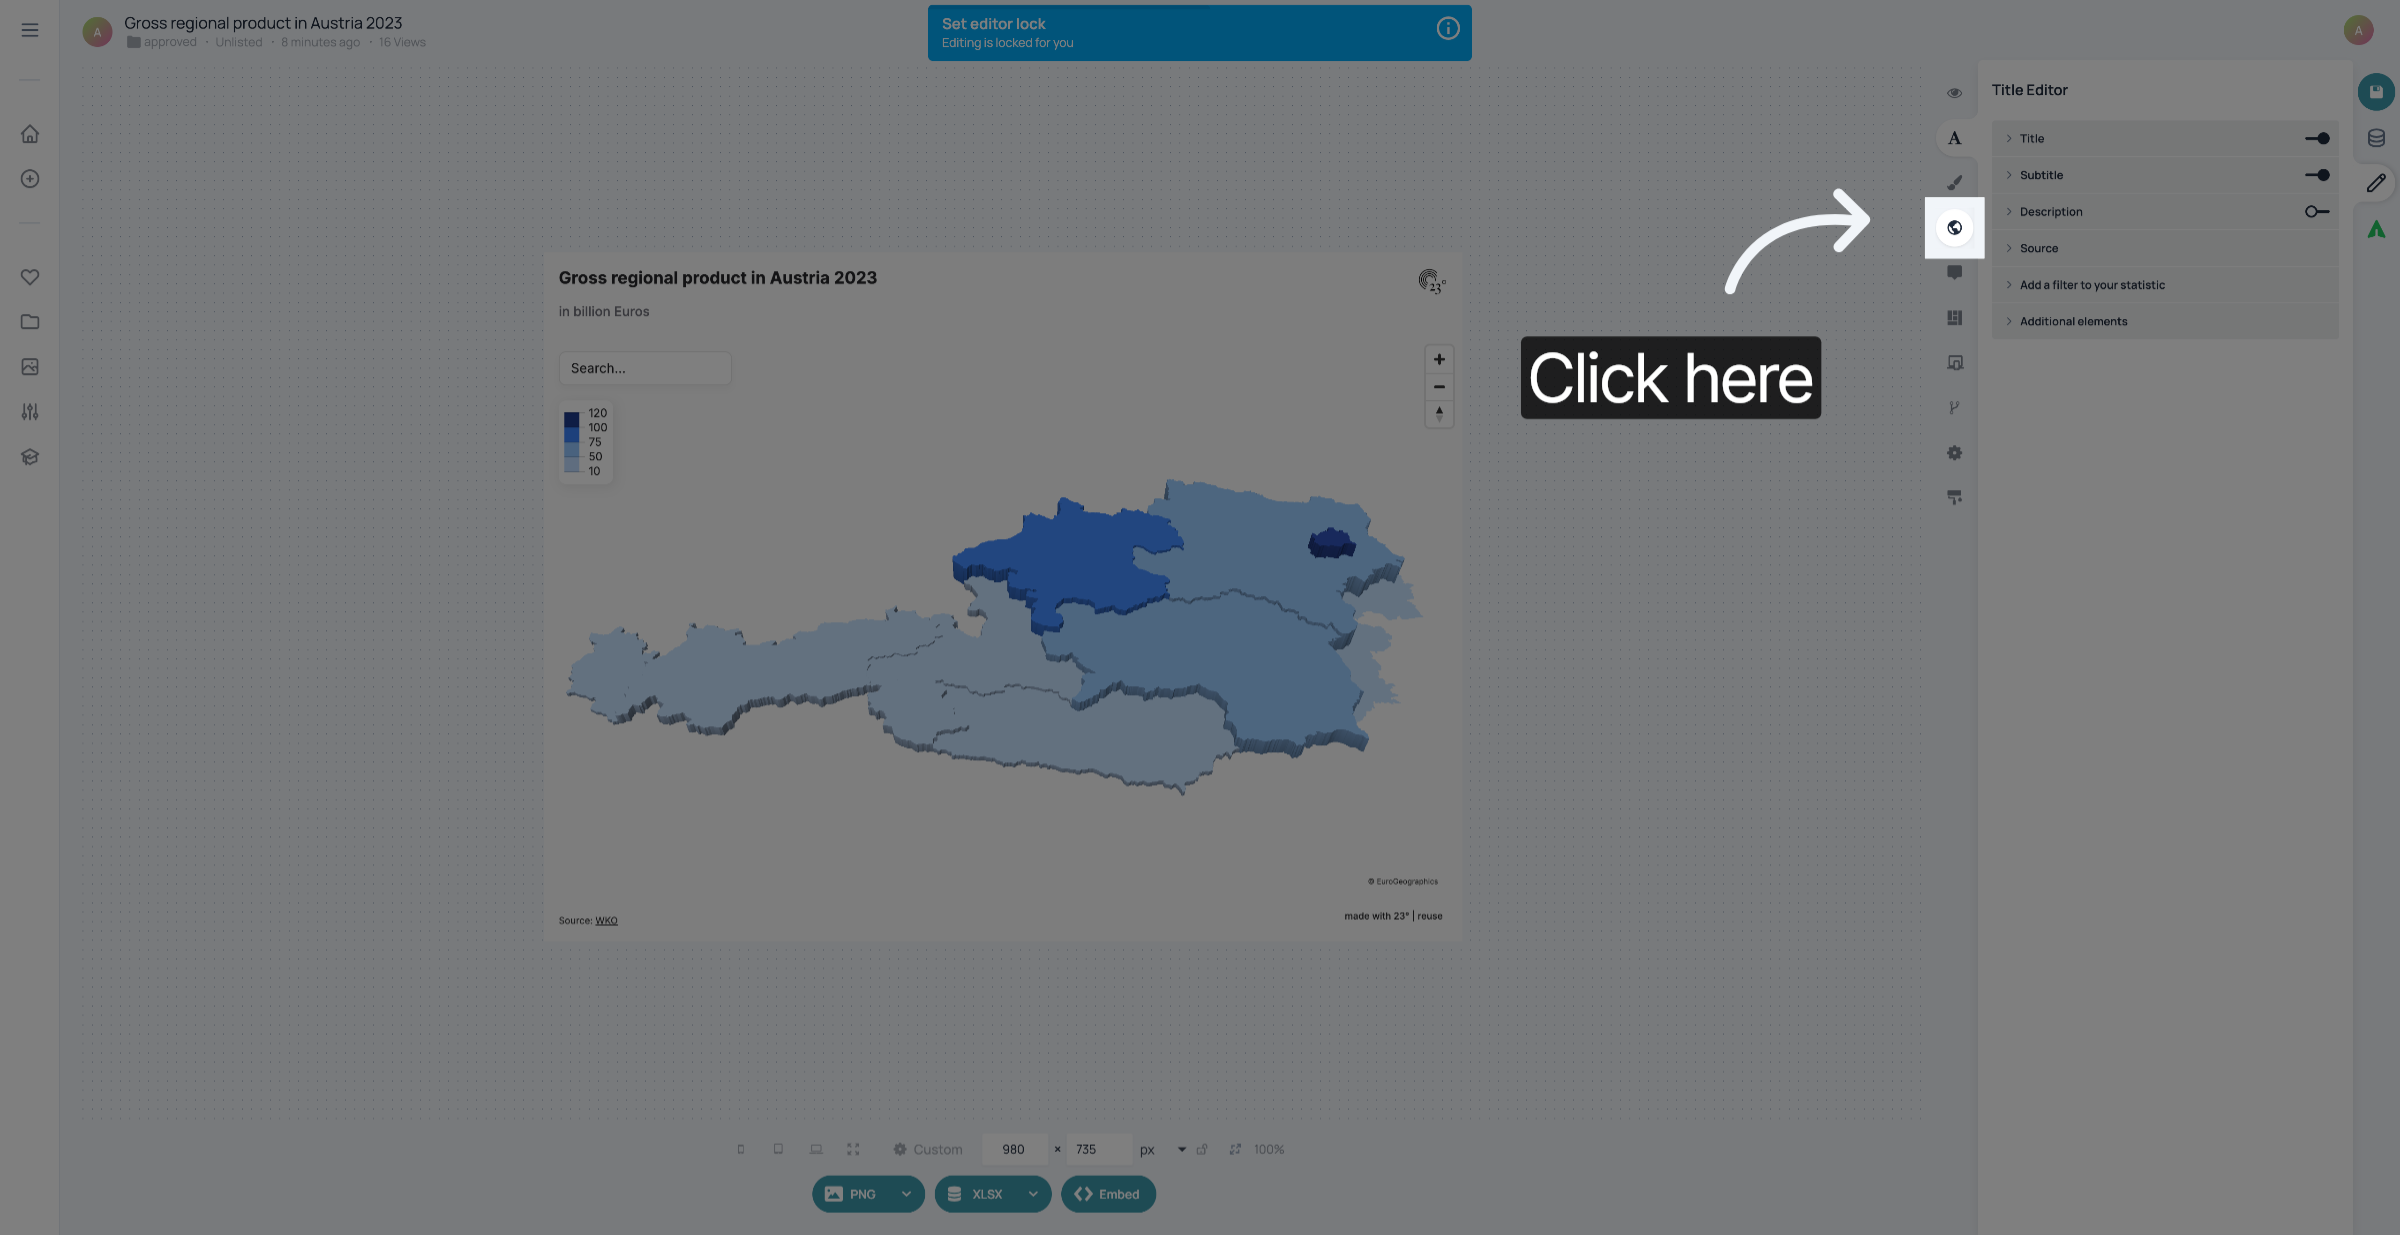
1. Access Extrude Map Options
Click the extrude map options to view available customization features.
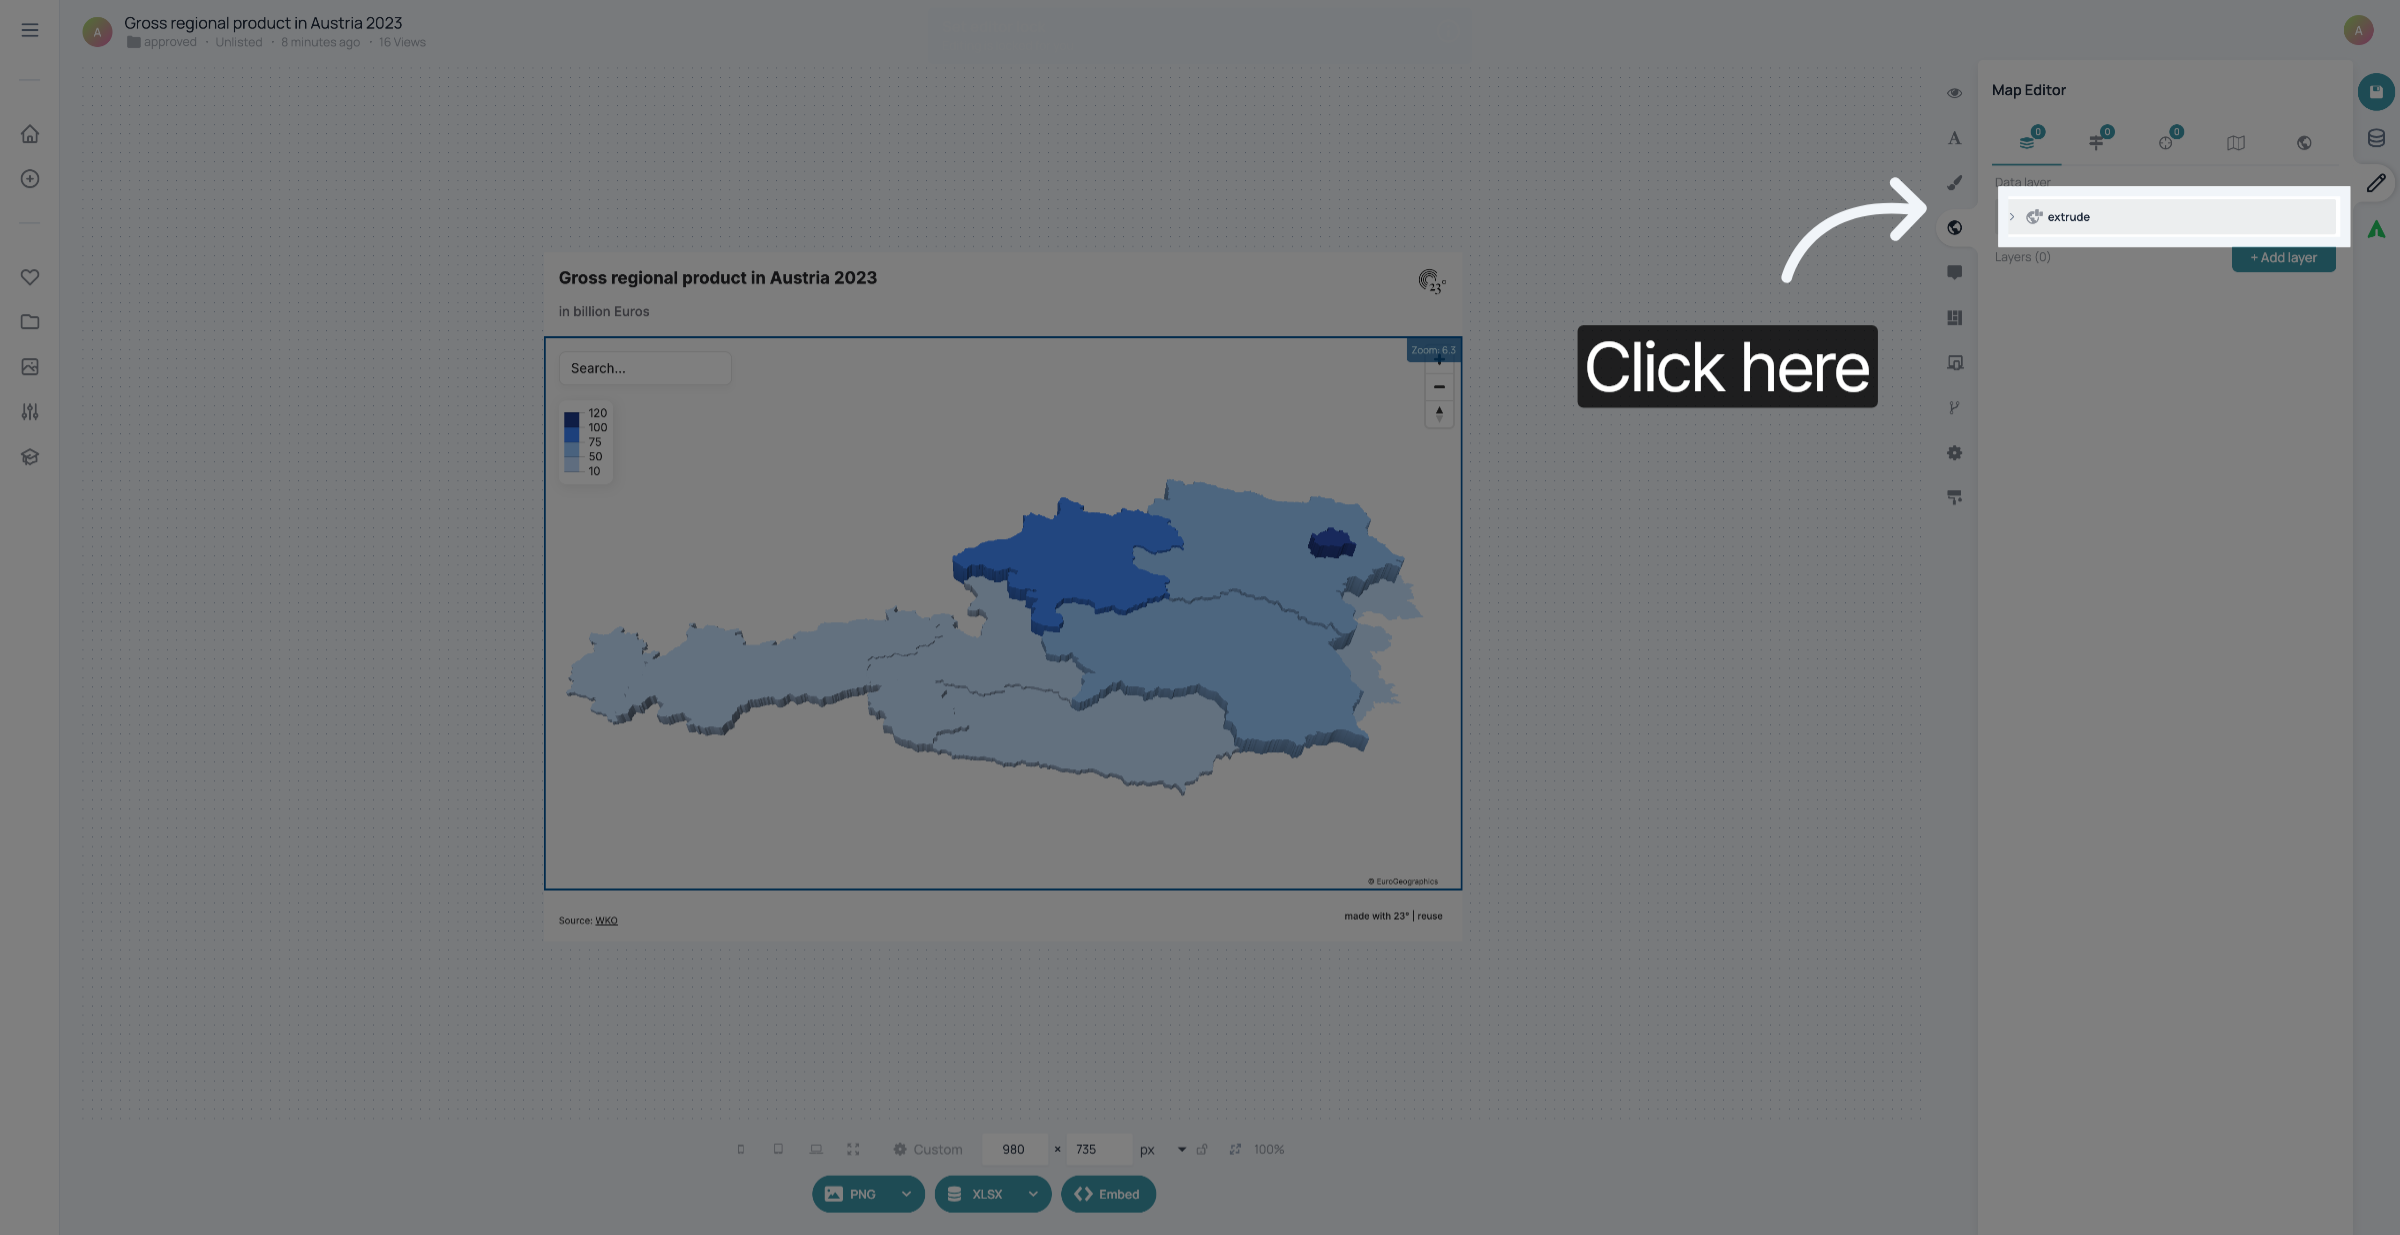
2. Select Display Parameters
Click the display parameters section to adjust map visualization settings.
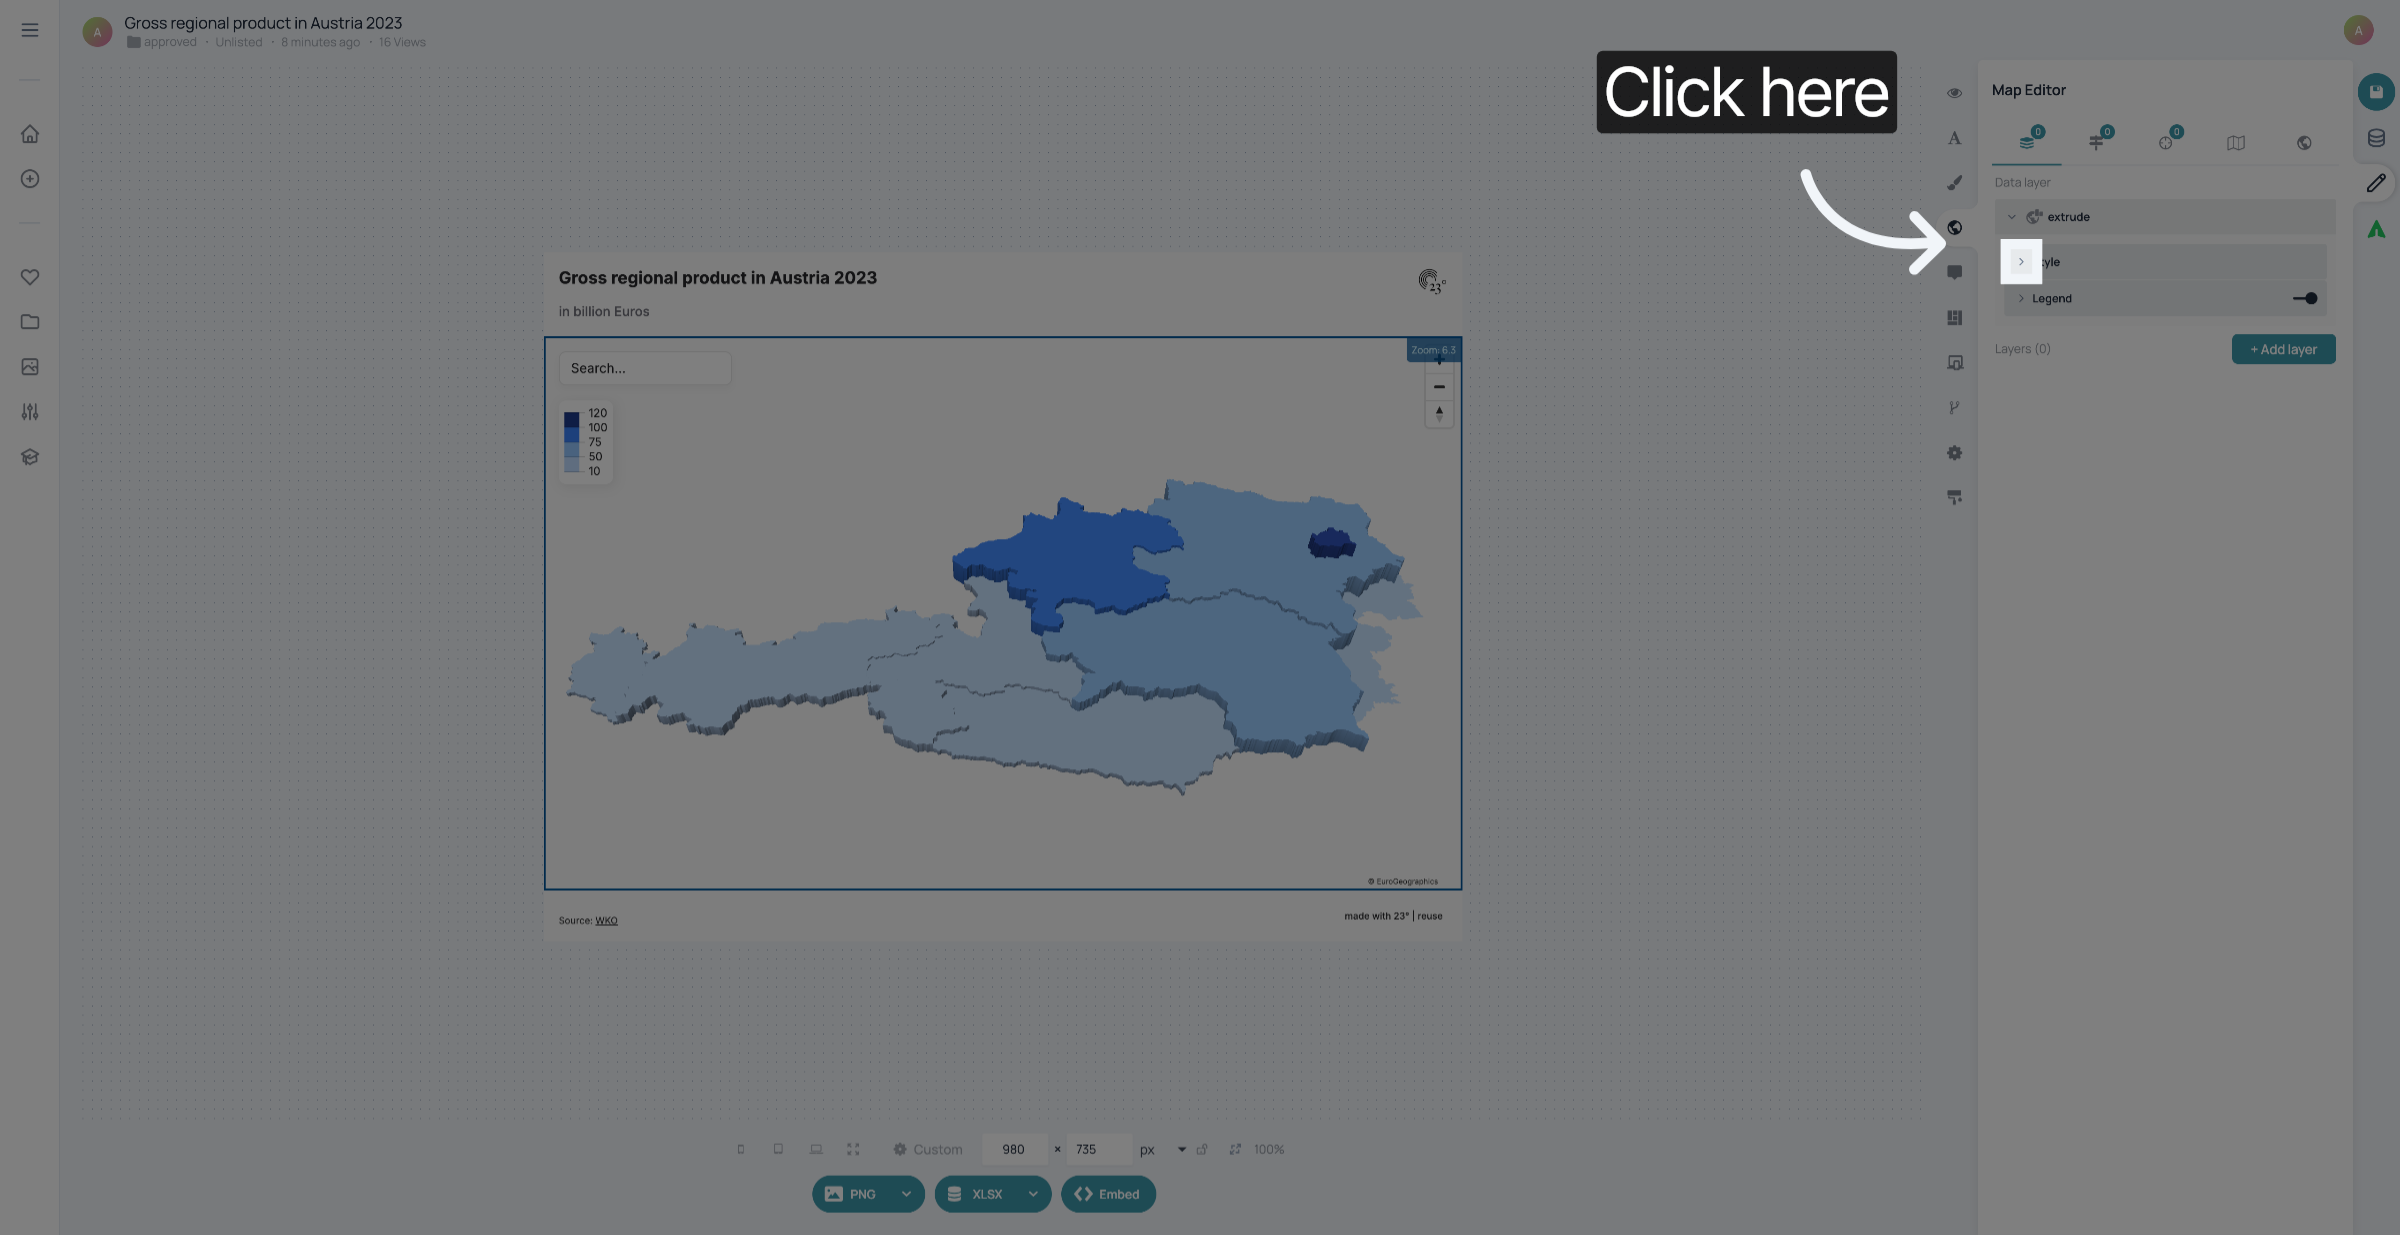
3. Open Value Range Settings
Click the value range settings to specify the data range for the extrude map.
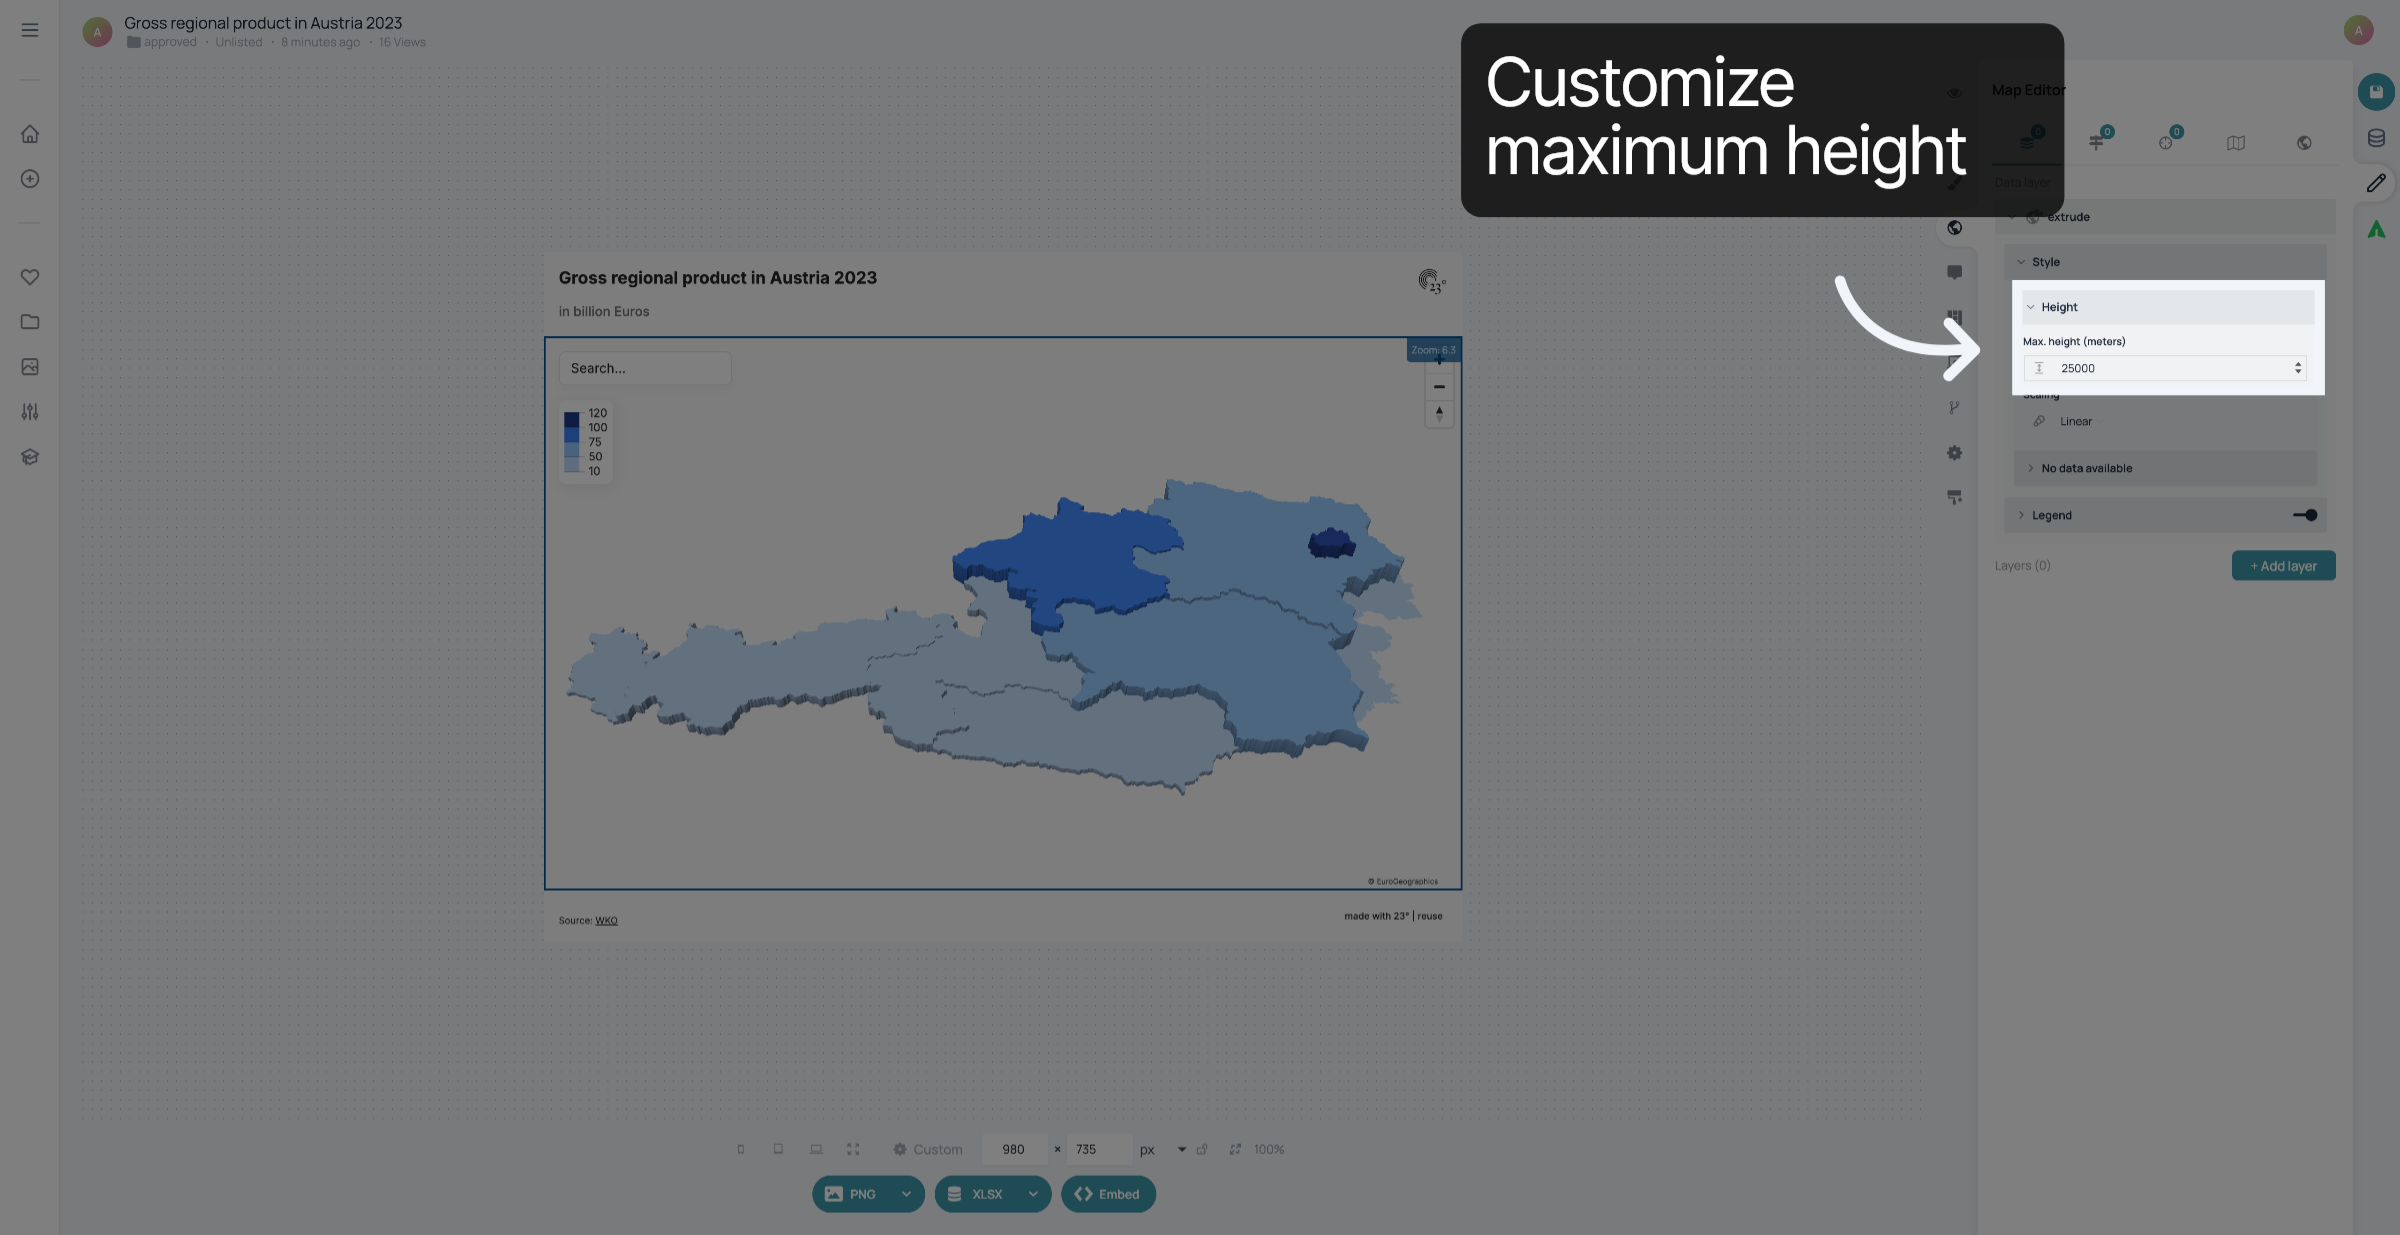
4. Select Maximum Value
Select the maximum value to define the highest data point shown on the map.
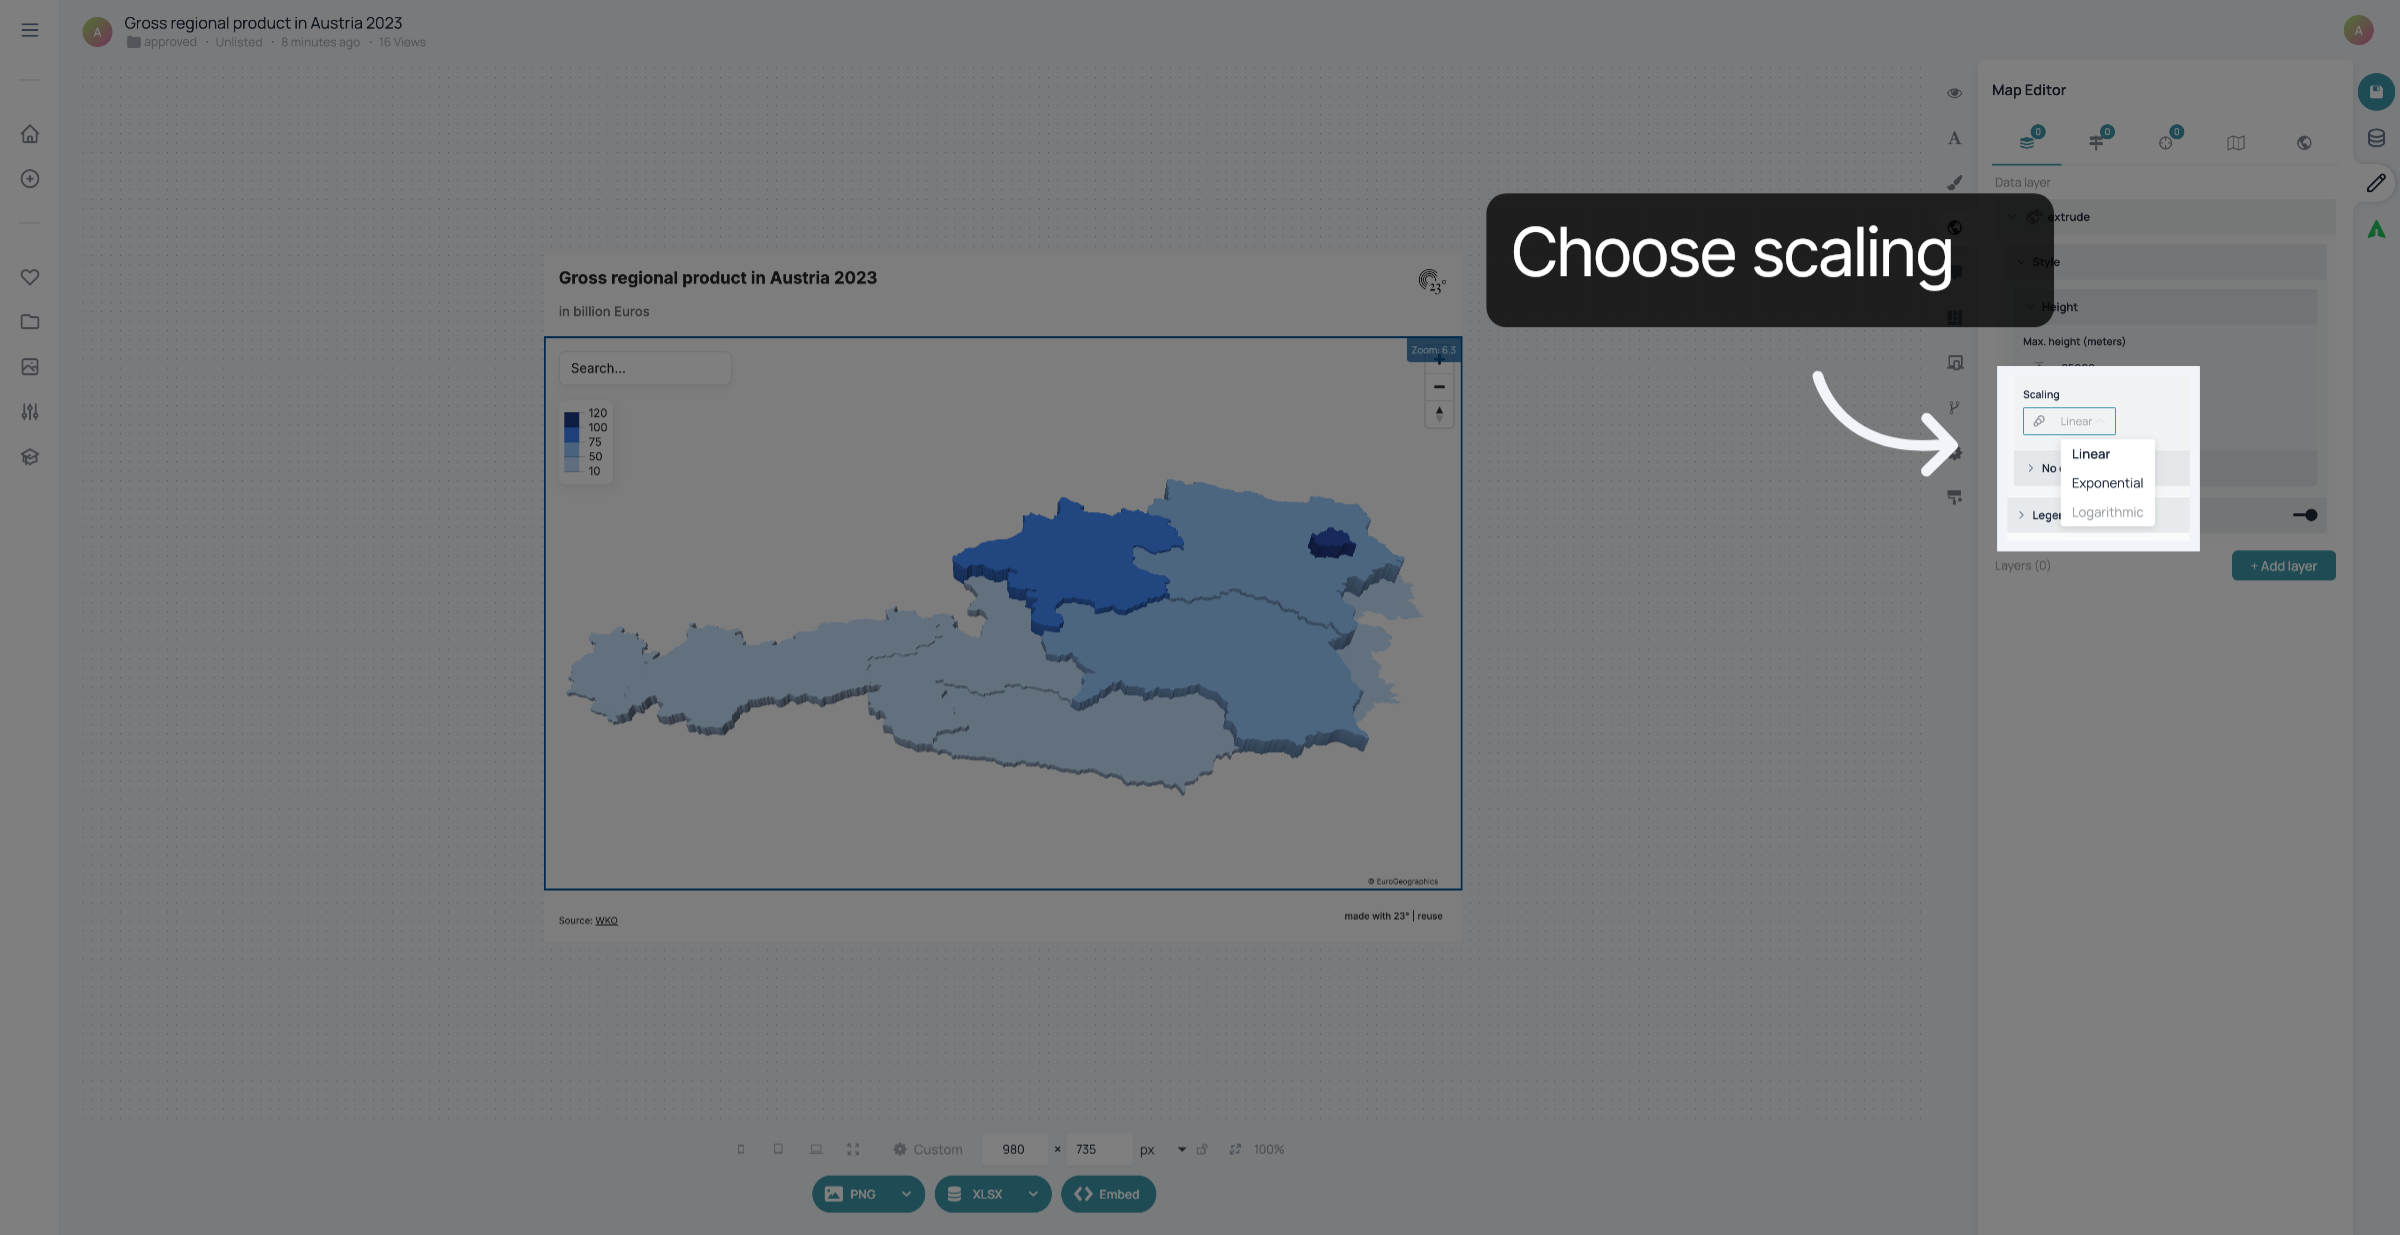
5. Select Exponential Scale
Select the exponential scale to apply a non-linear data representation.
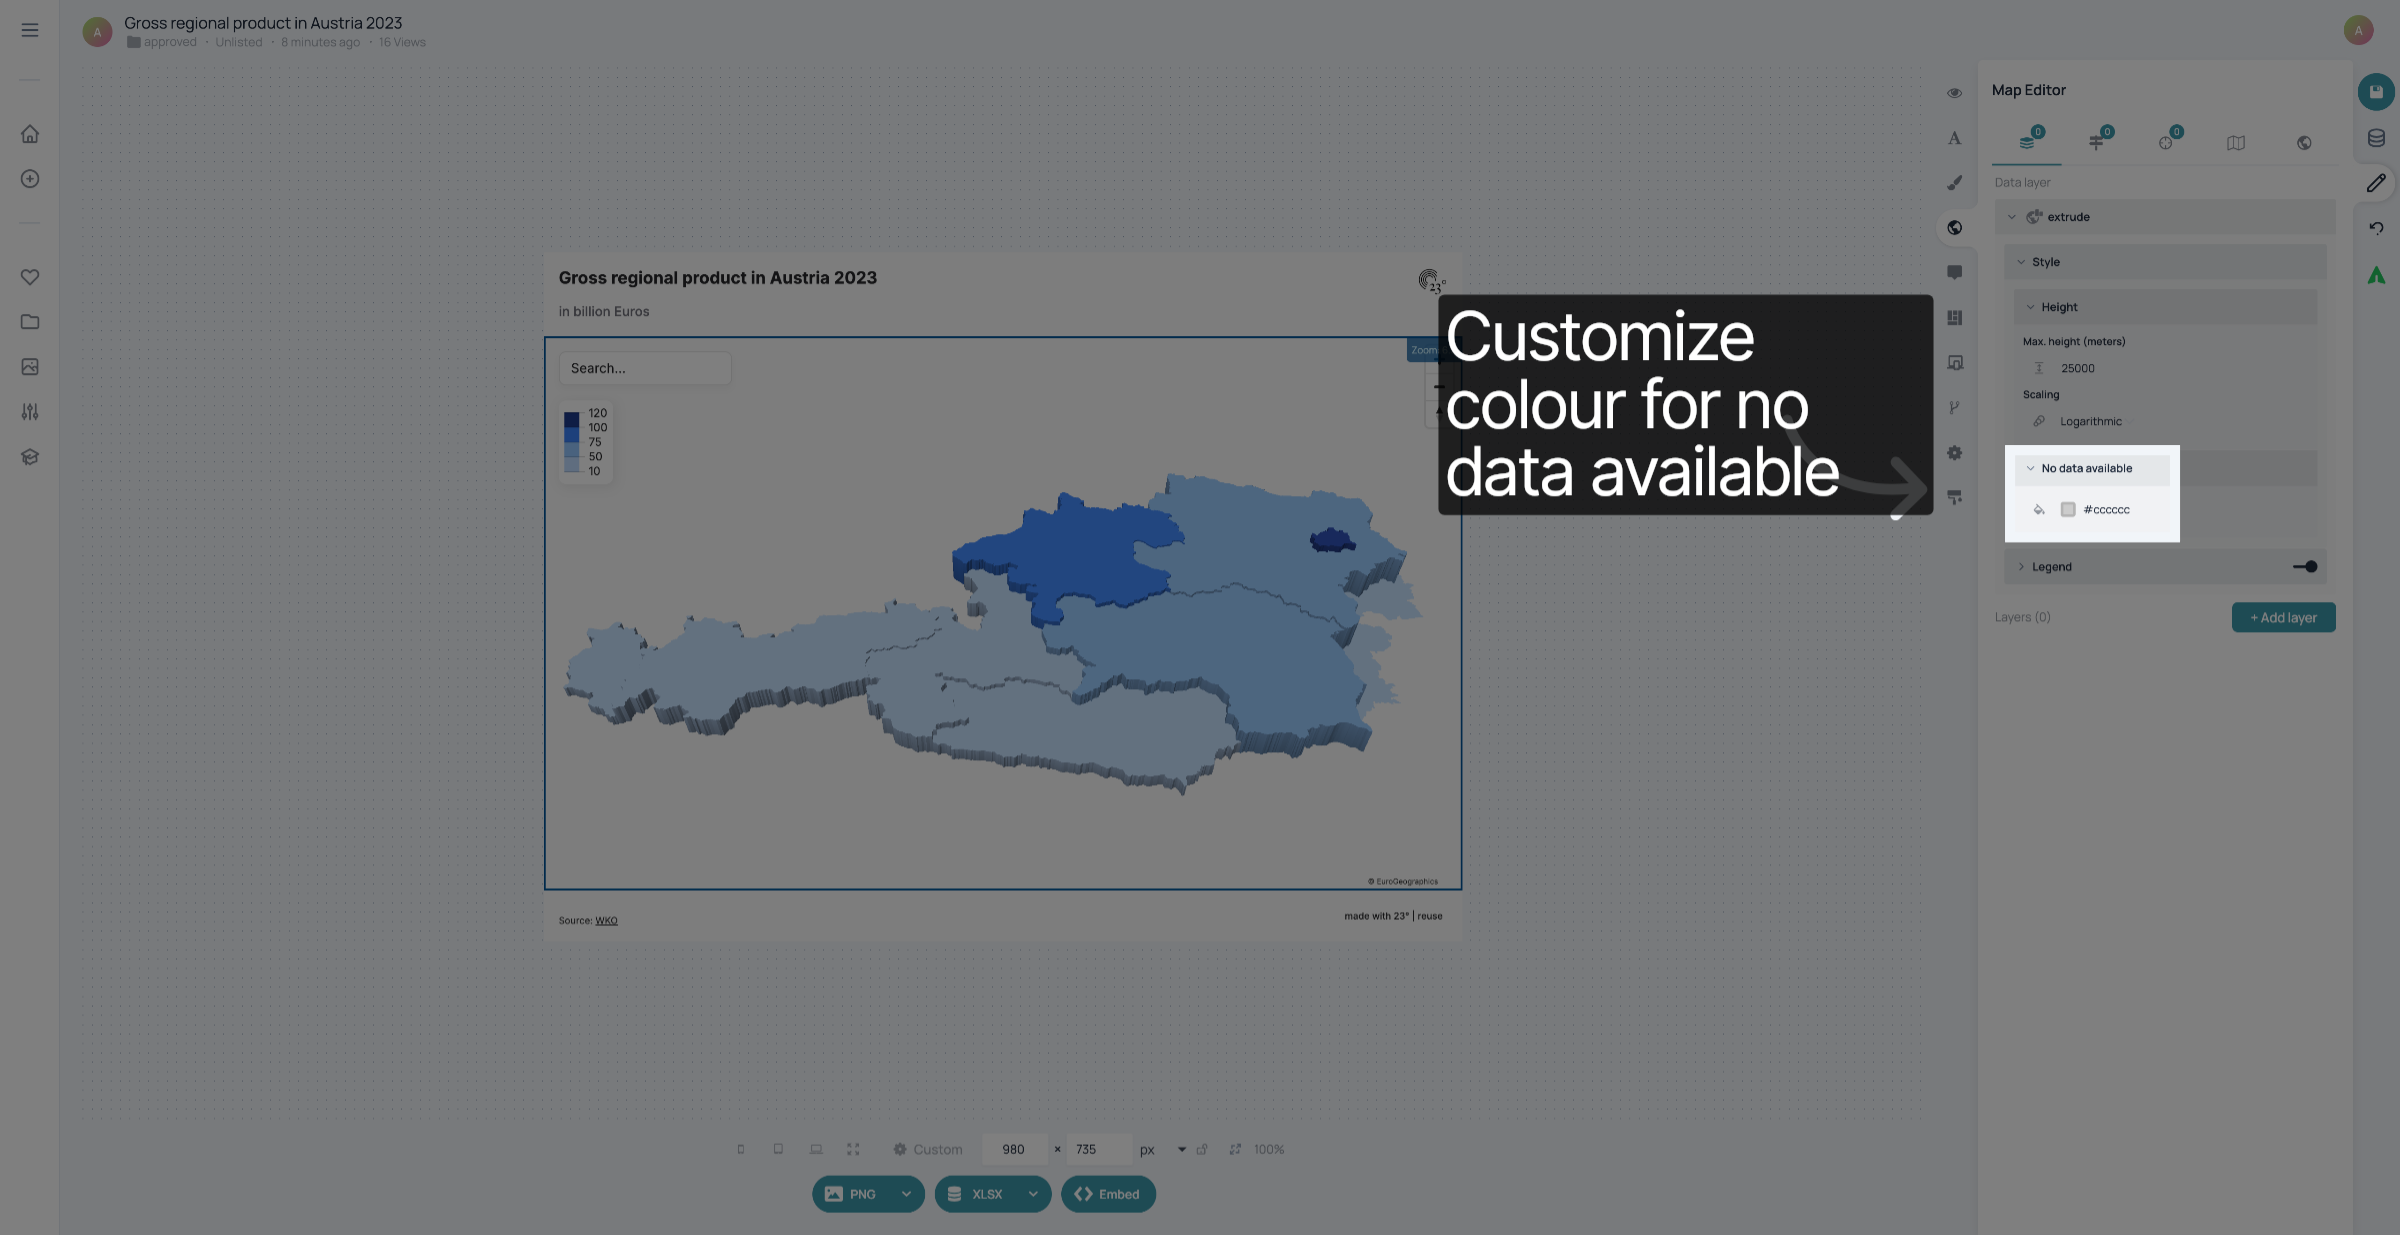
6. Access Legend Settings
Click the legend settings to customize the map's legend display.
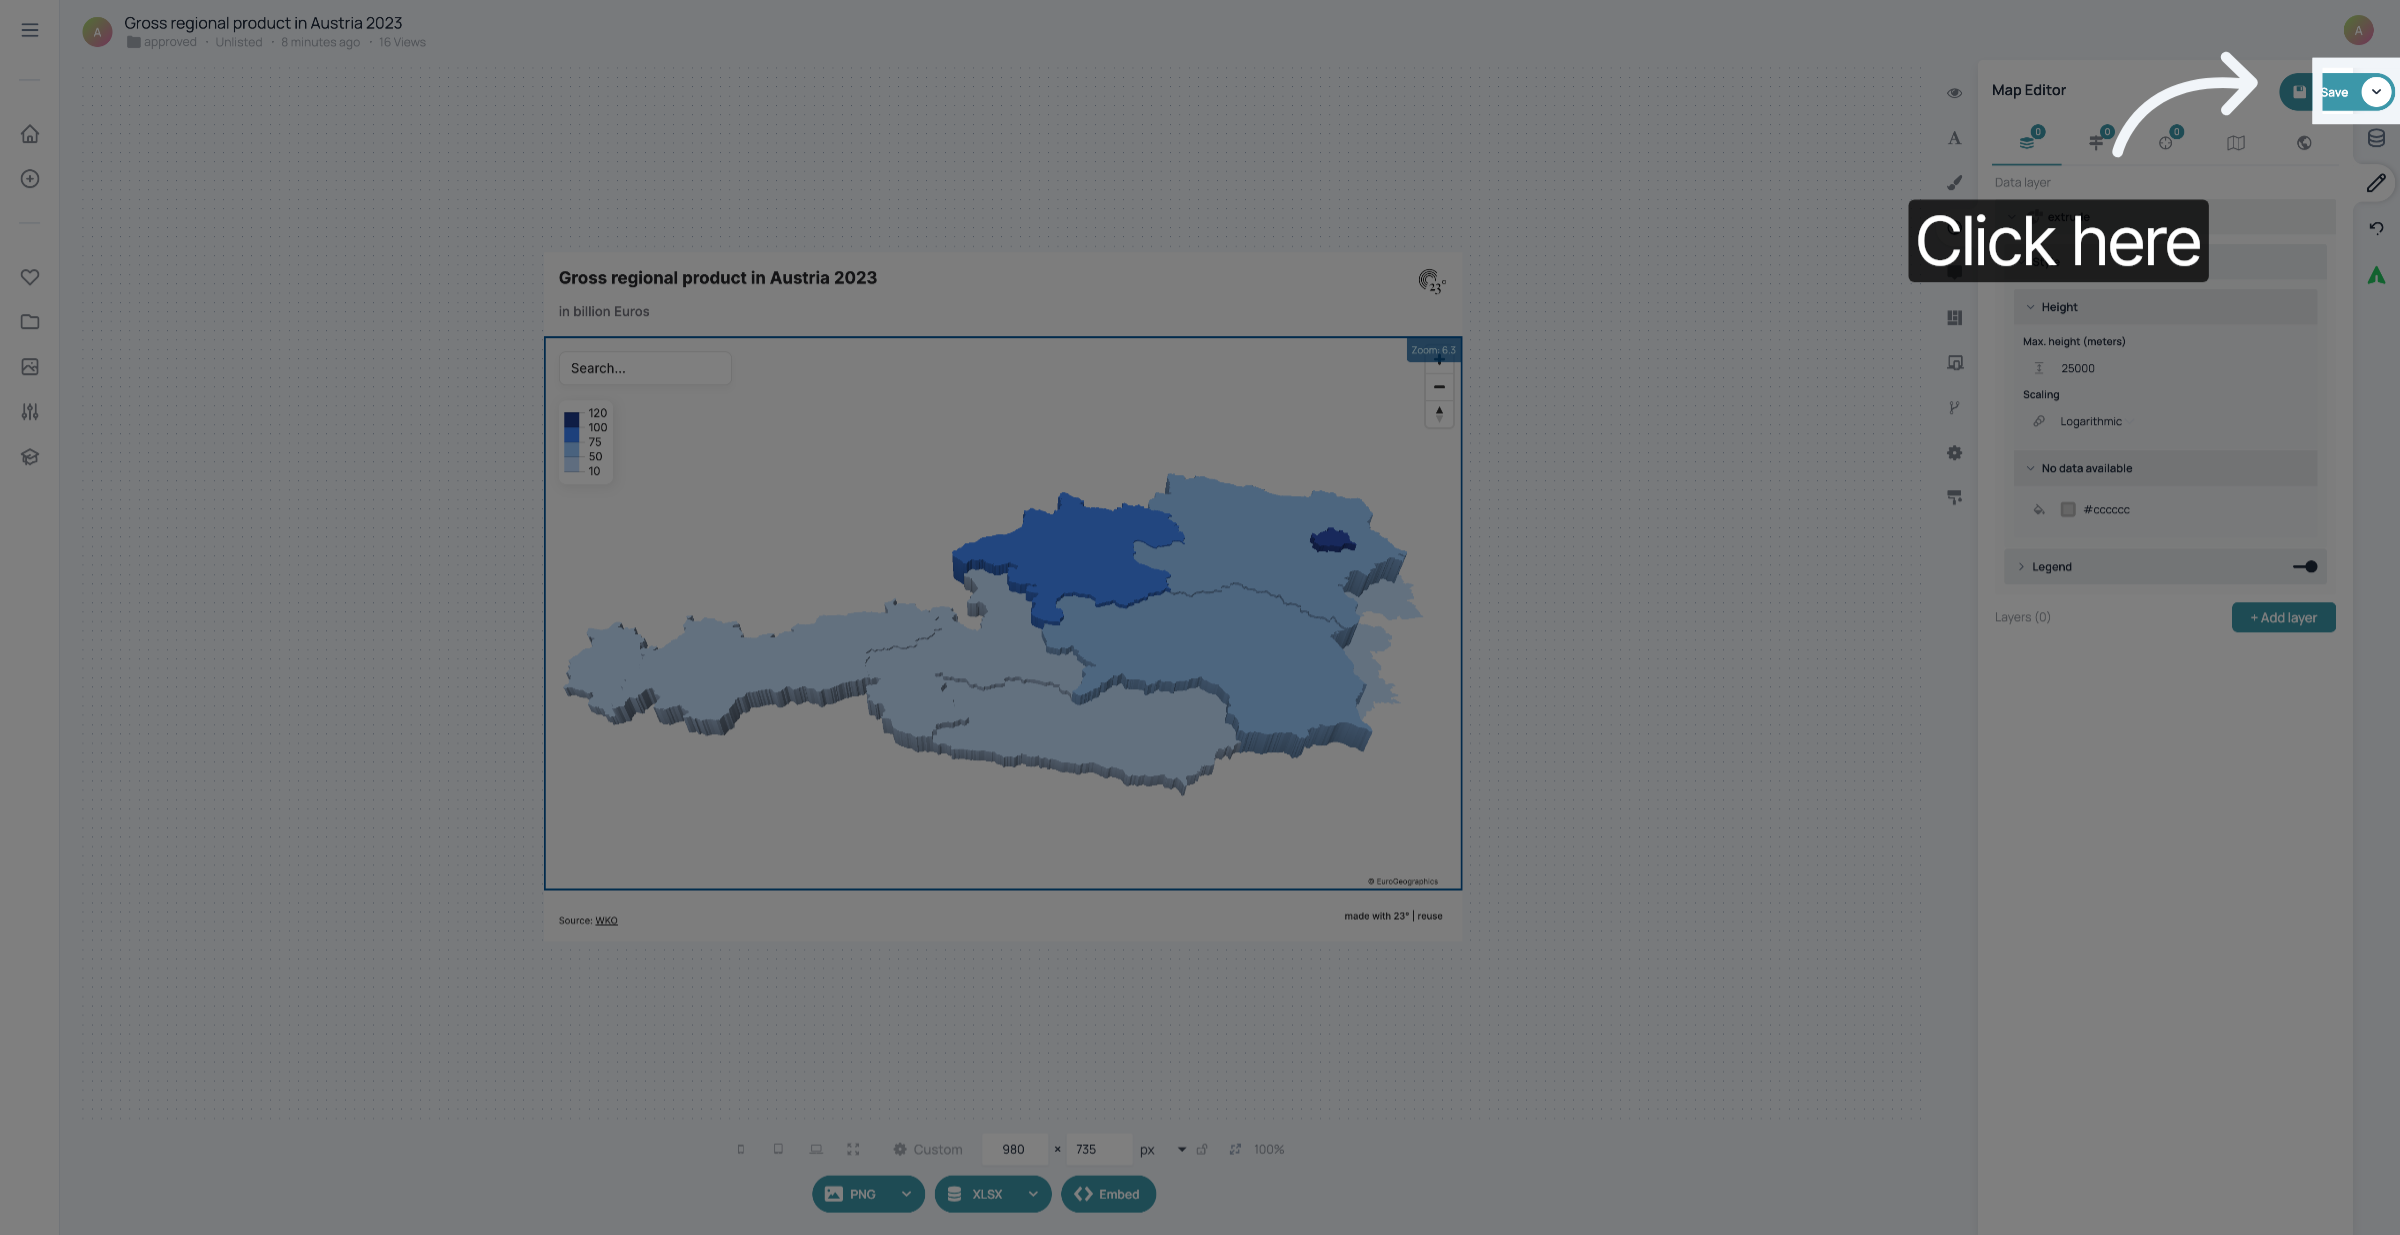
7. Save changes
Don't forget to save your changes
You have successfully customized the extrude map display settings.