Turn your dot plot or range plot into an arrow plot
This tutorial will explain how to turn your dot plotor range plot into an arrow plot.
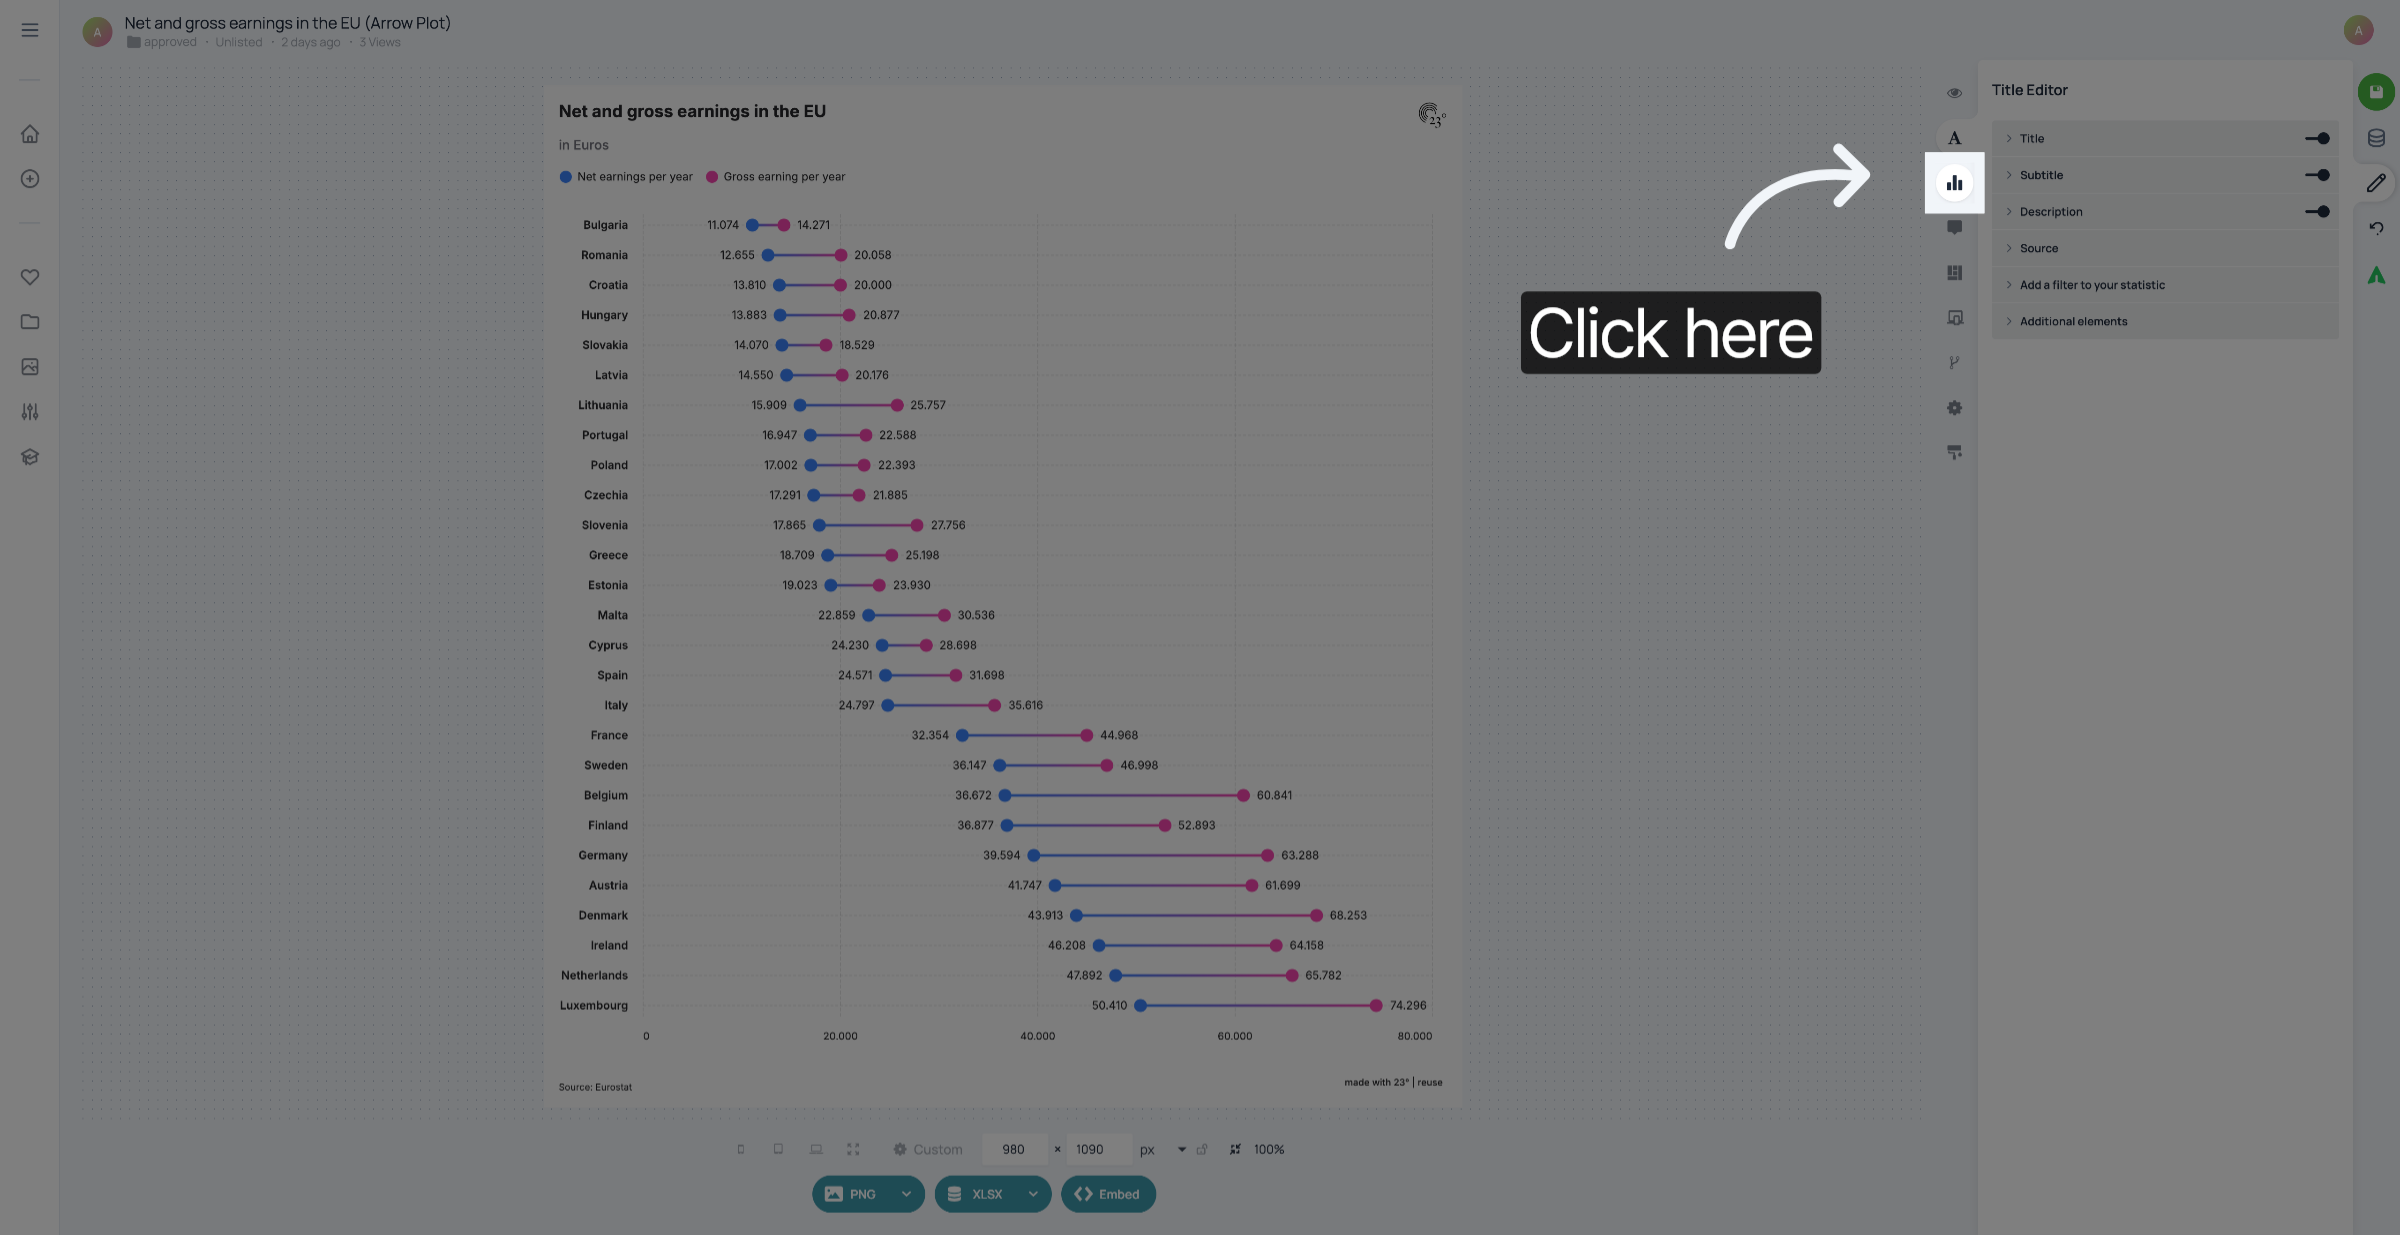
1. Go to Chart Editor
Go to the Chart Editor.
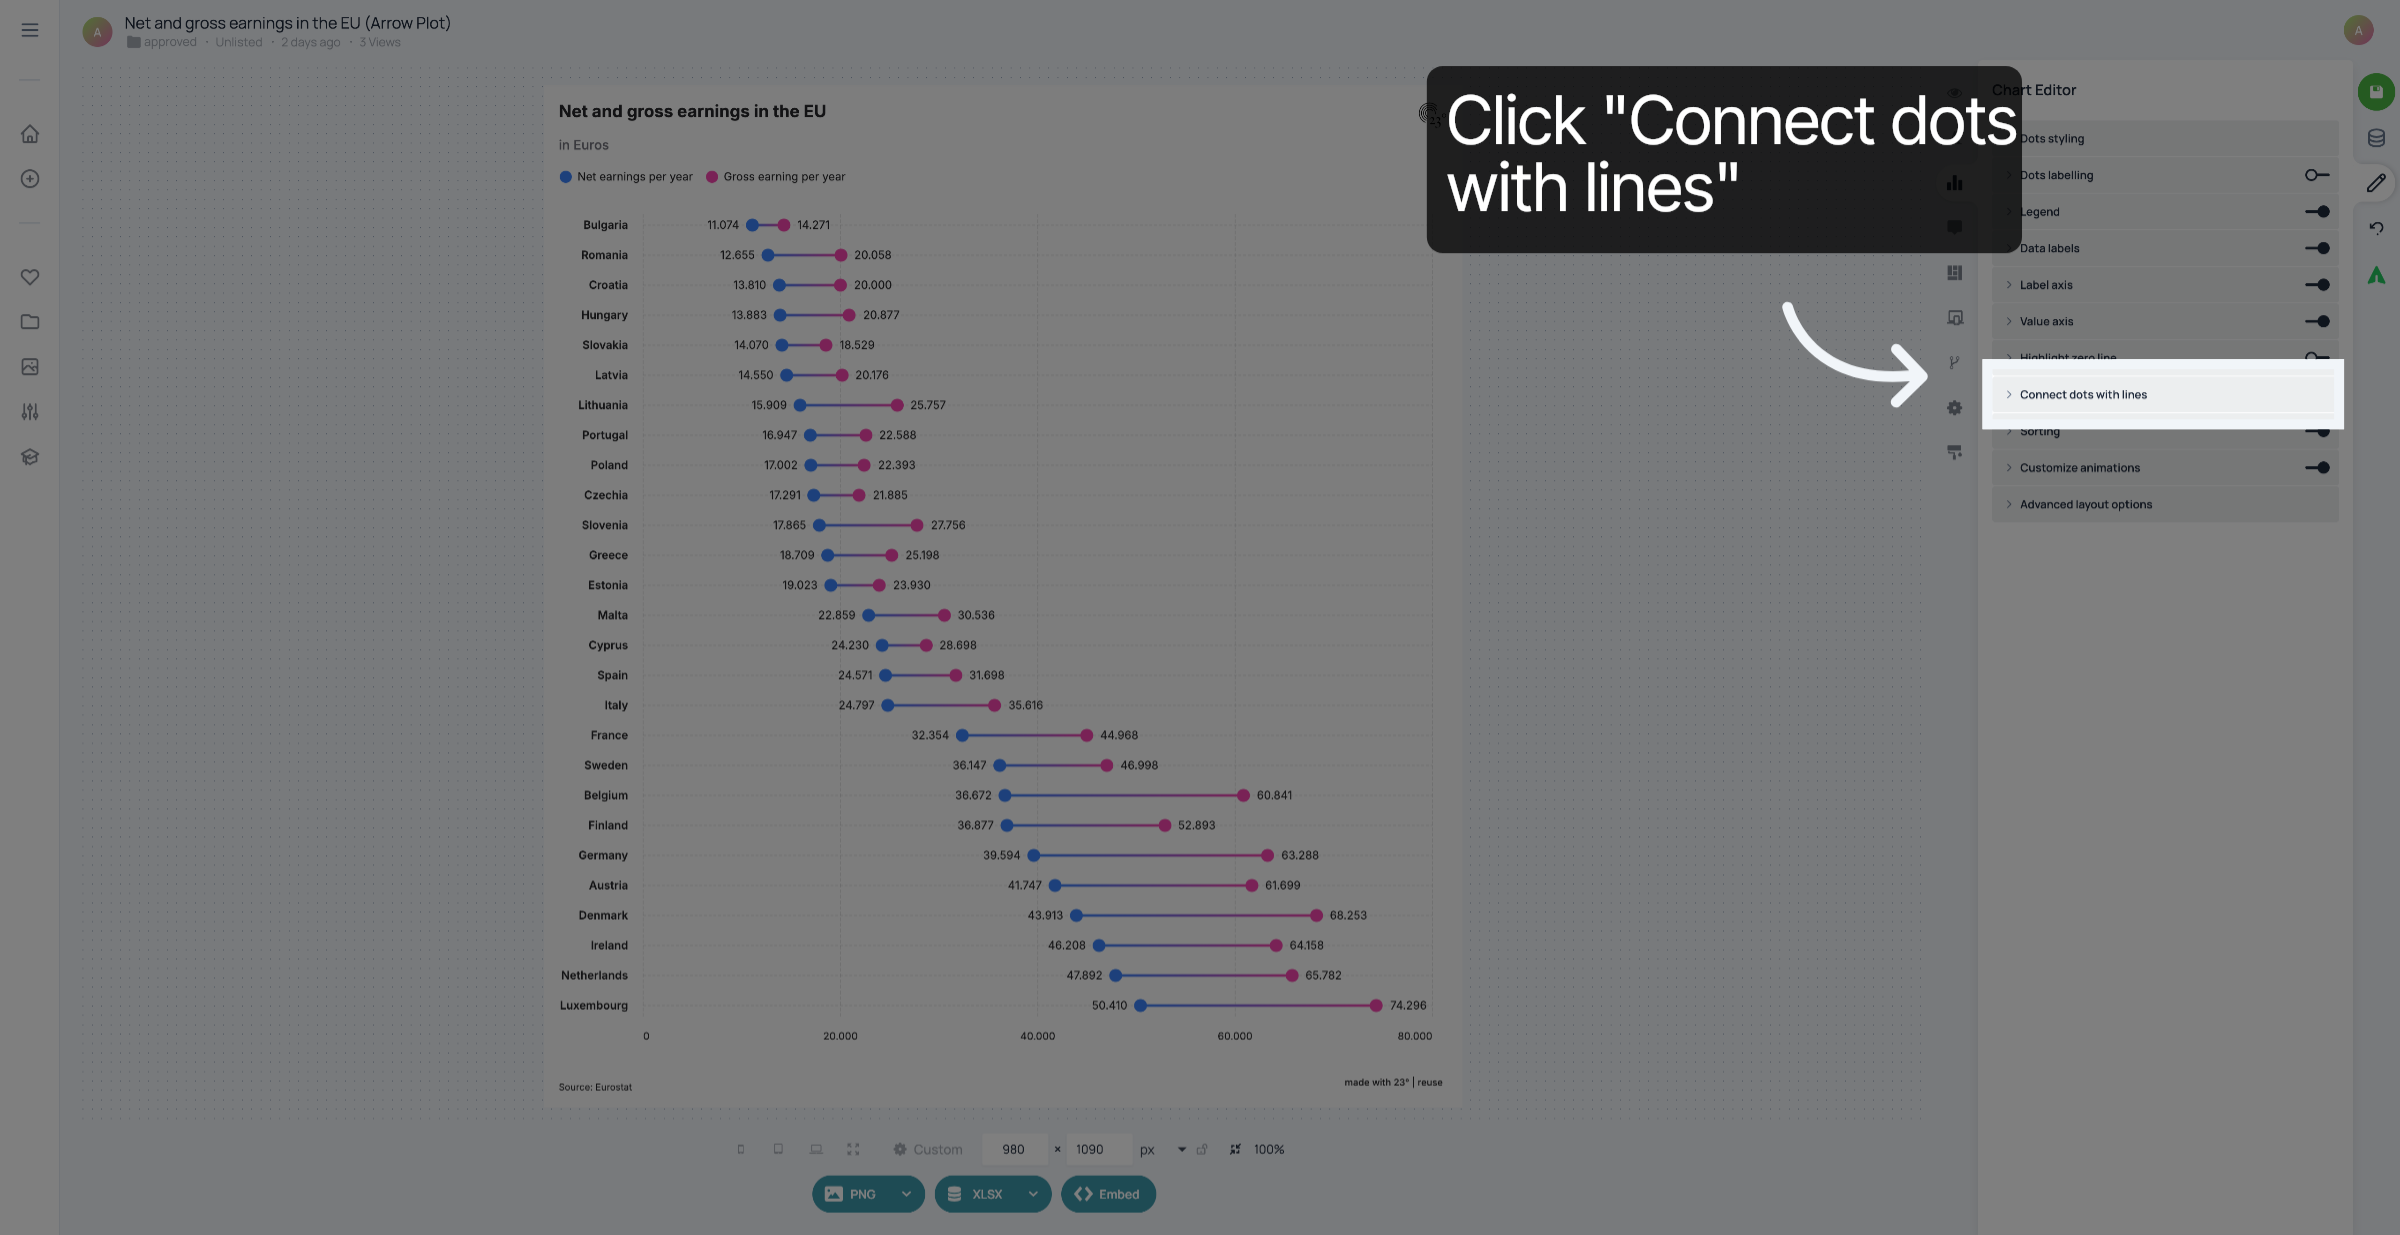
2. Click "Connect dots with lines"
Click "Connect dots with lines".
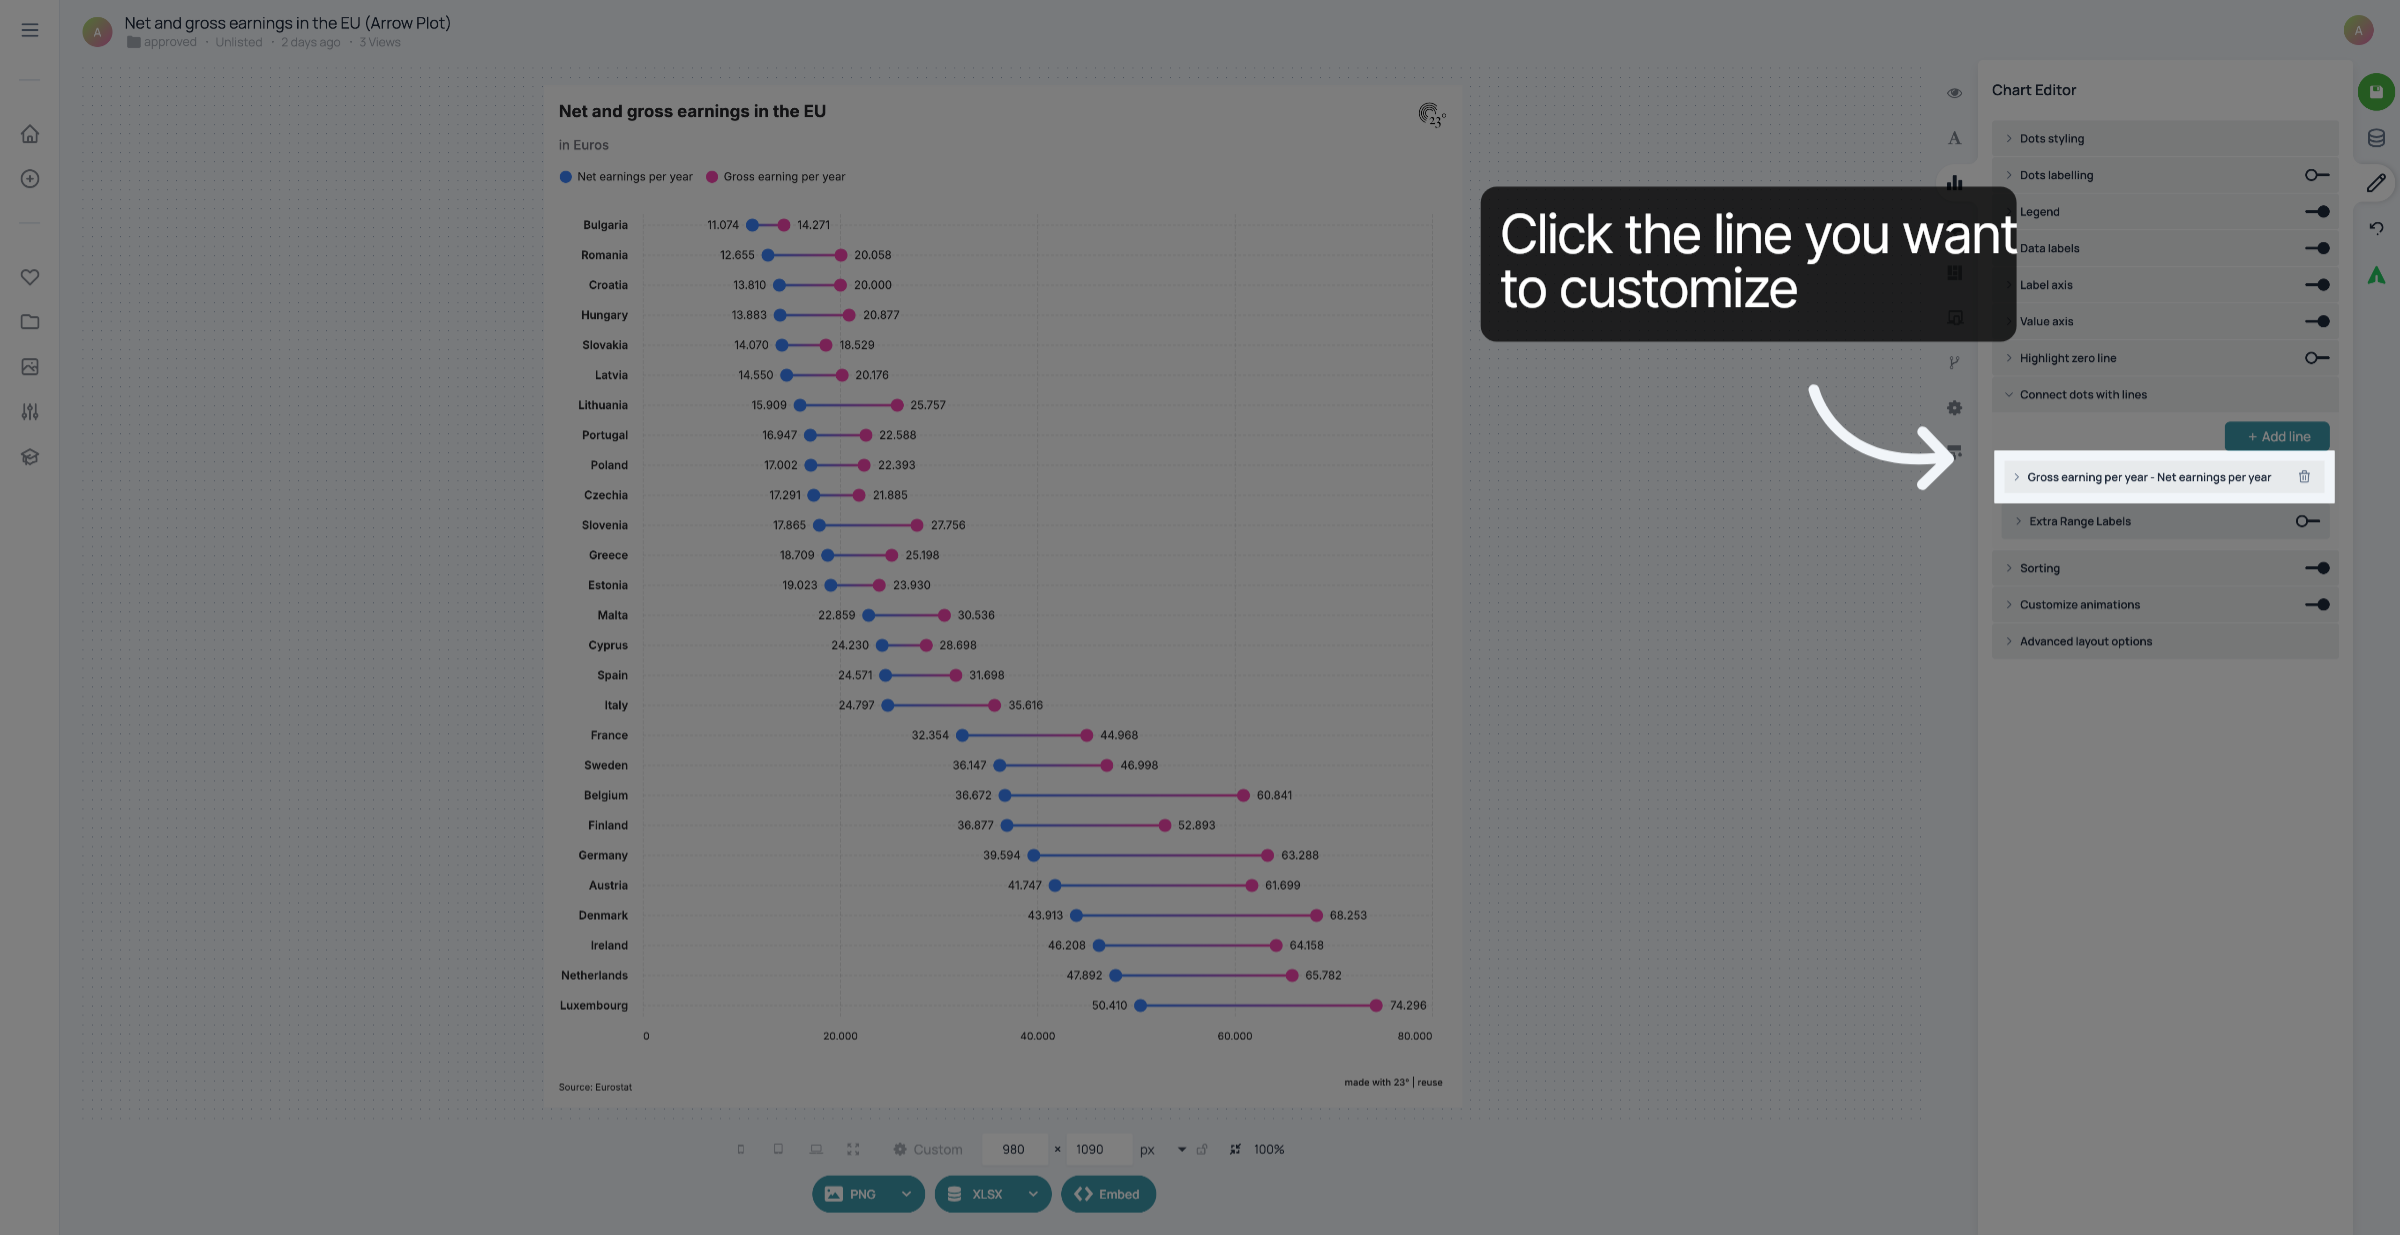
3. Click the line you want to customize
Selec the line you want to customize.
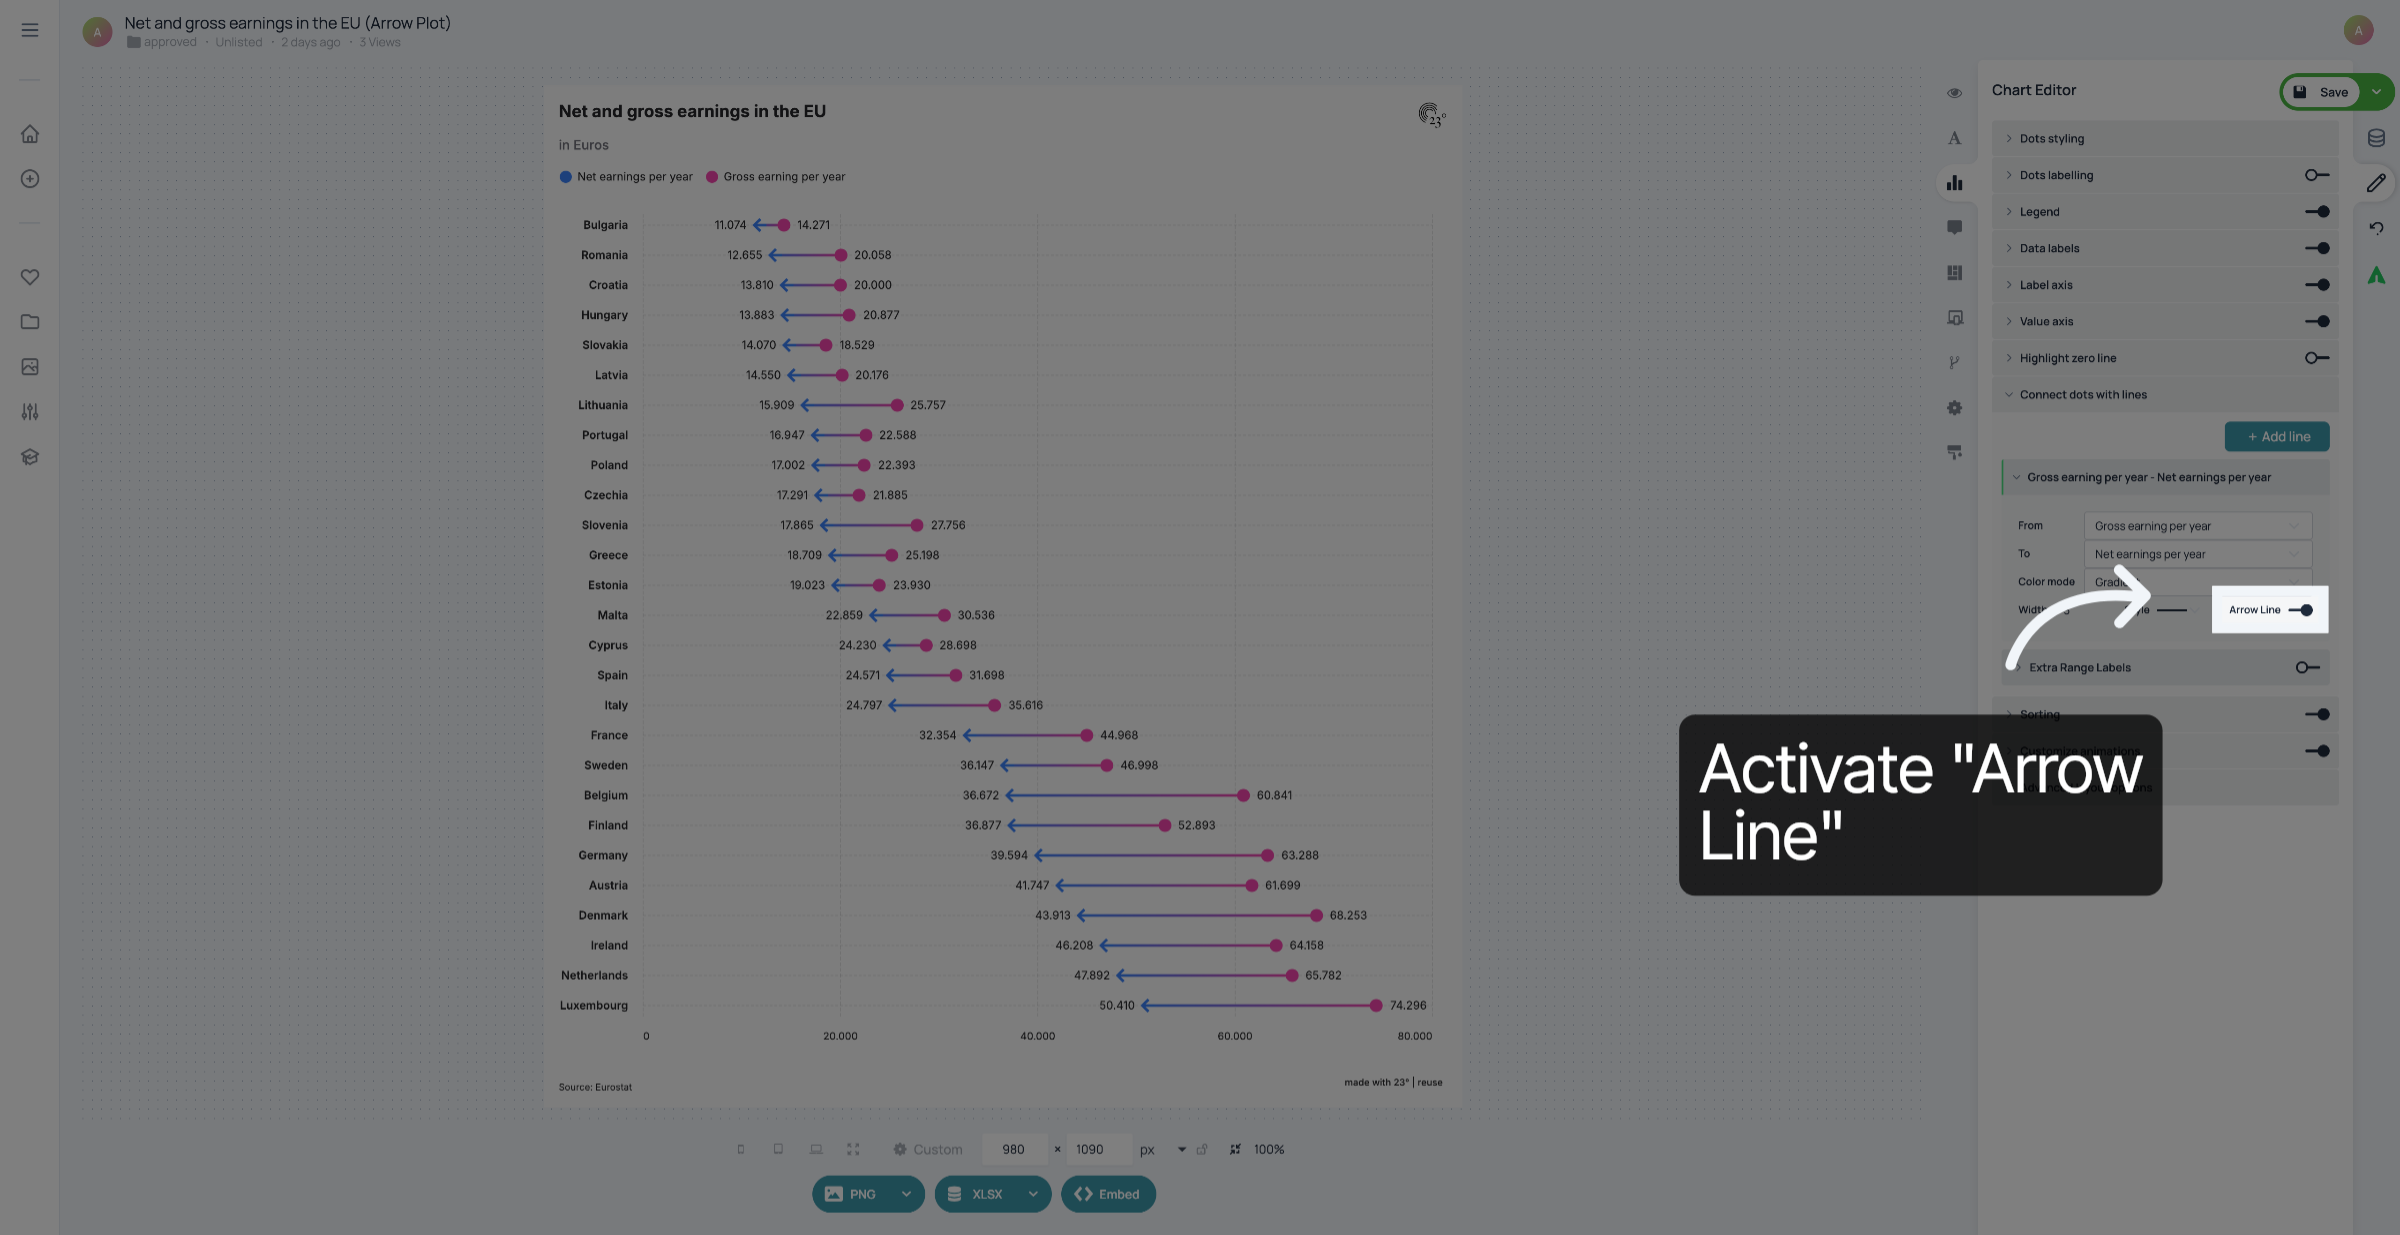
4. Activate "Arrow Line"
Activate "Arrow Line".
5. Click Save
Don't forget to save your changes.
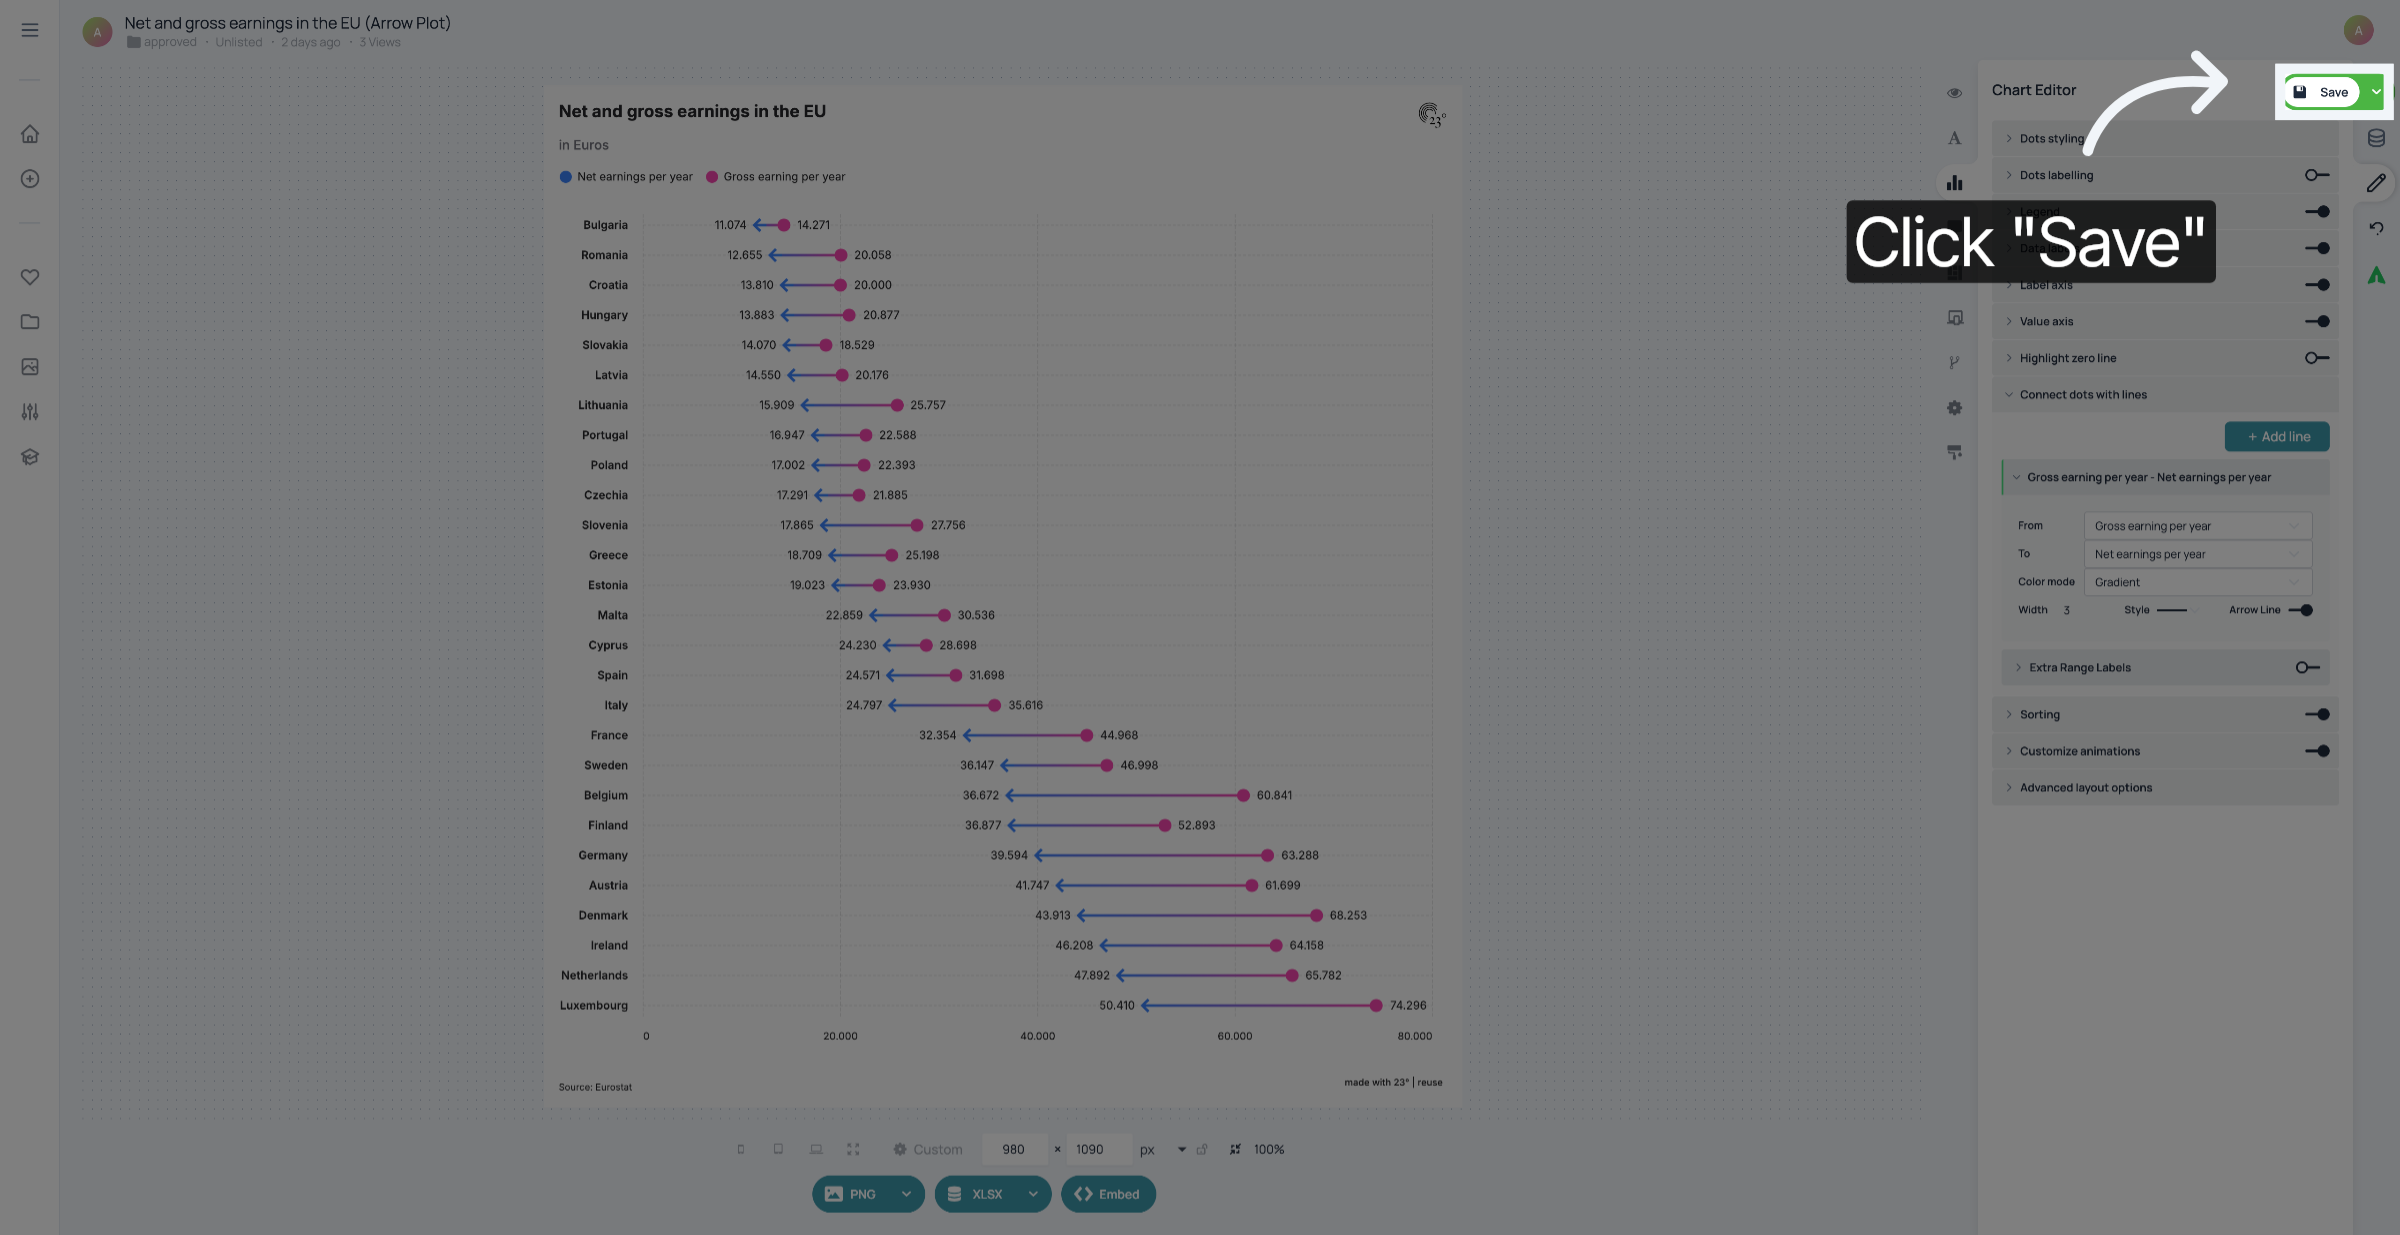
You have successfully turned your range plot into an arrow plot.