Upload csv Into Visualisations Using 23degrees
This tutorial explains how to upload data into a visualisation using the 23degrees application.
1. Select Visualisation
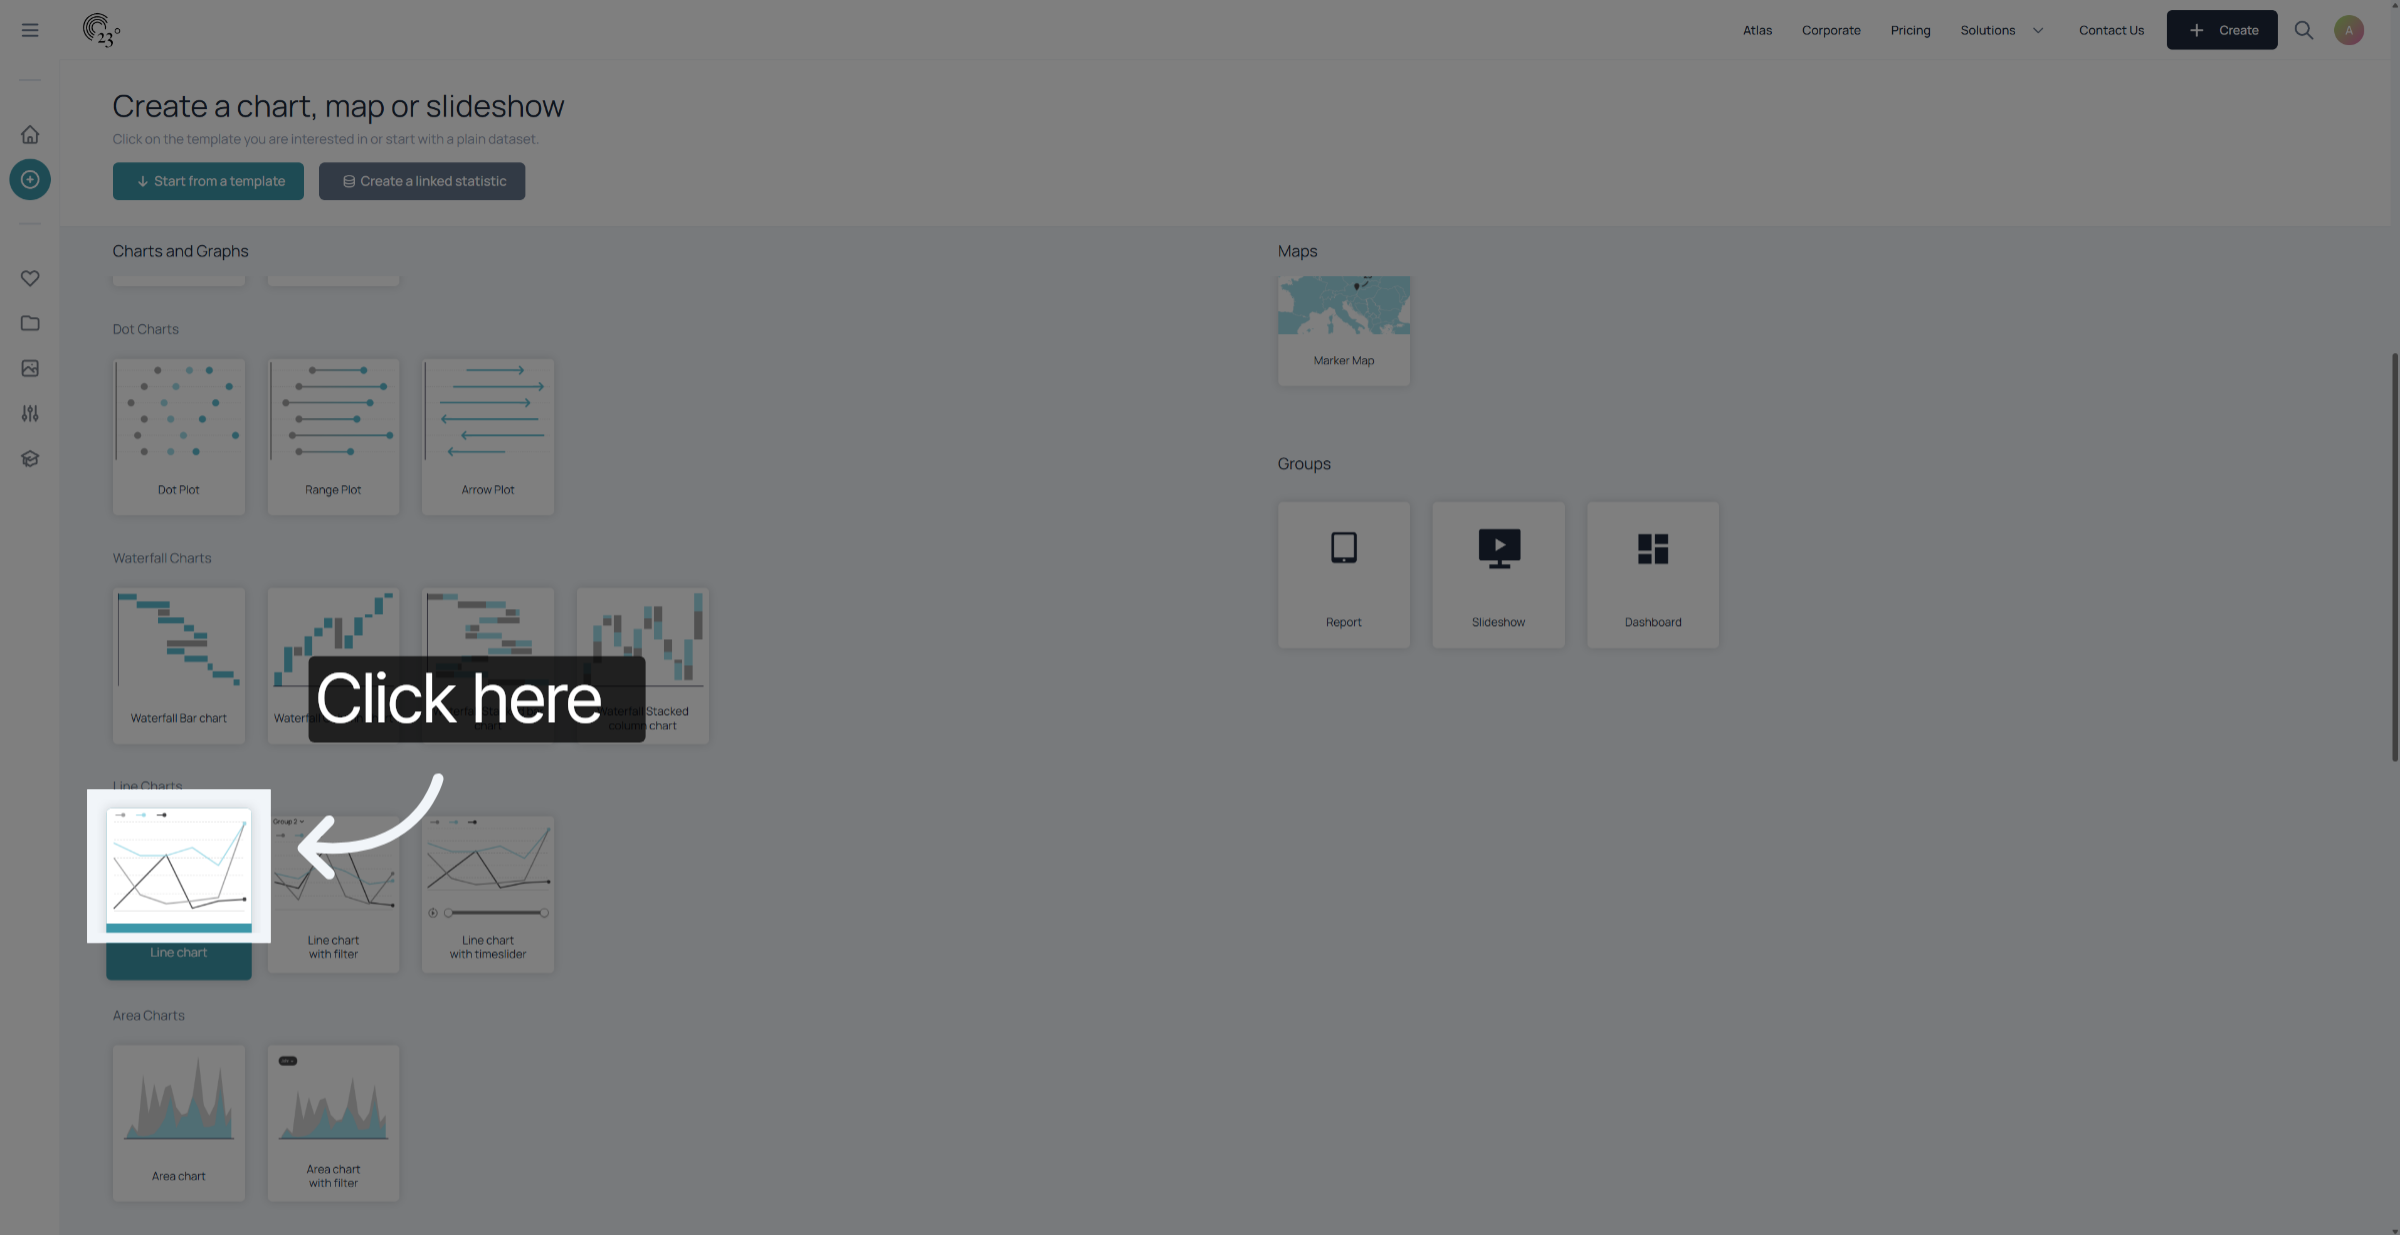
Select the visualisation that you want to create. In this example we want to visualise U.S Population projections over time. Therefore we are going to use a linechart do display the data.
2. Upload Interface
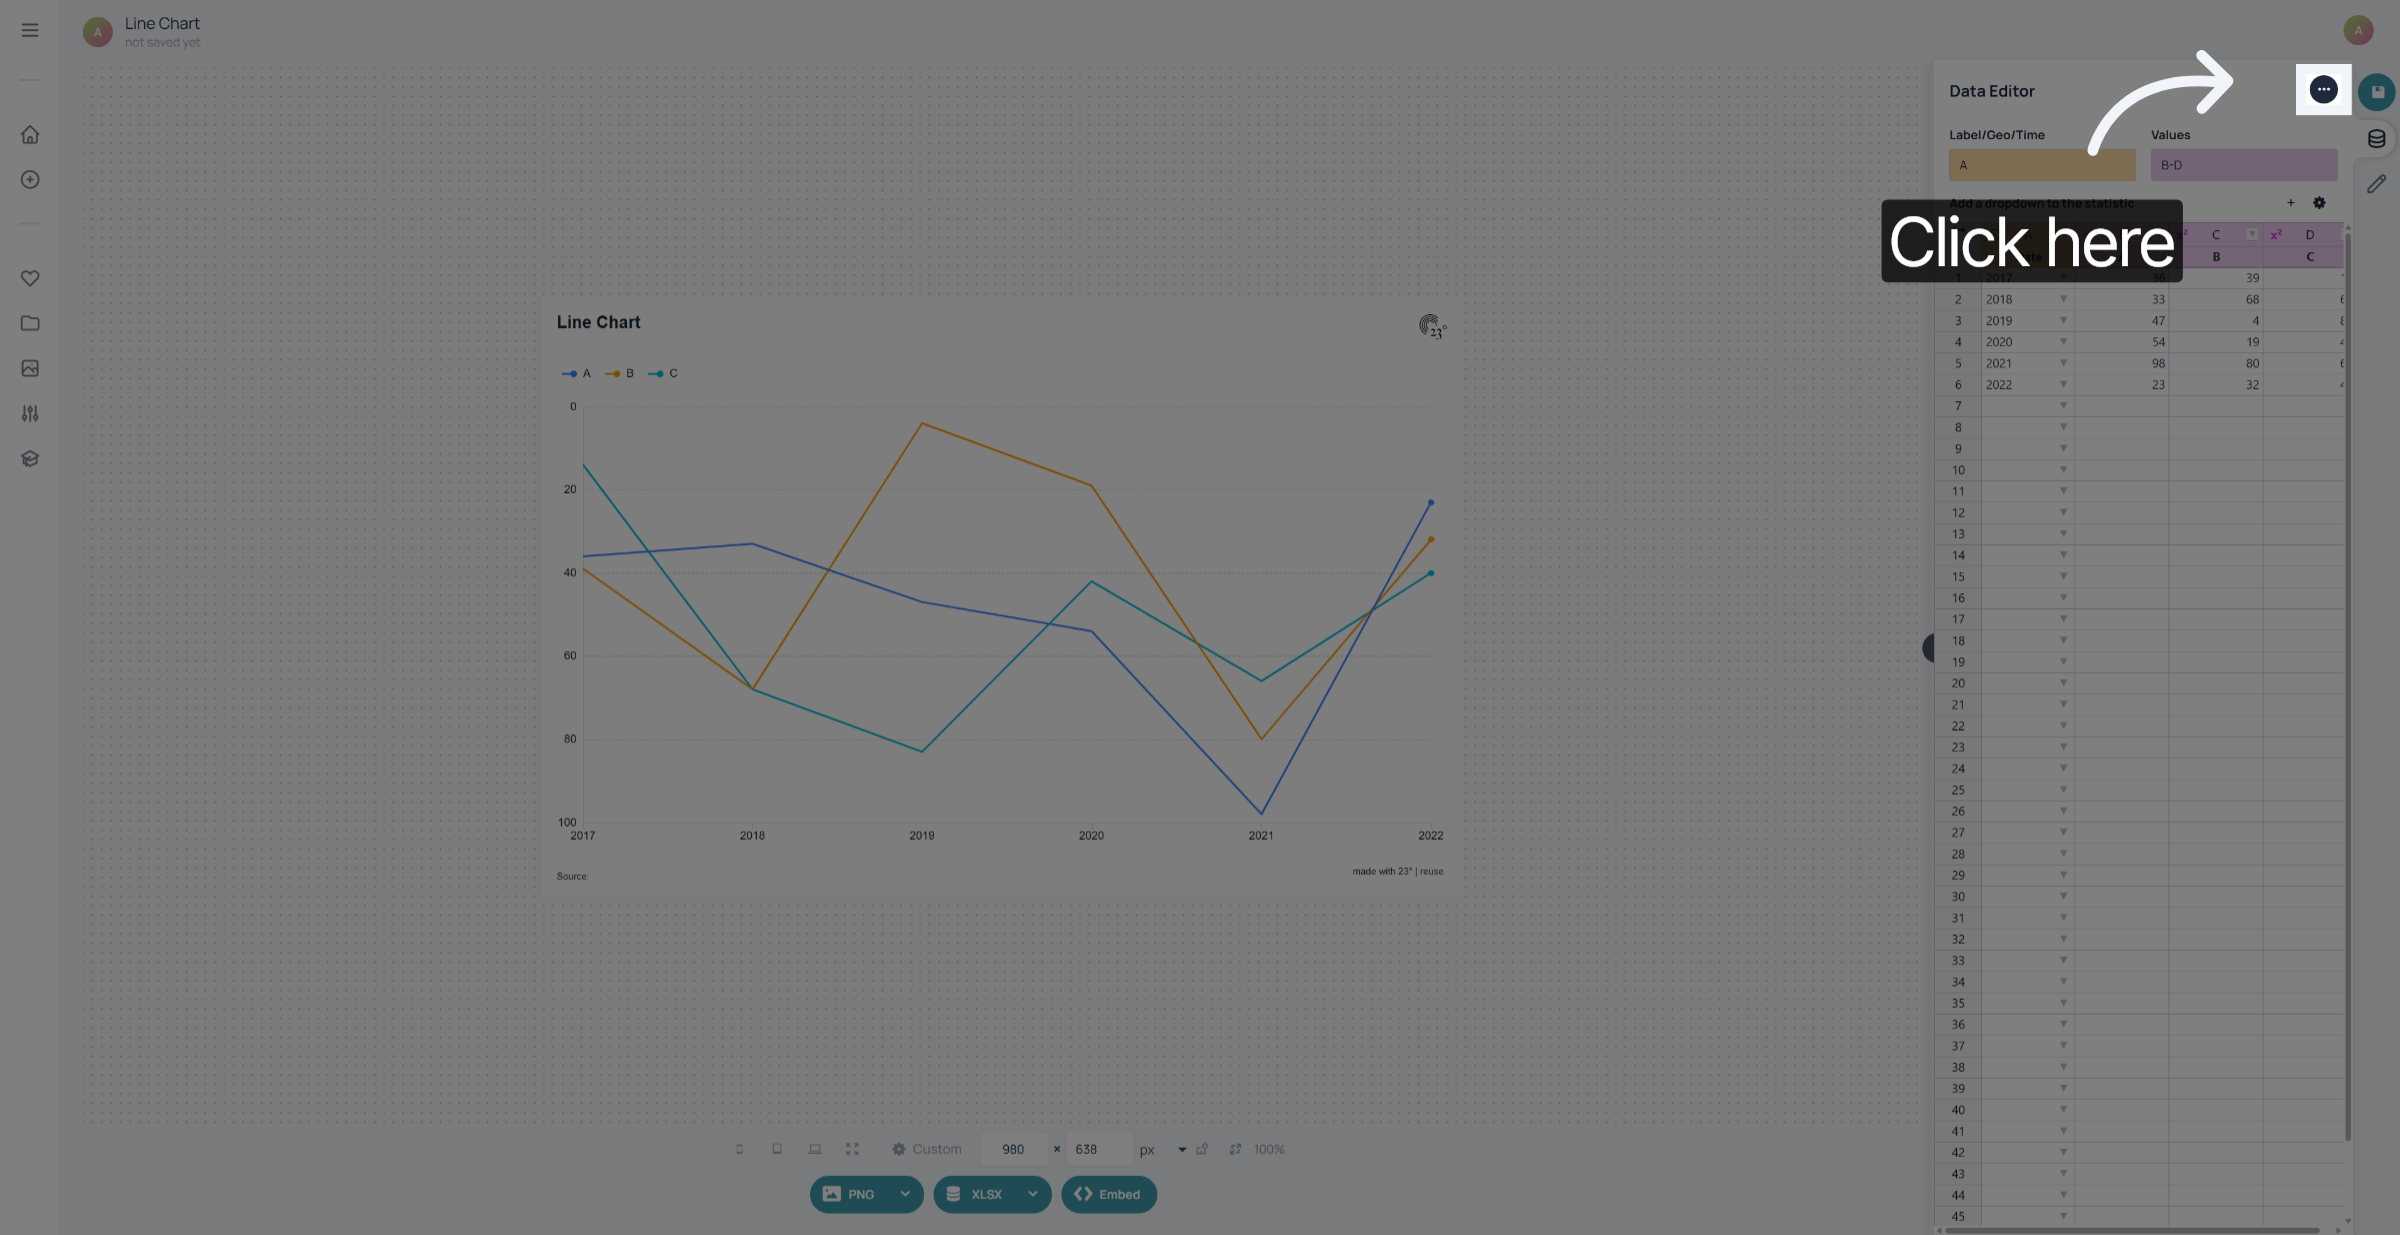
Click on the three dots in the top right corner of the screen.
3. Upload
Drag and Drop your machine readable csv in the highligted area. You can also click on the area to select a file from your computer to import it.
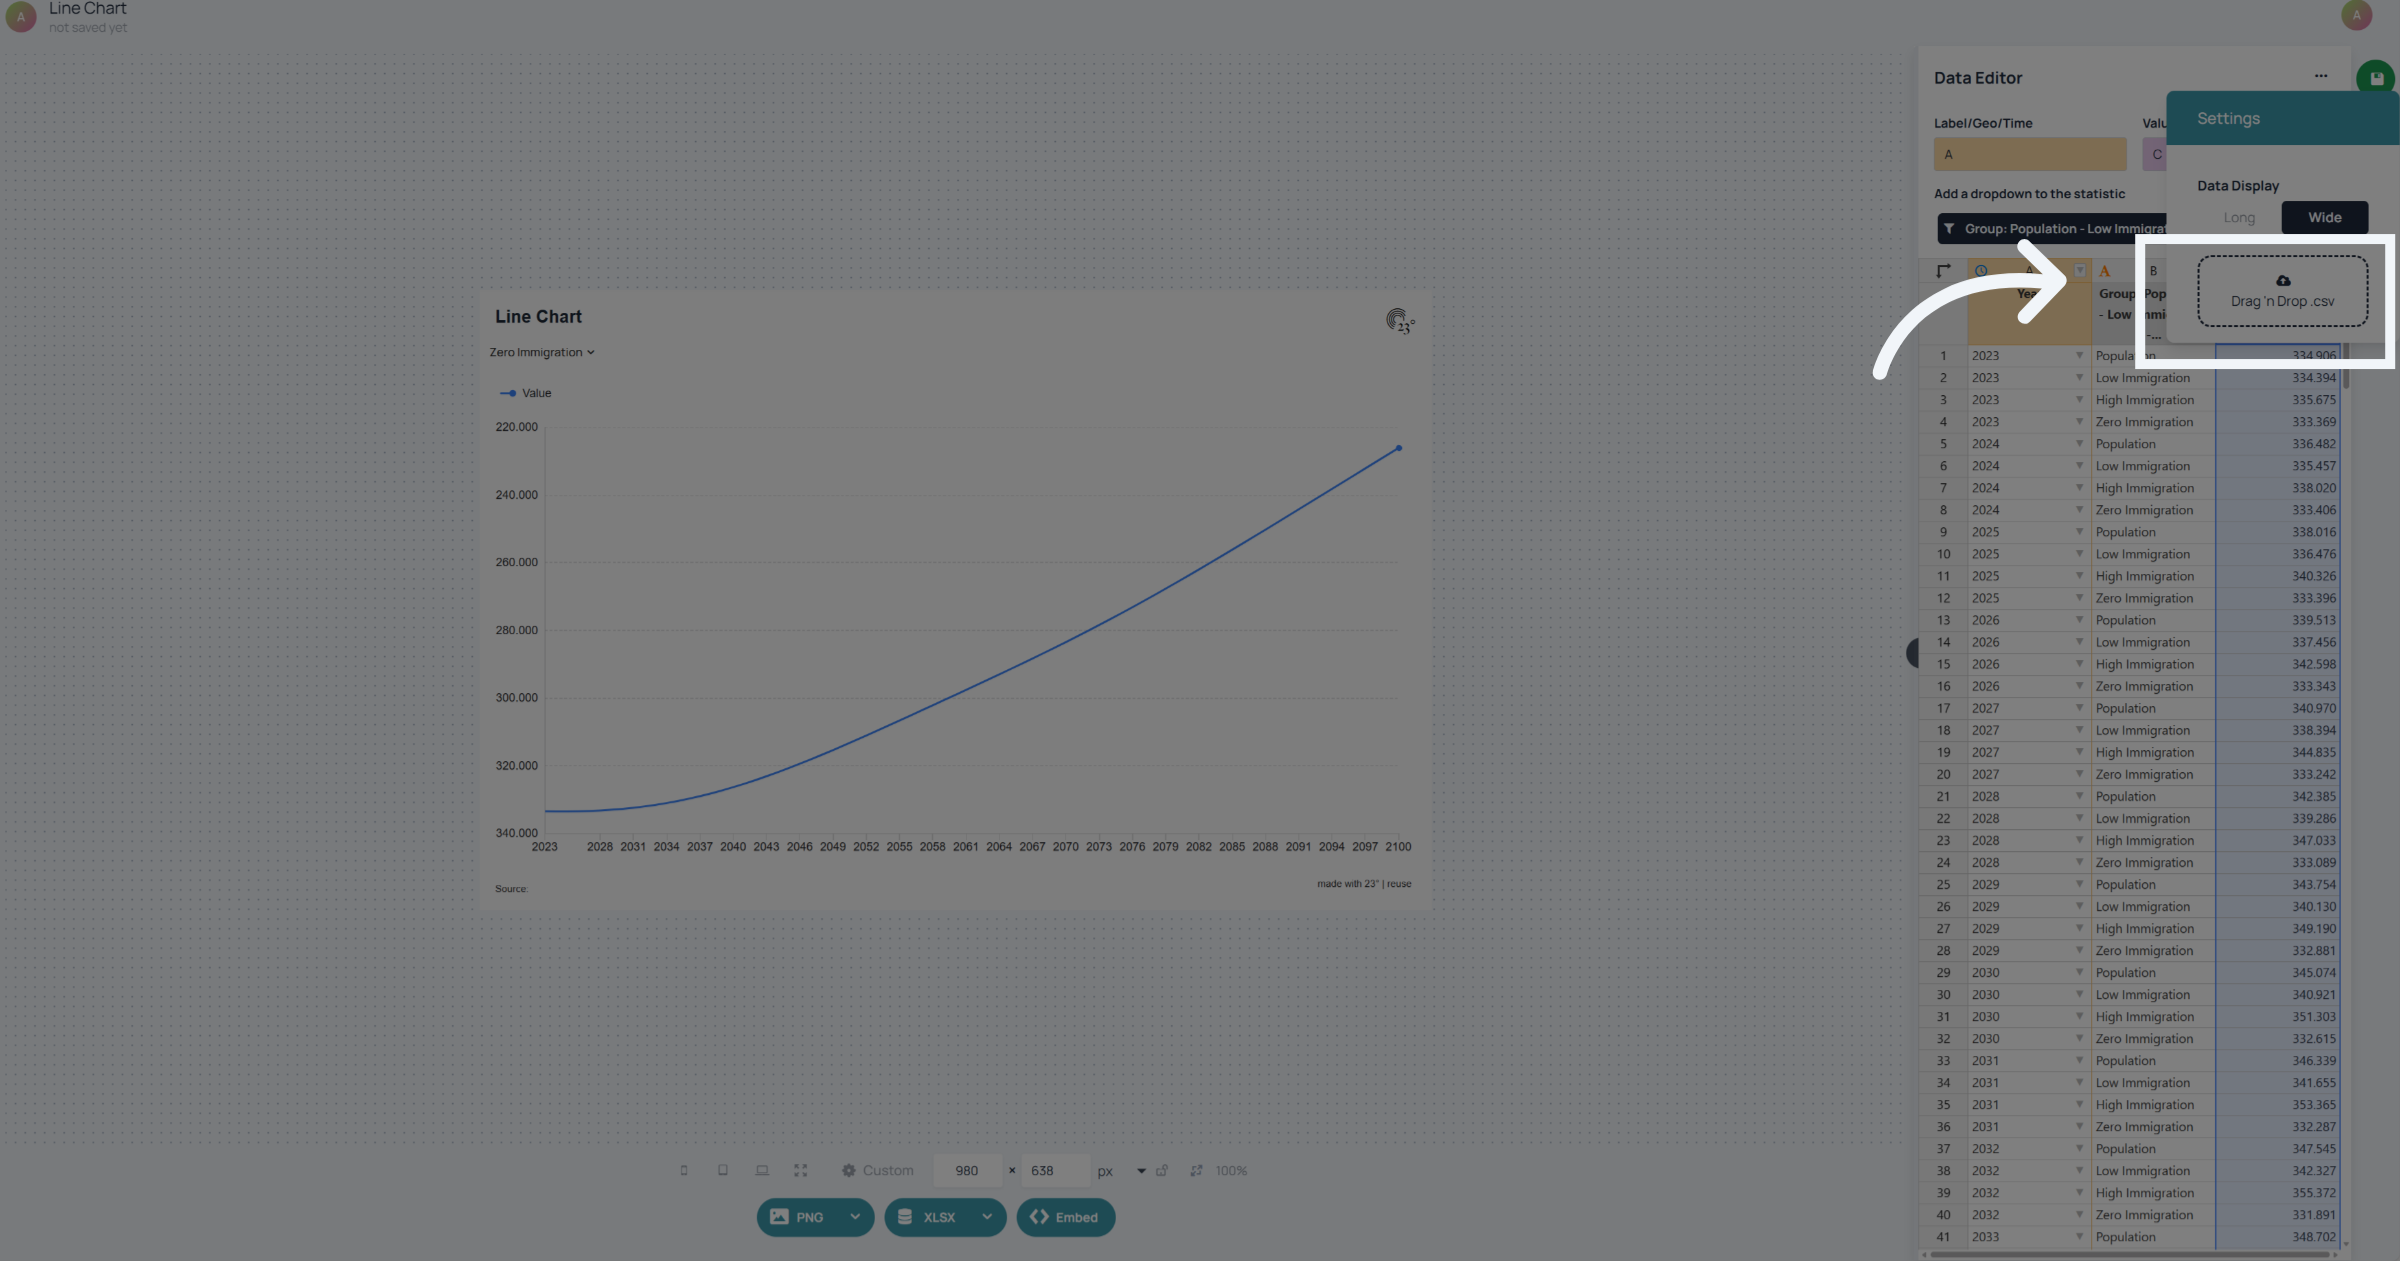
You have successfully uploaded data into a visualization using 23degrees