How to turn your Dot Plot into a Range Plot
This tutorial demonstrates how to style the connecting line in Dot Plots, so you can turn your Dot Plot into a Range Plot.
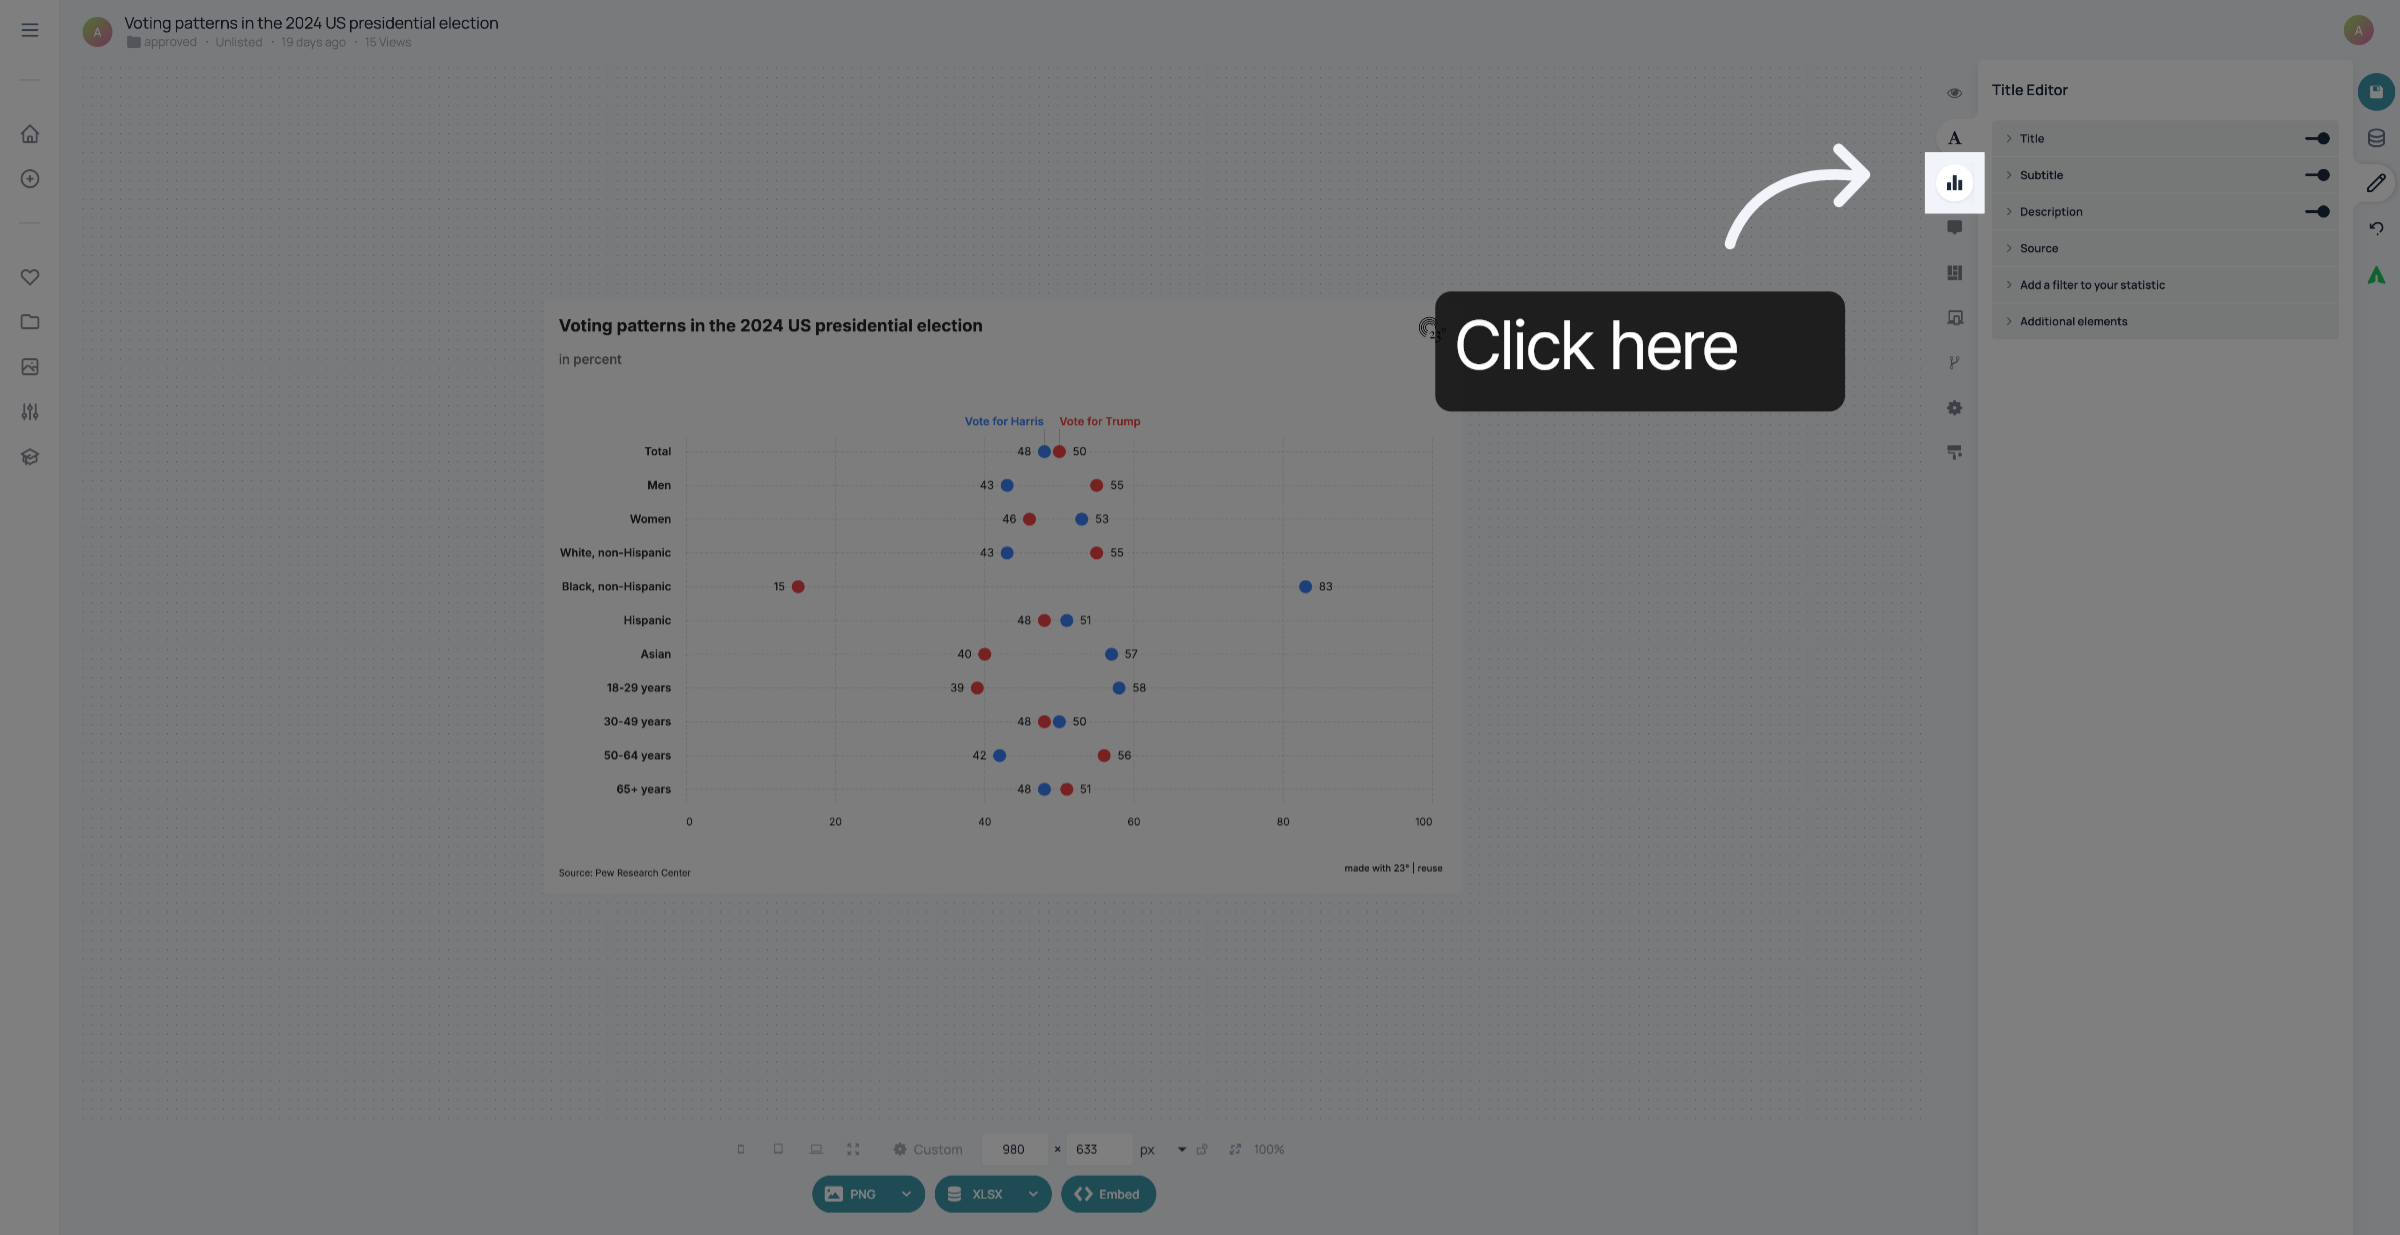
1. Open Chart Editor
Open the Chart Editor.
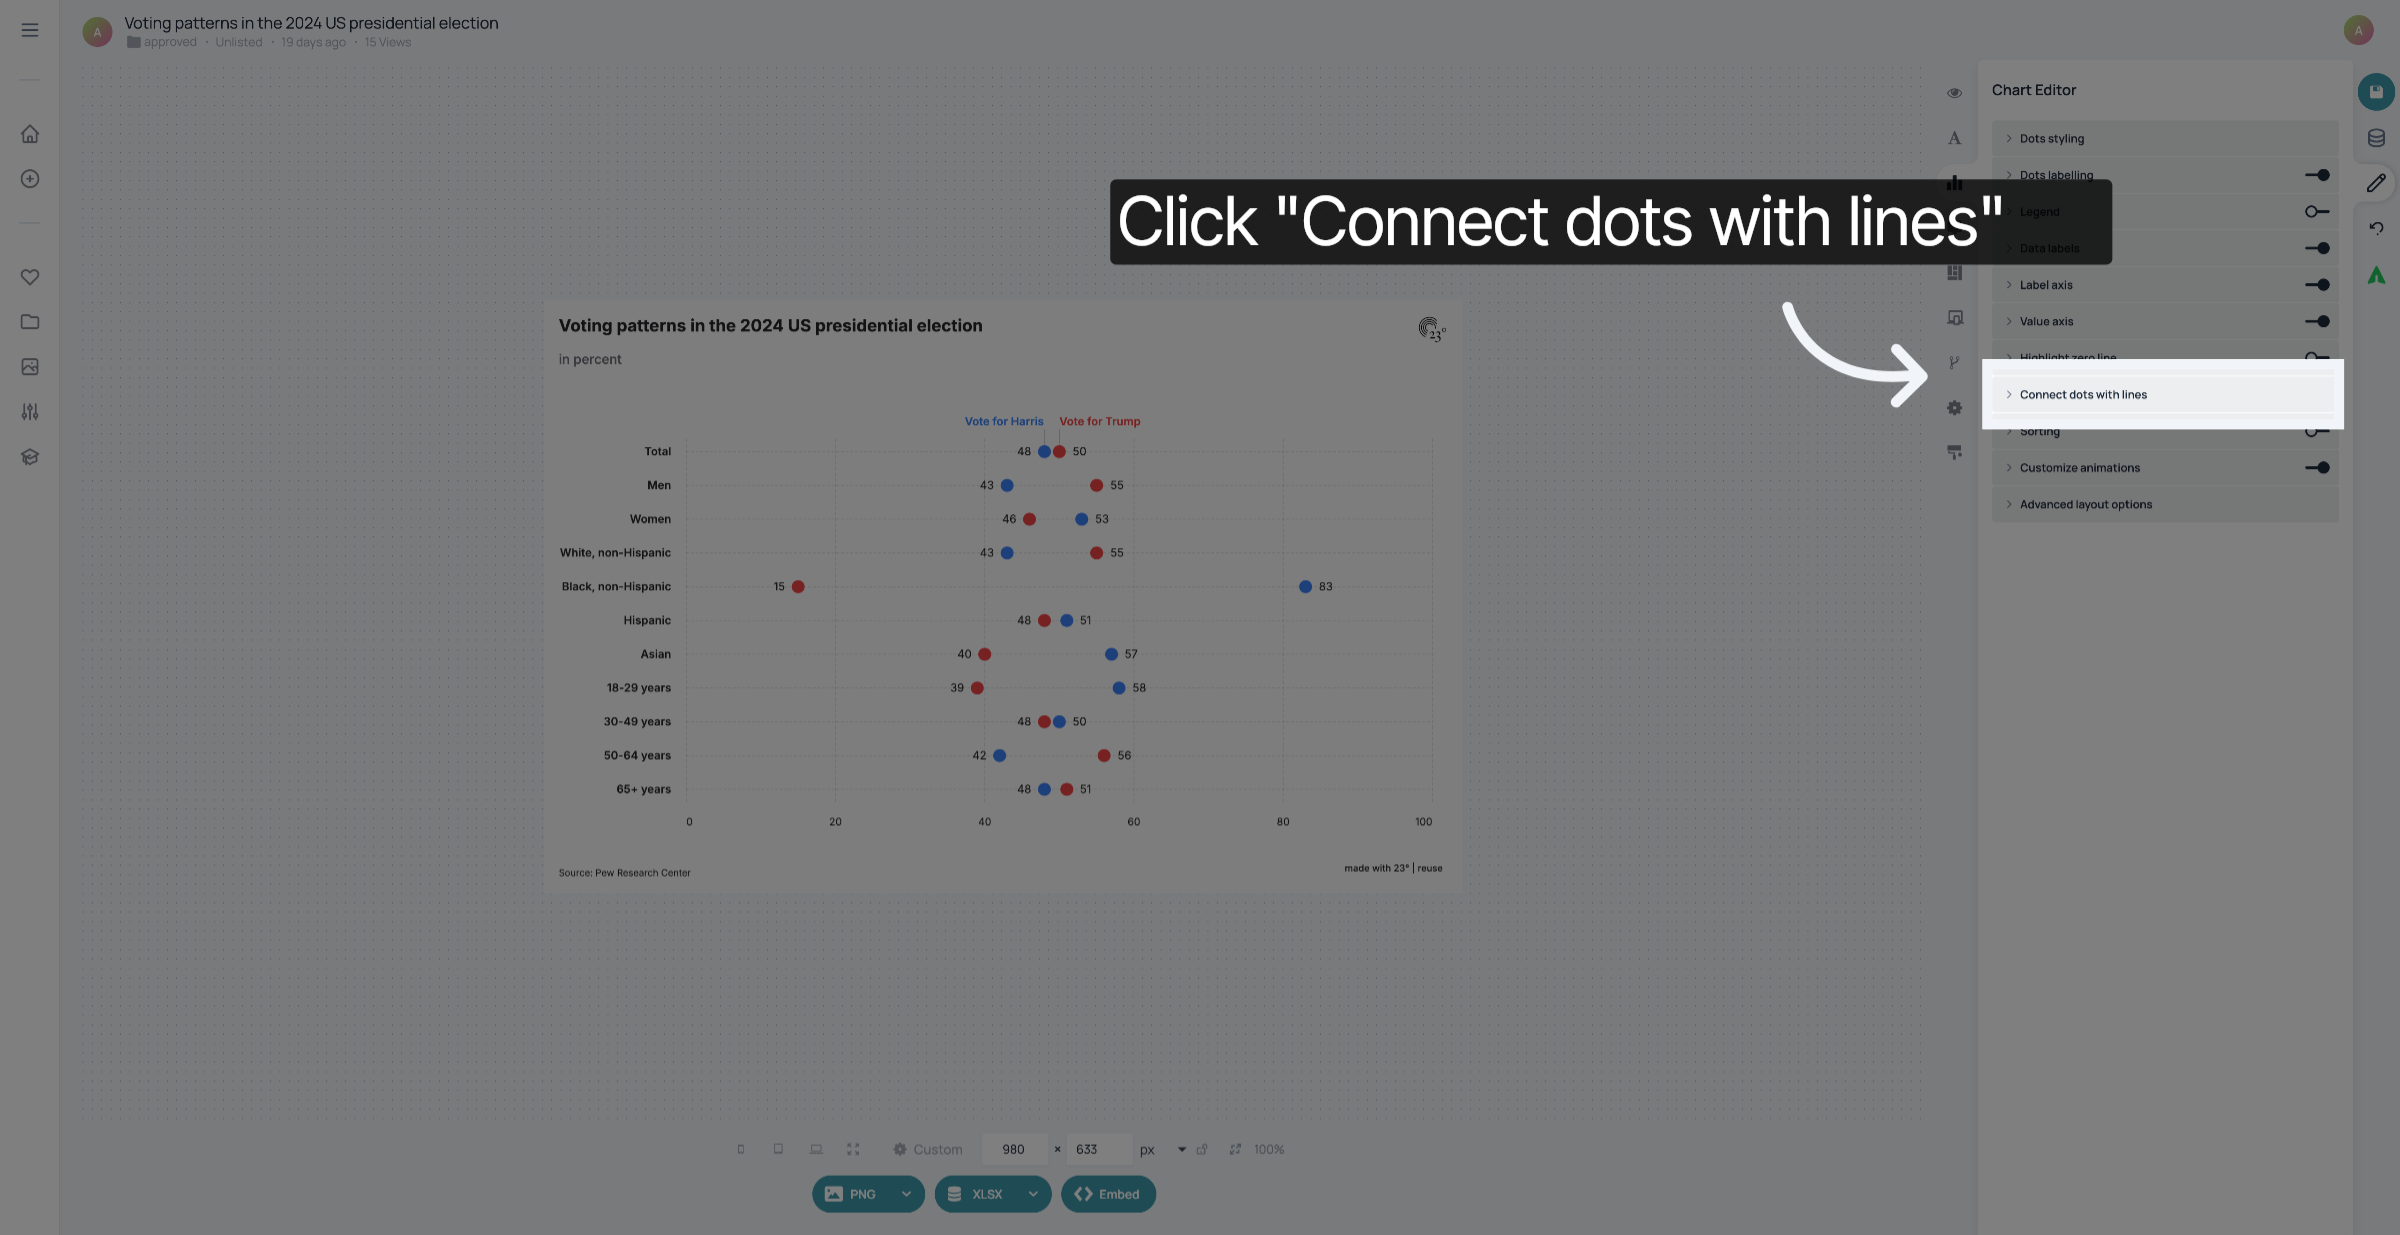
2. Click "Connect dots with lines"
Click "Connect dots with lines".
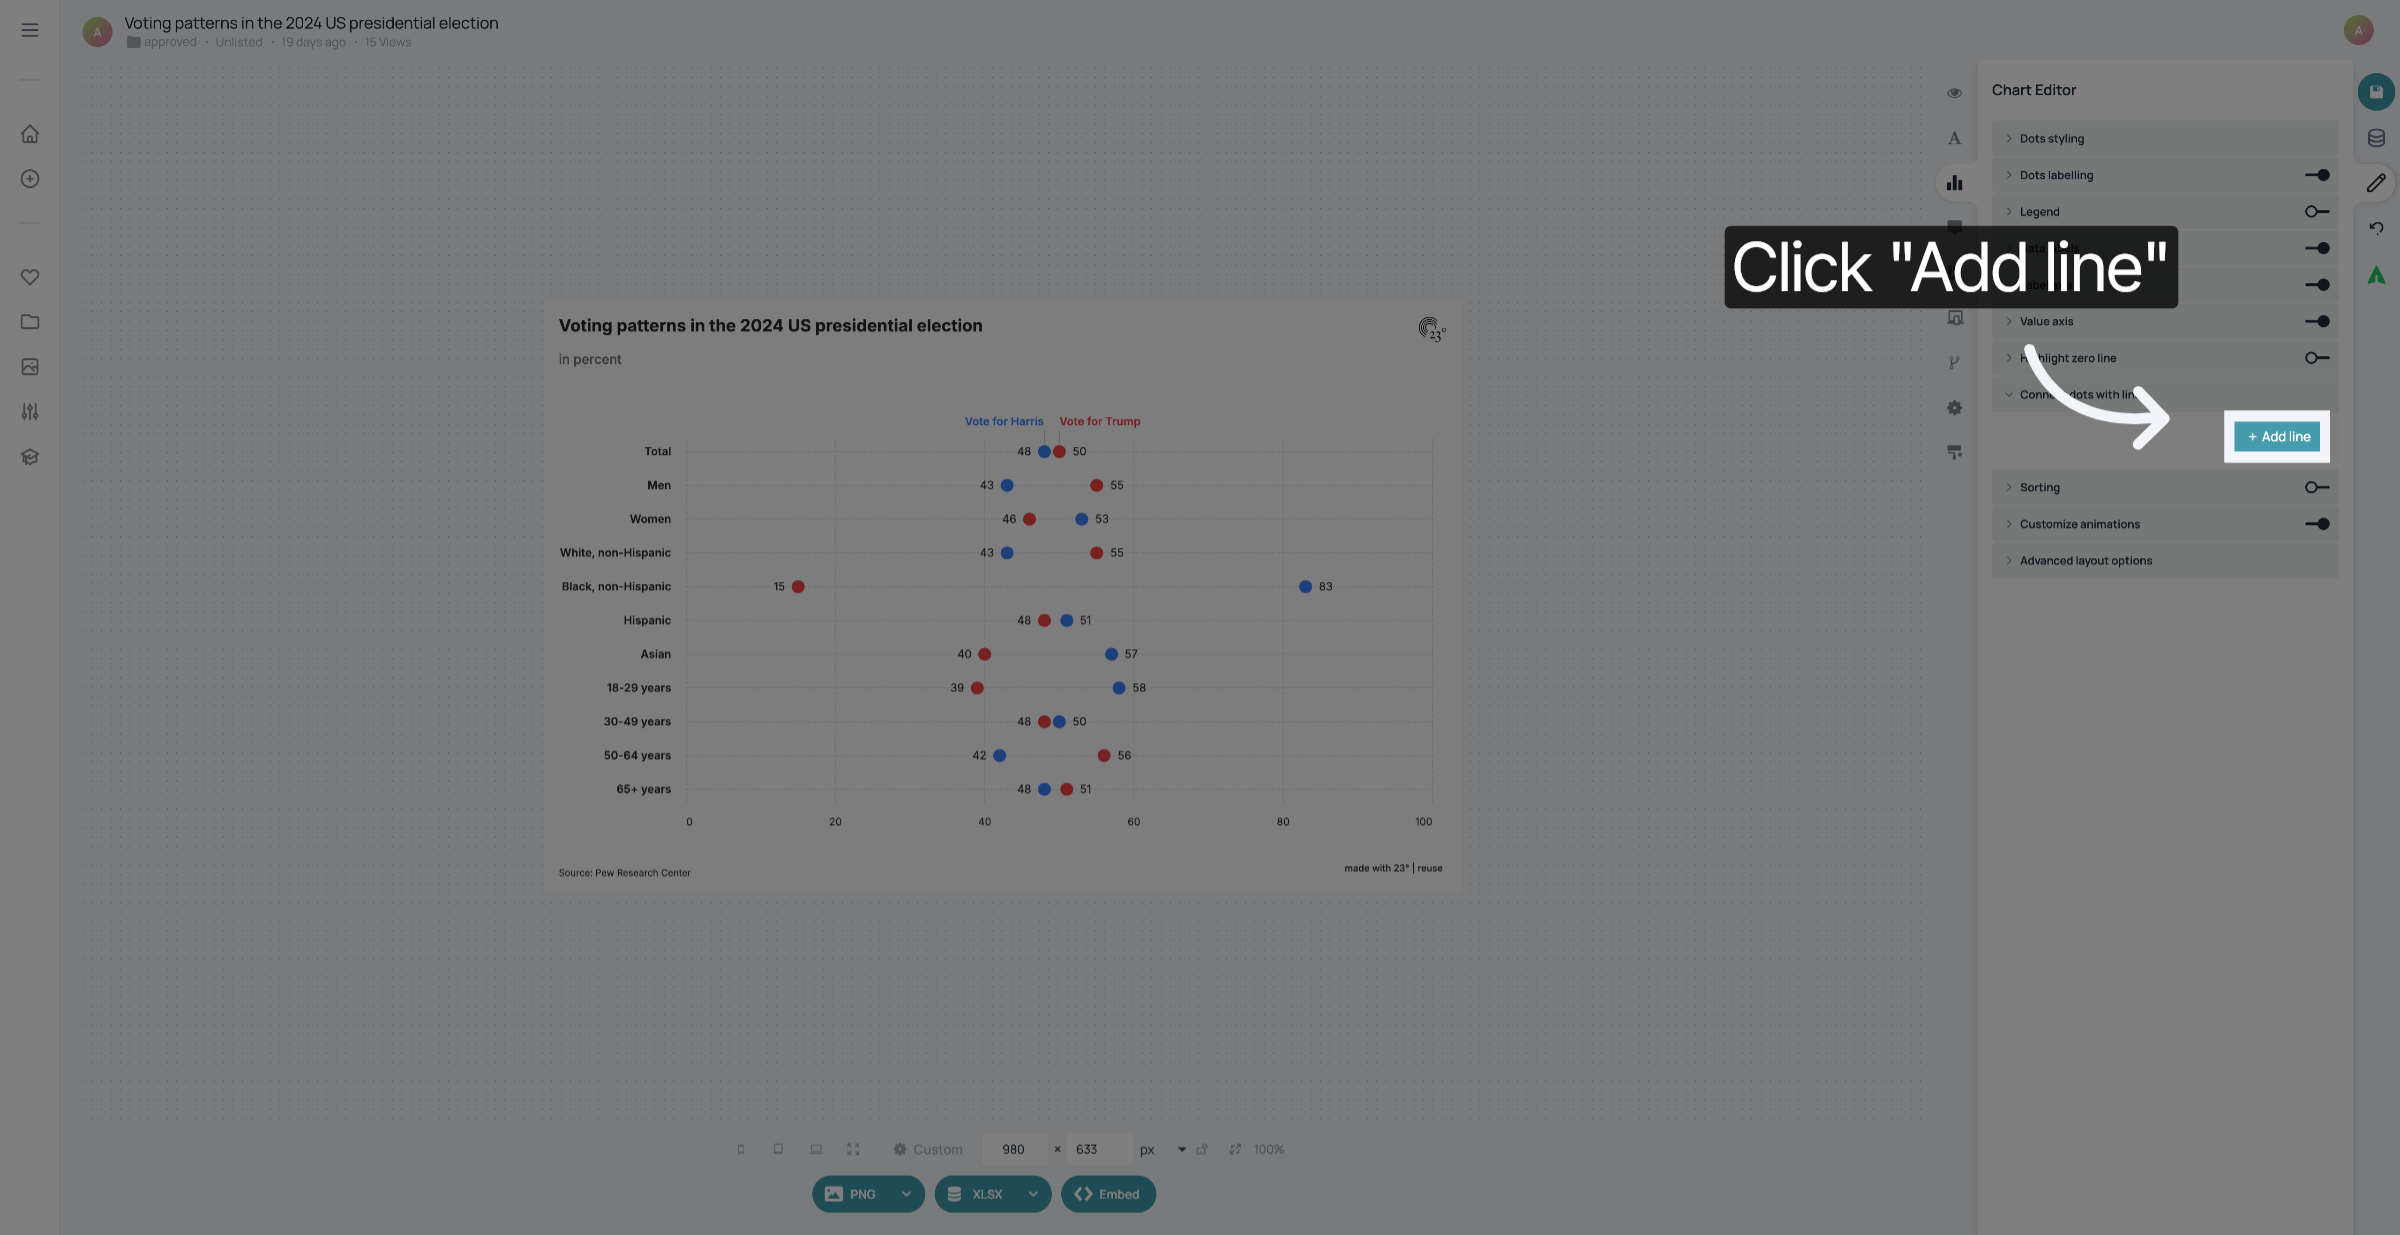
3. Click "+ Add line"
Click "+Add line" to create a connecting line between two categories.
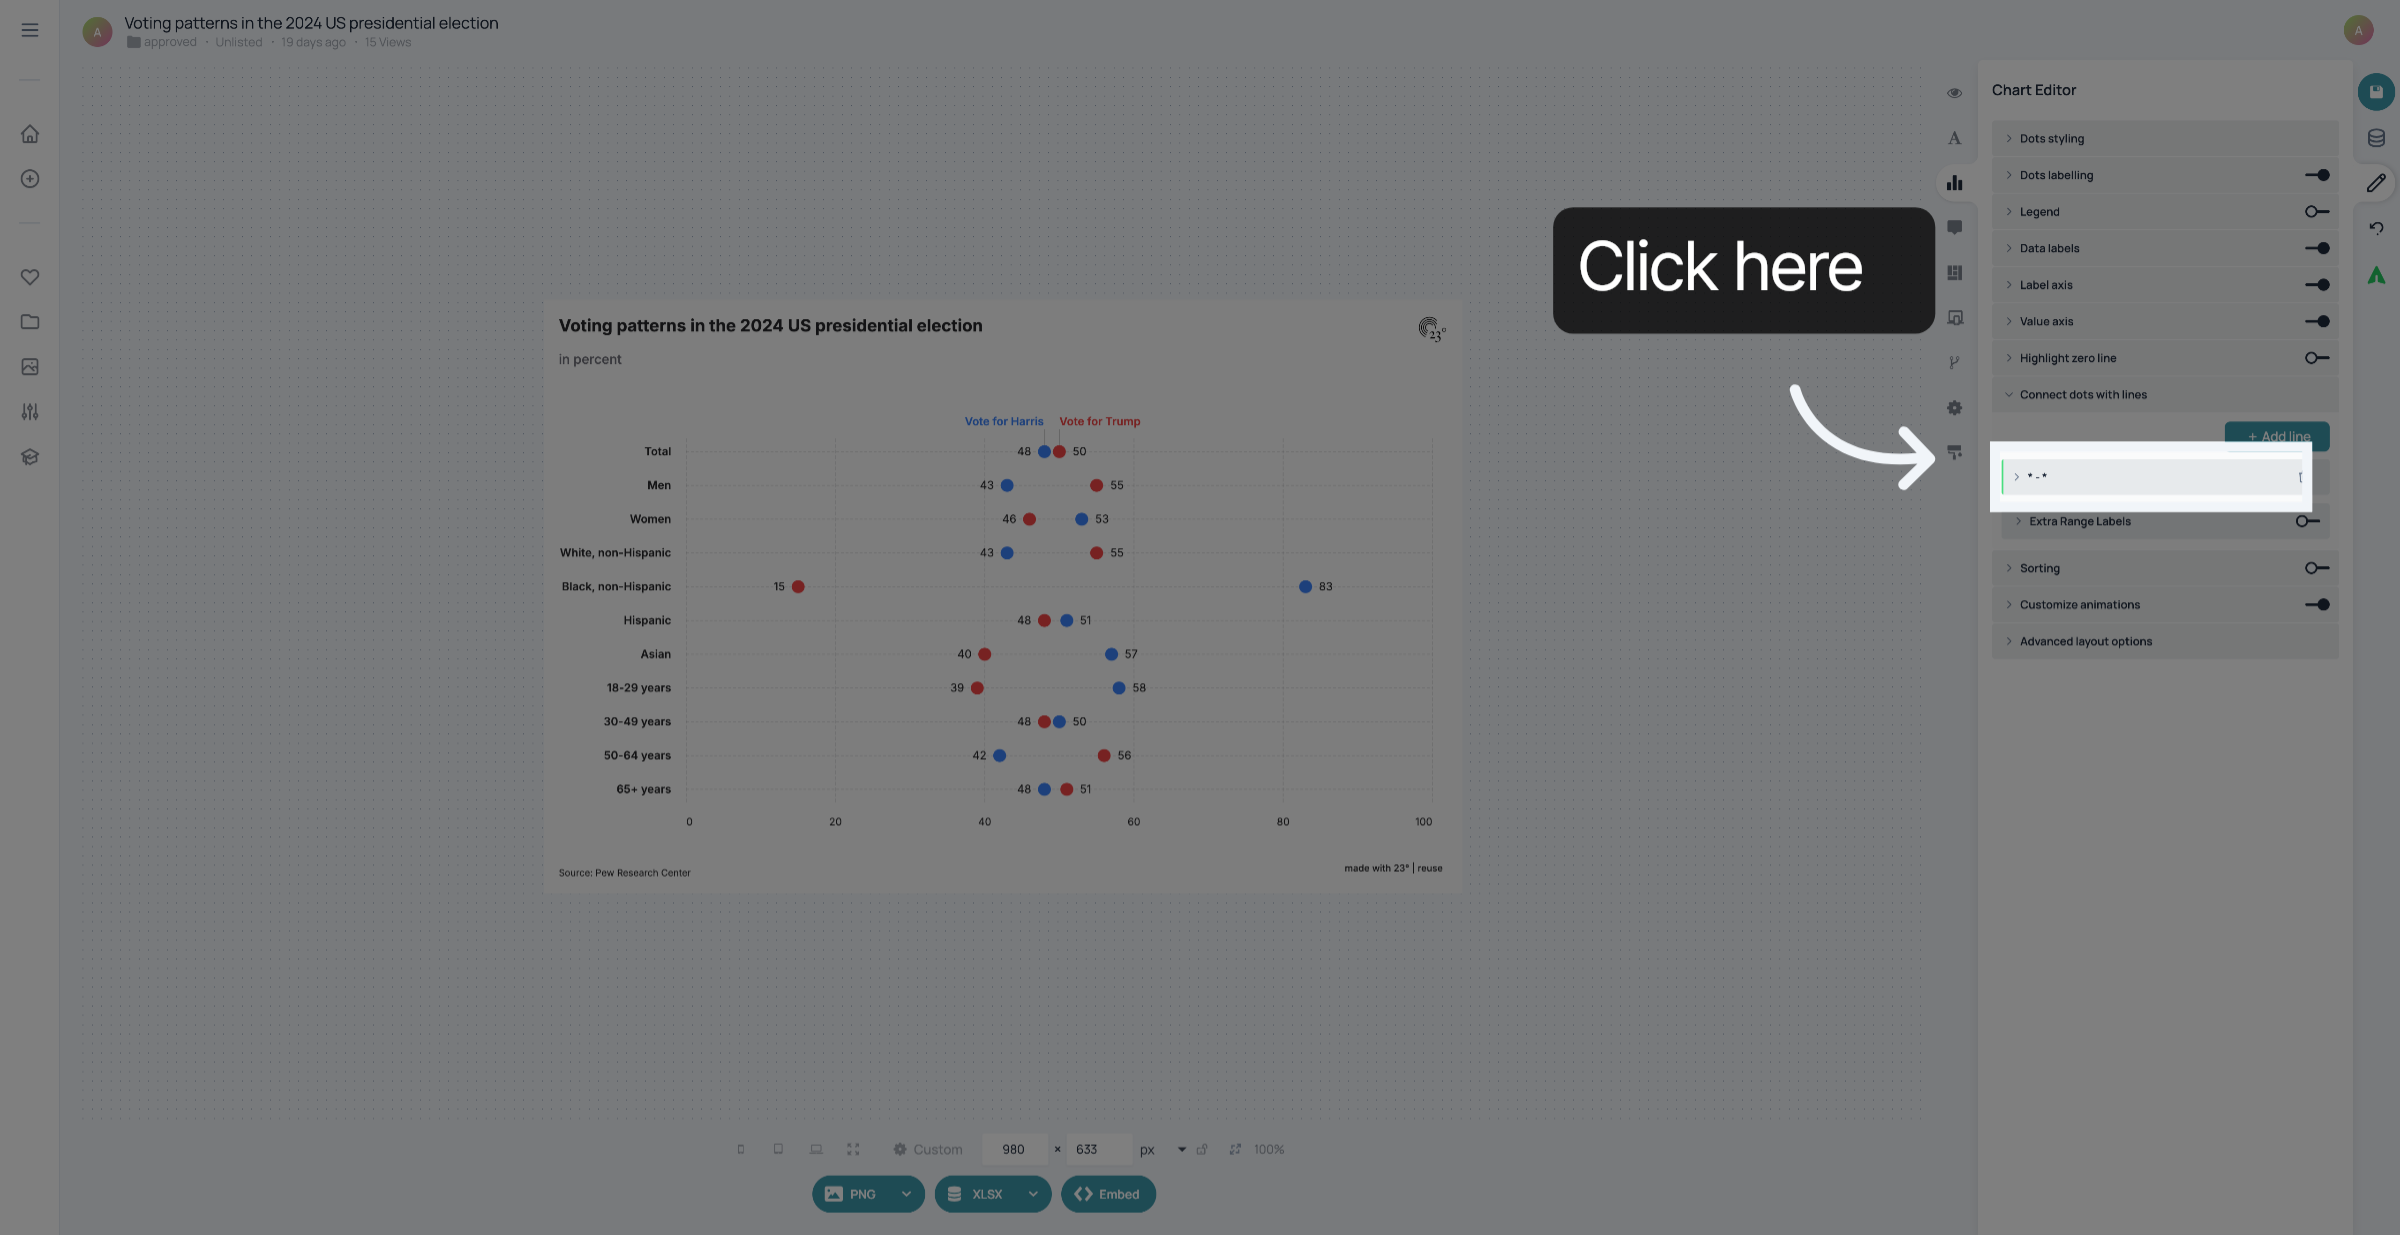
4. Expand "\-\"
Click the placeholder to expand the settings of your connecting line.
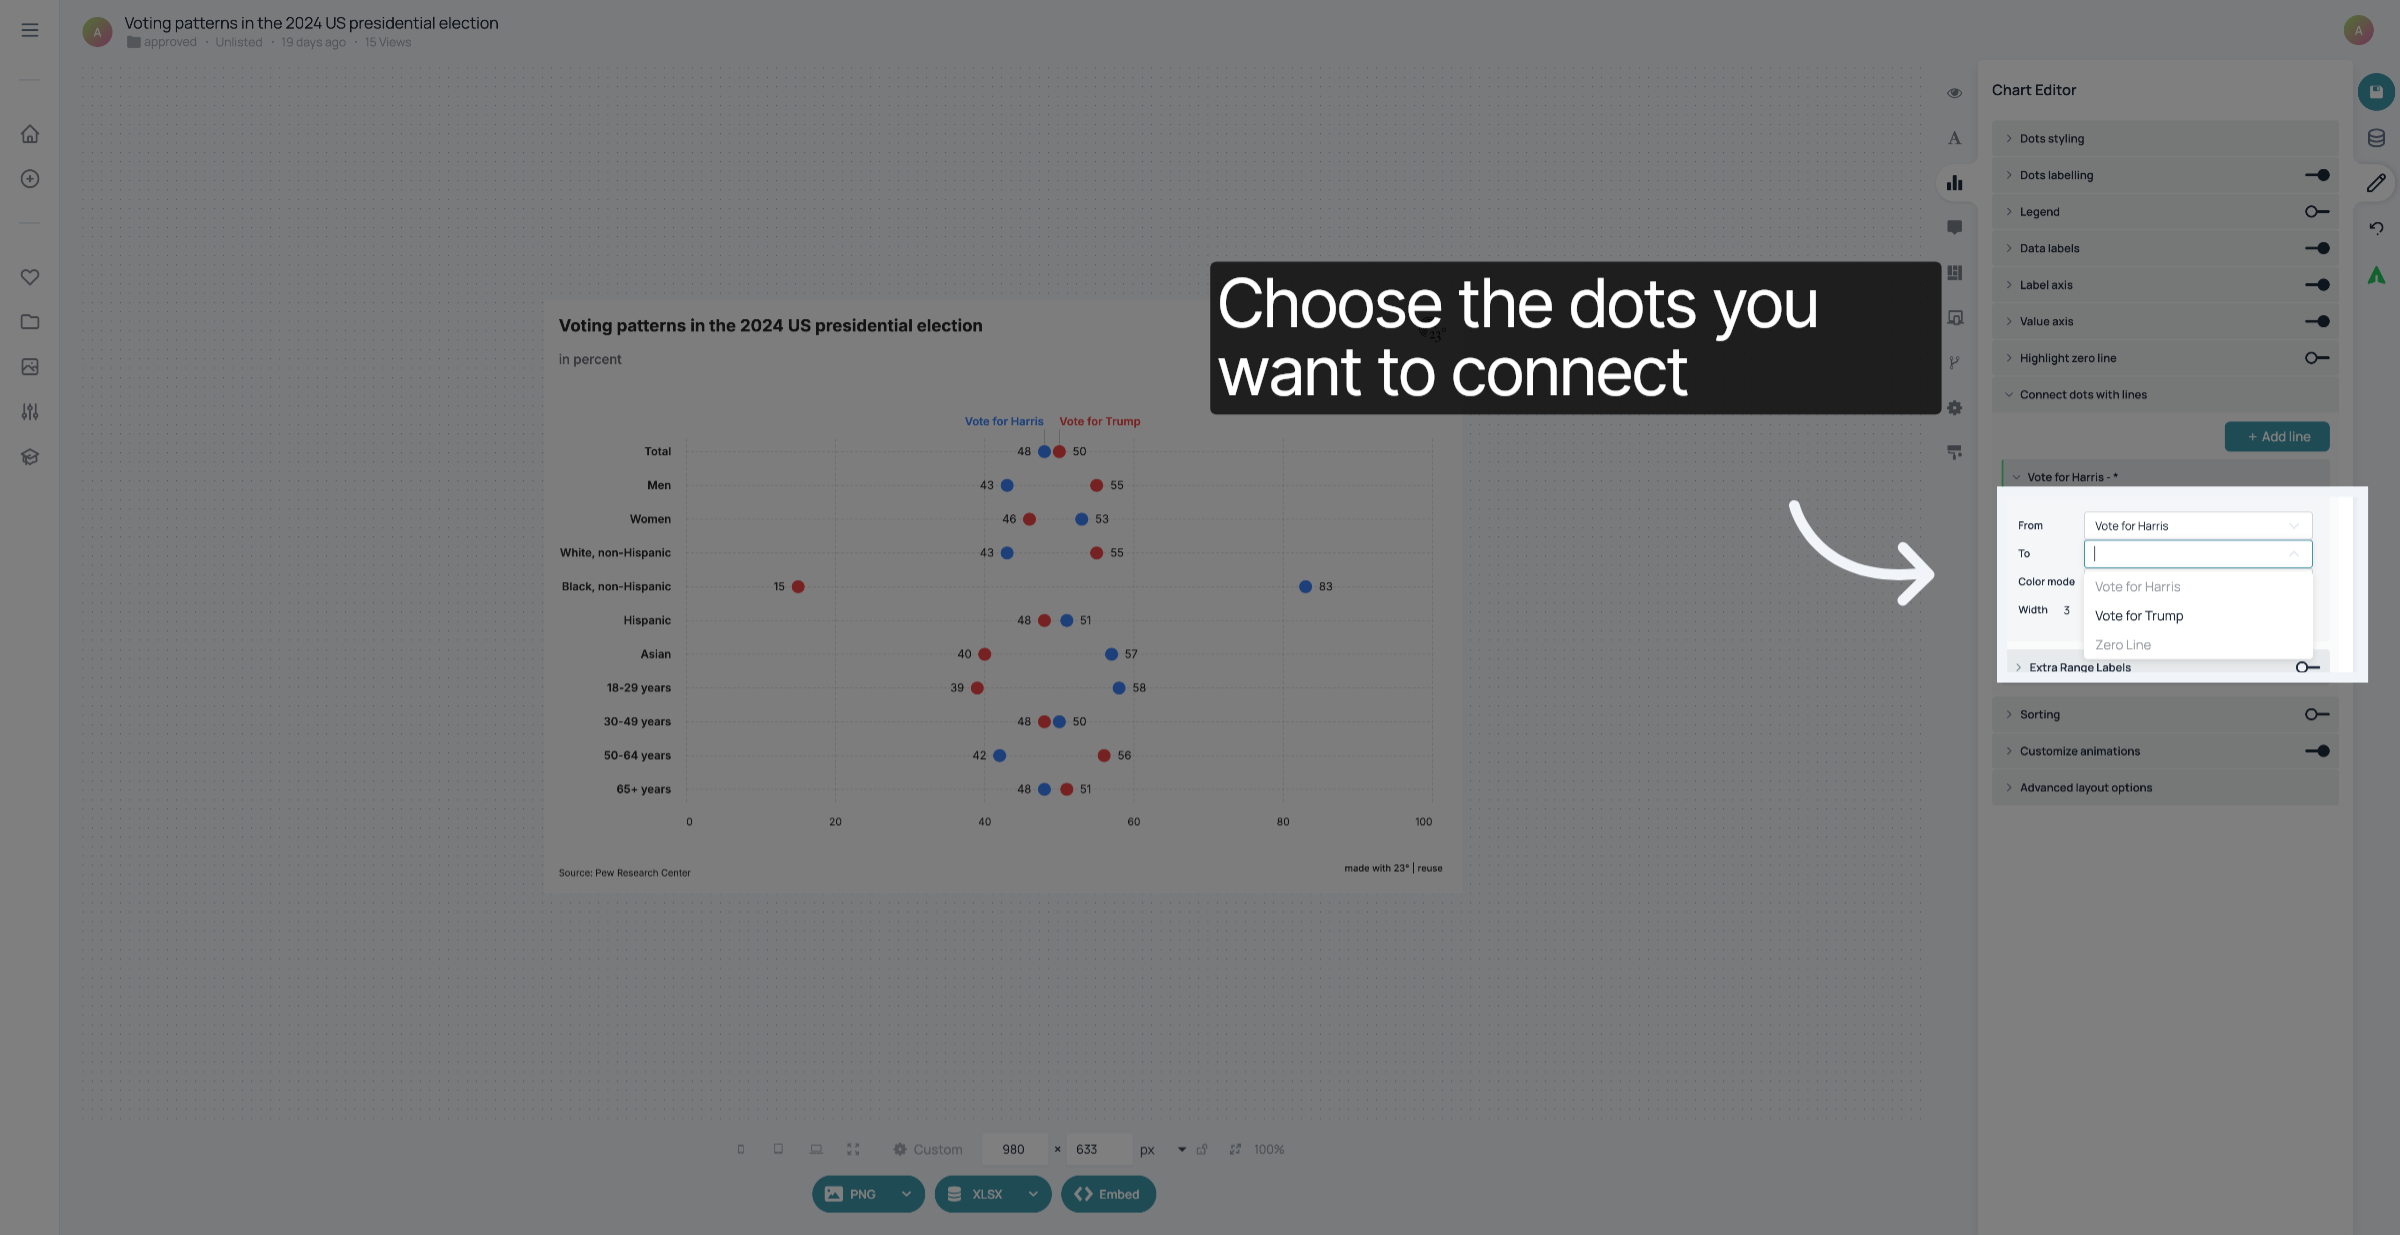
5. Choose dots you want to connect
Choose the categories of the two dots you want to connect
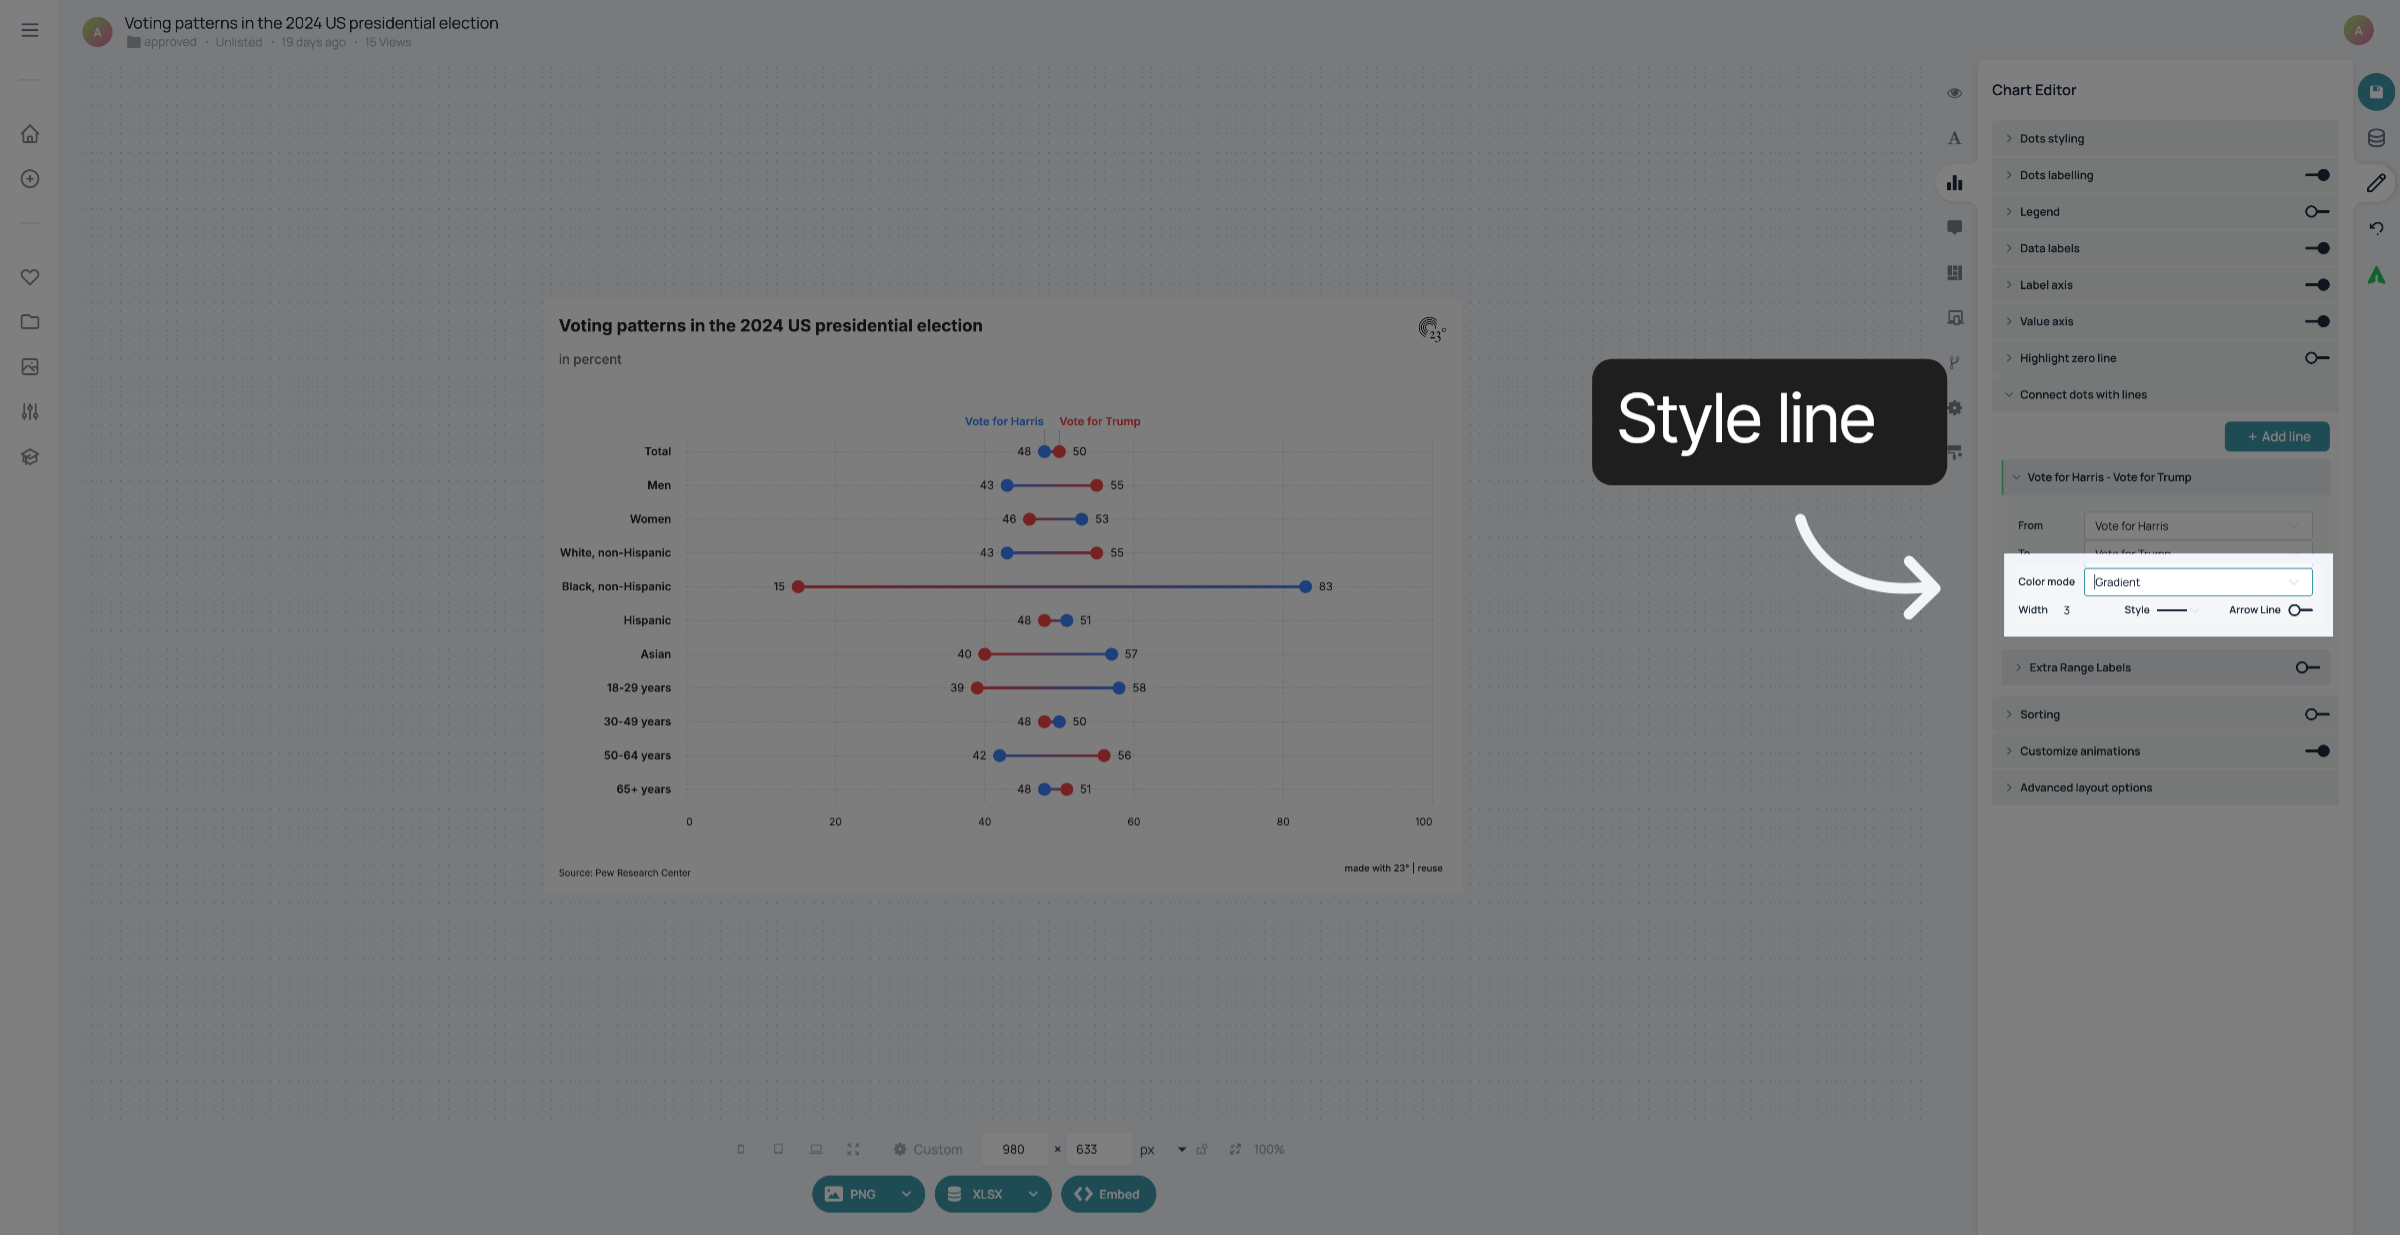
6. Style line
You can choose the colour, width and style of your connecting line here.
7. Save changes
Don't forget to save your changes
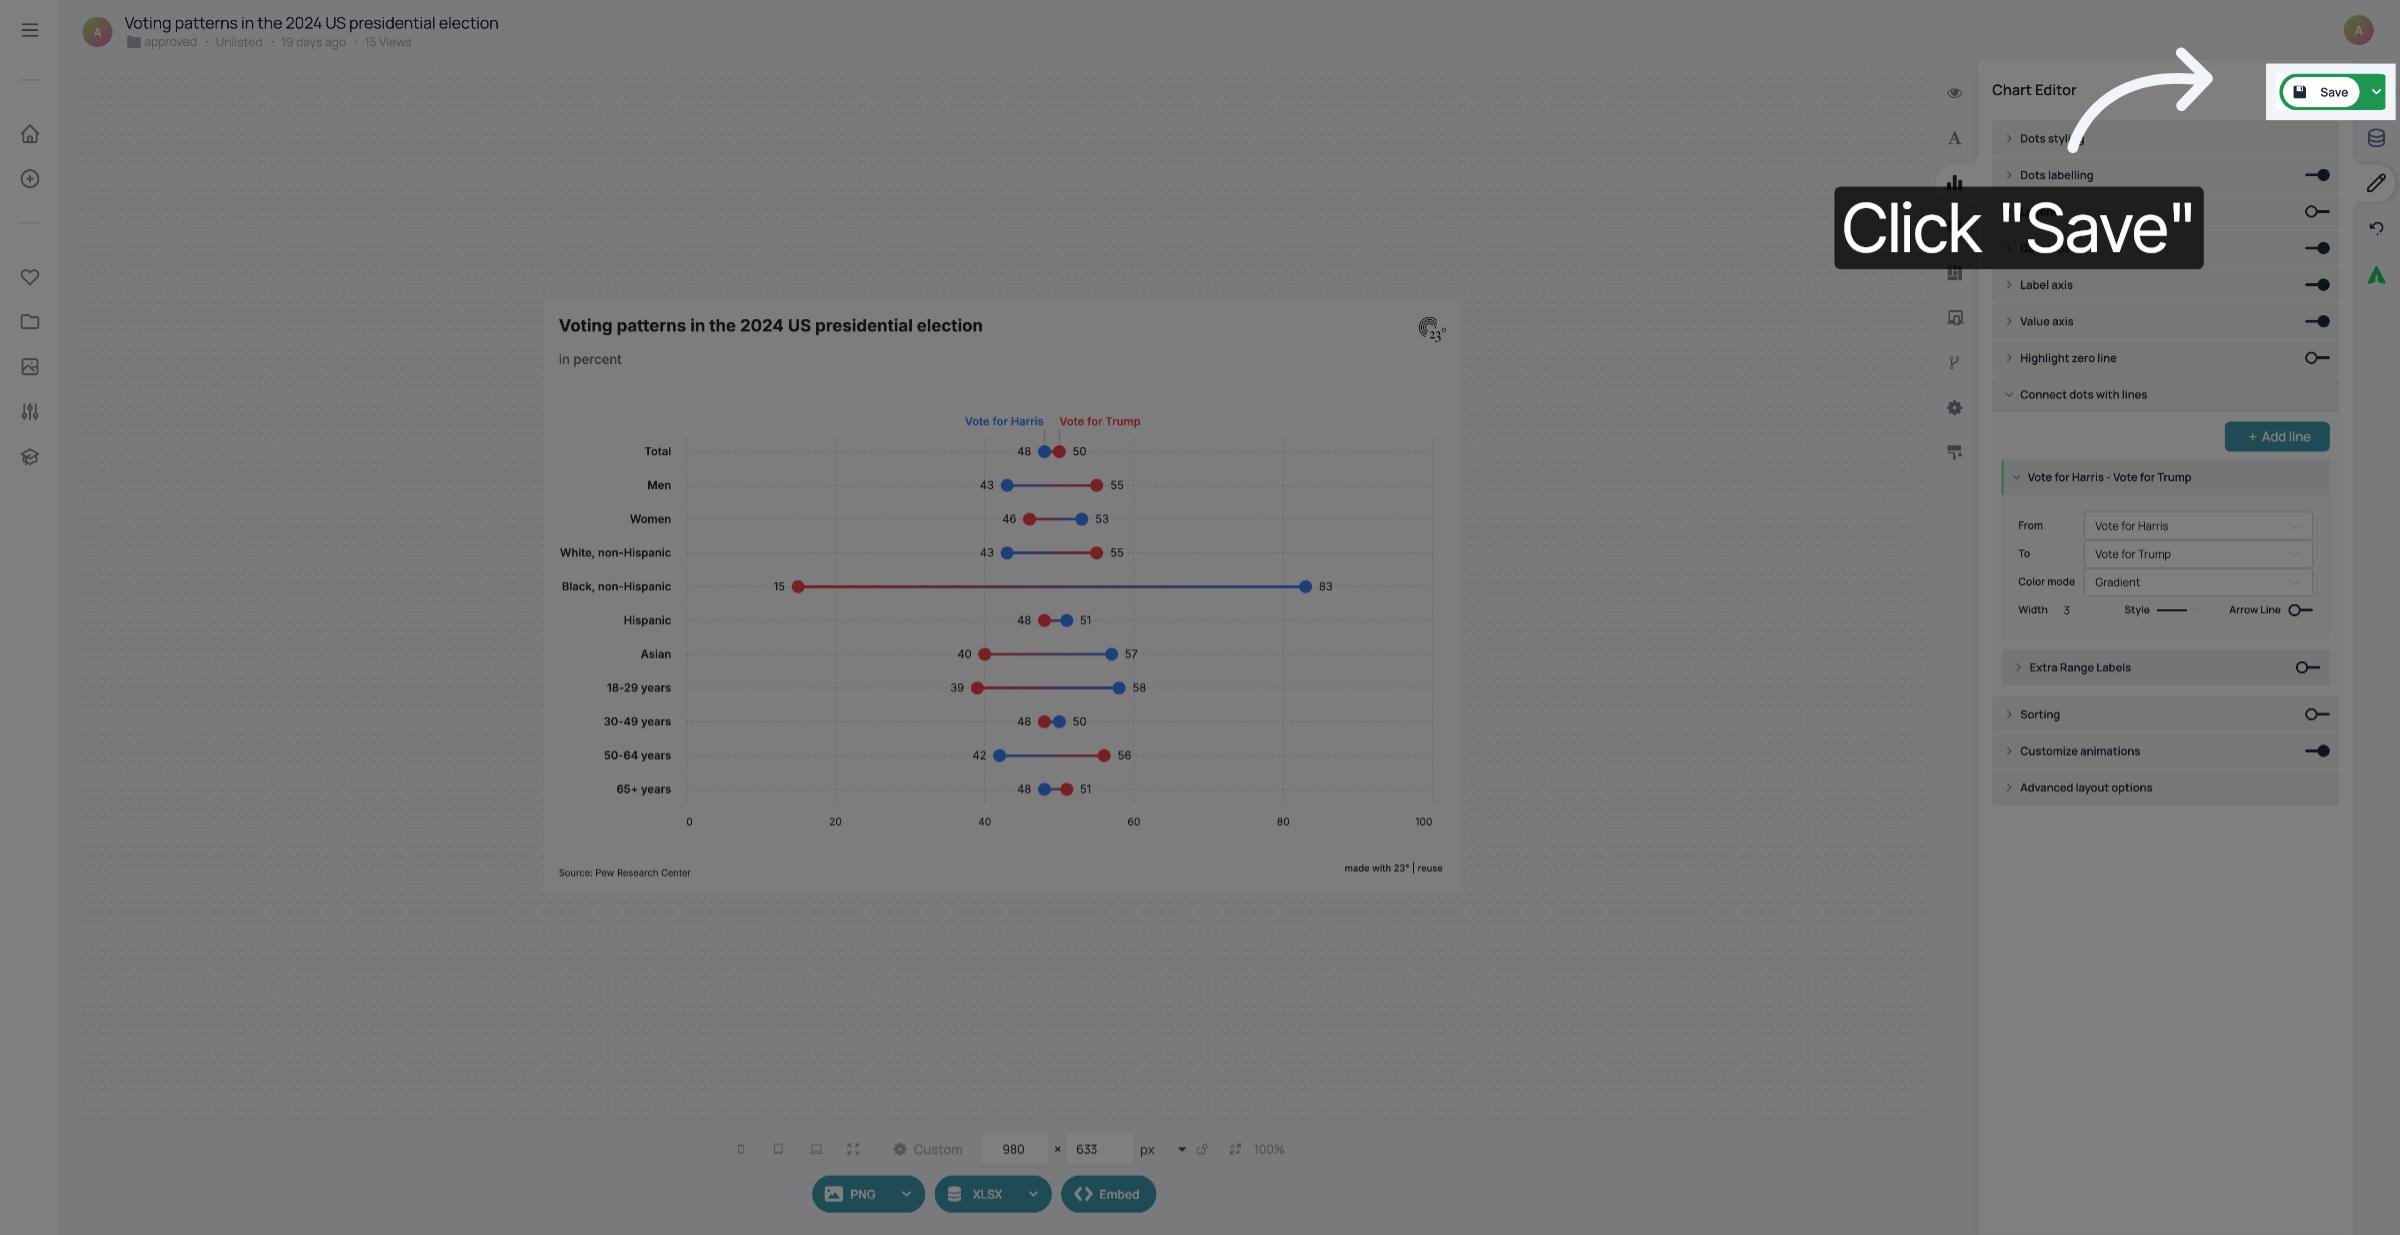
You have successfully styled the connecting line in your dot plot.