How to add custom lines to a value axis
This tutorial explains how to add custom lines to a value axis.
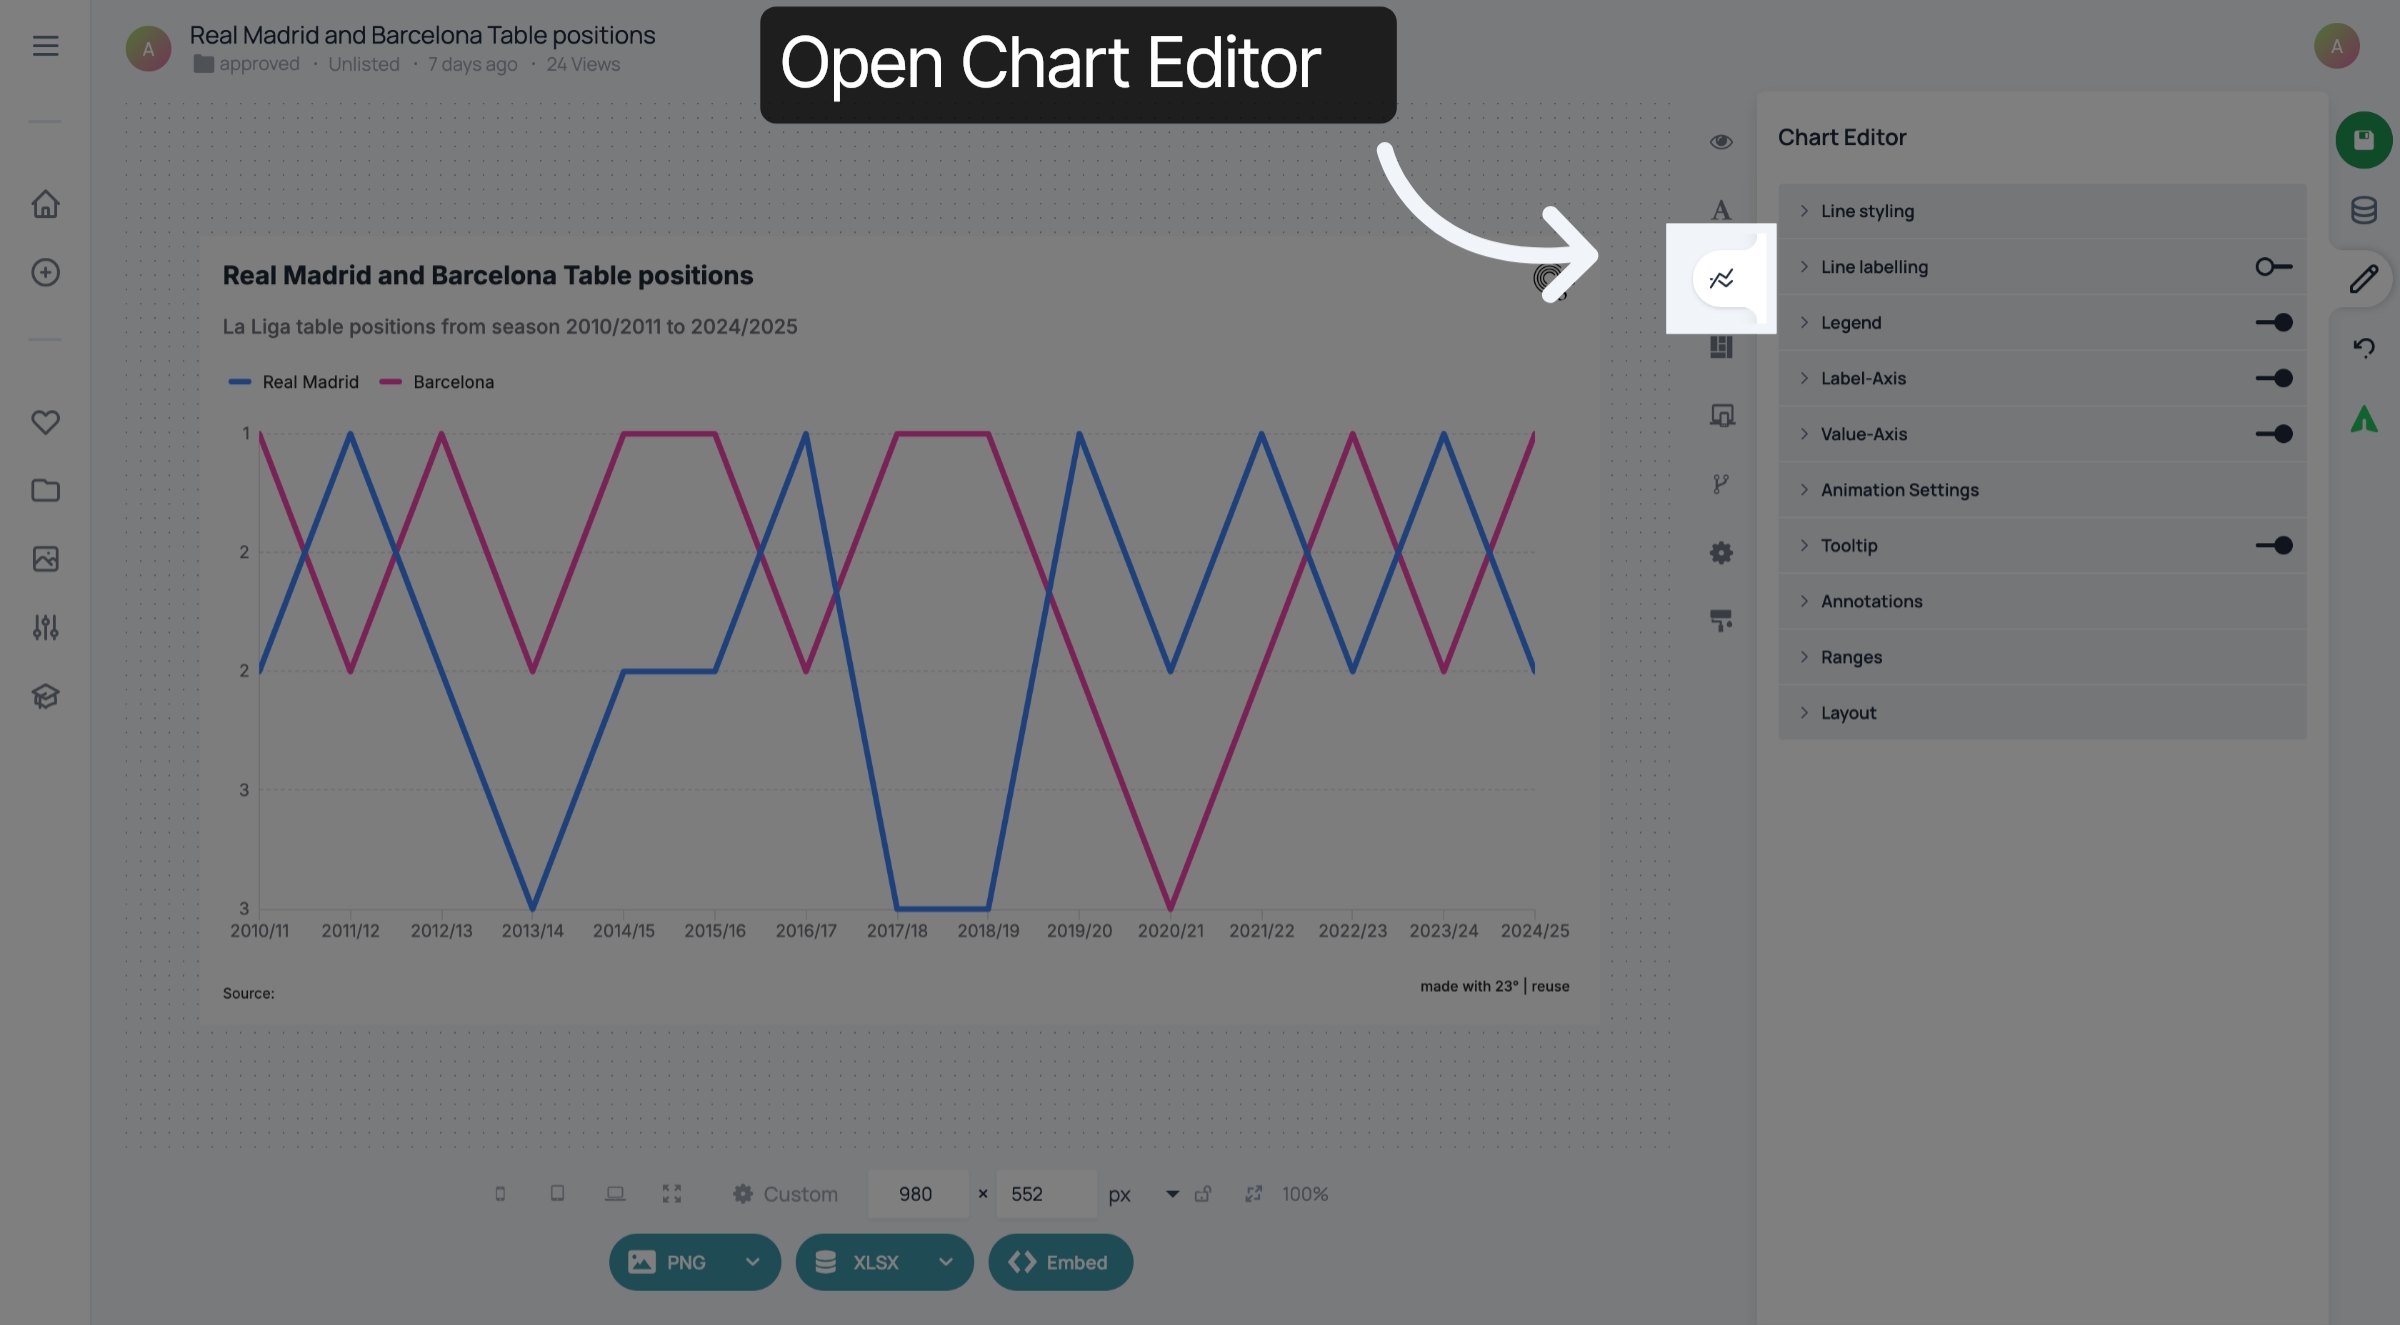
1. Open Chart Editor
Open your visualisation and go to the Chart settings.
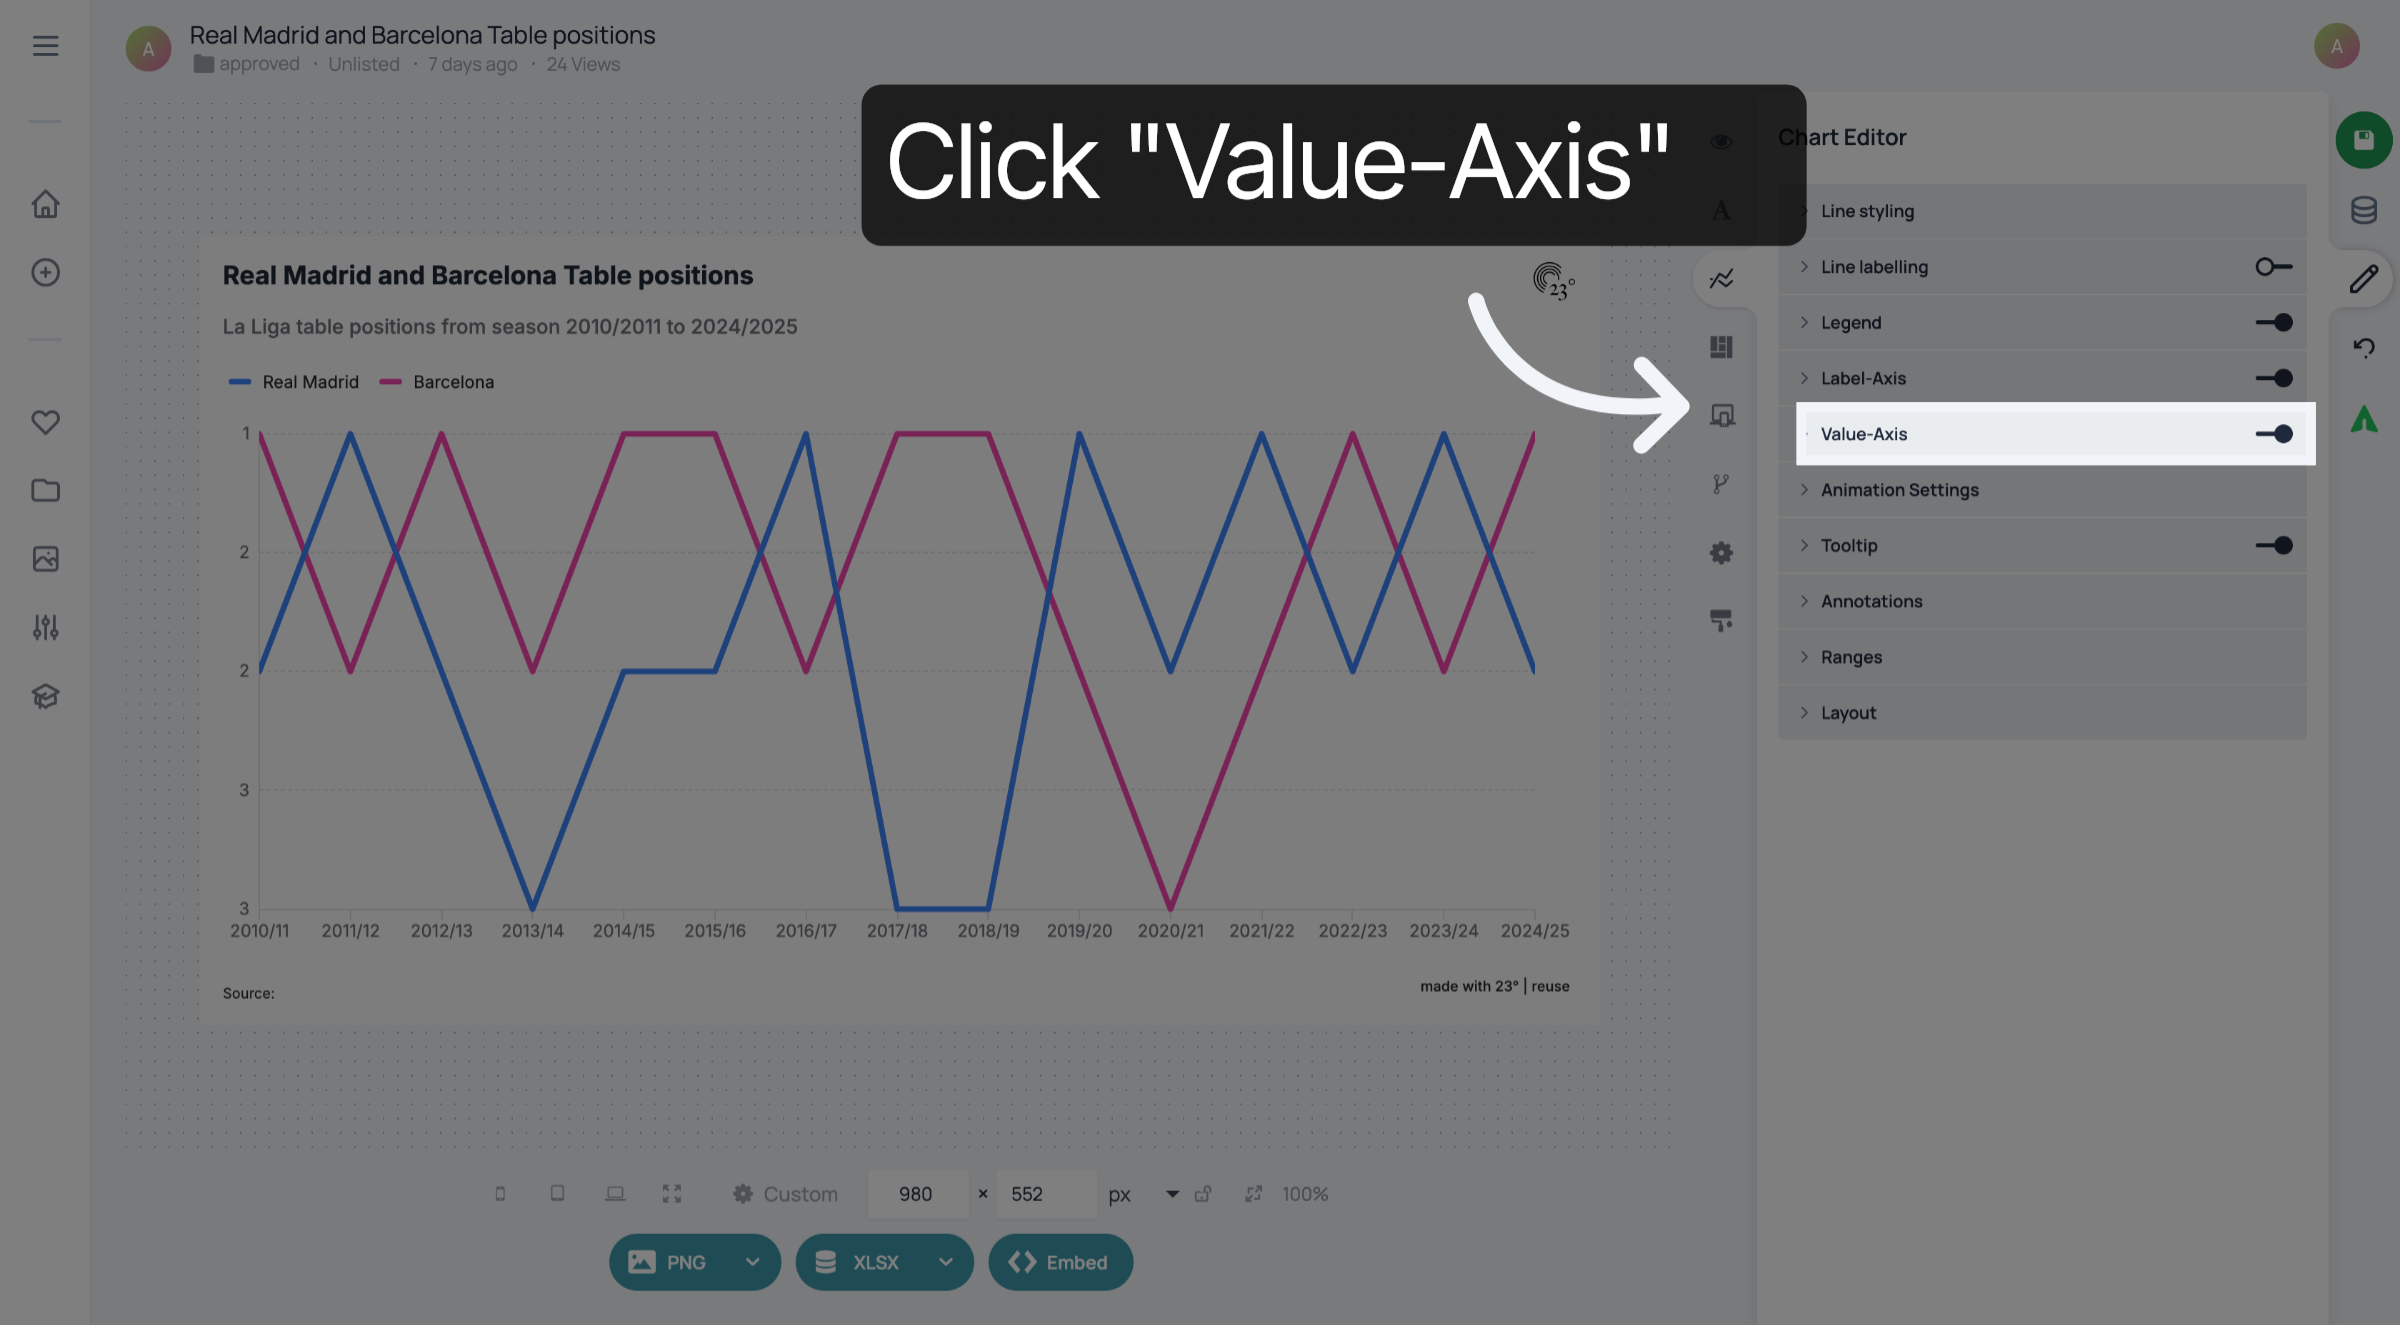
2. Click "Value Axis"
Click "Value Axis".
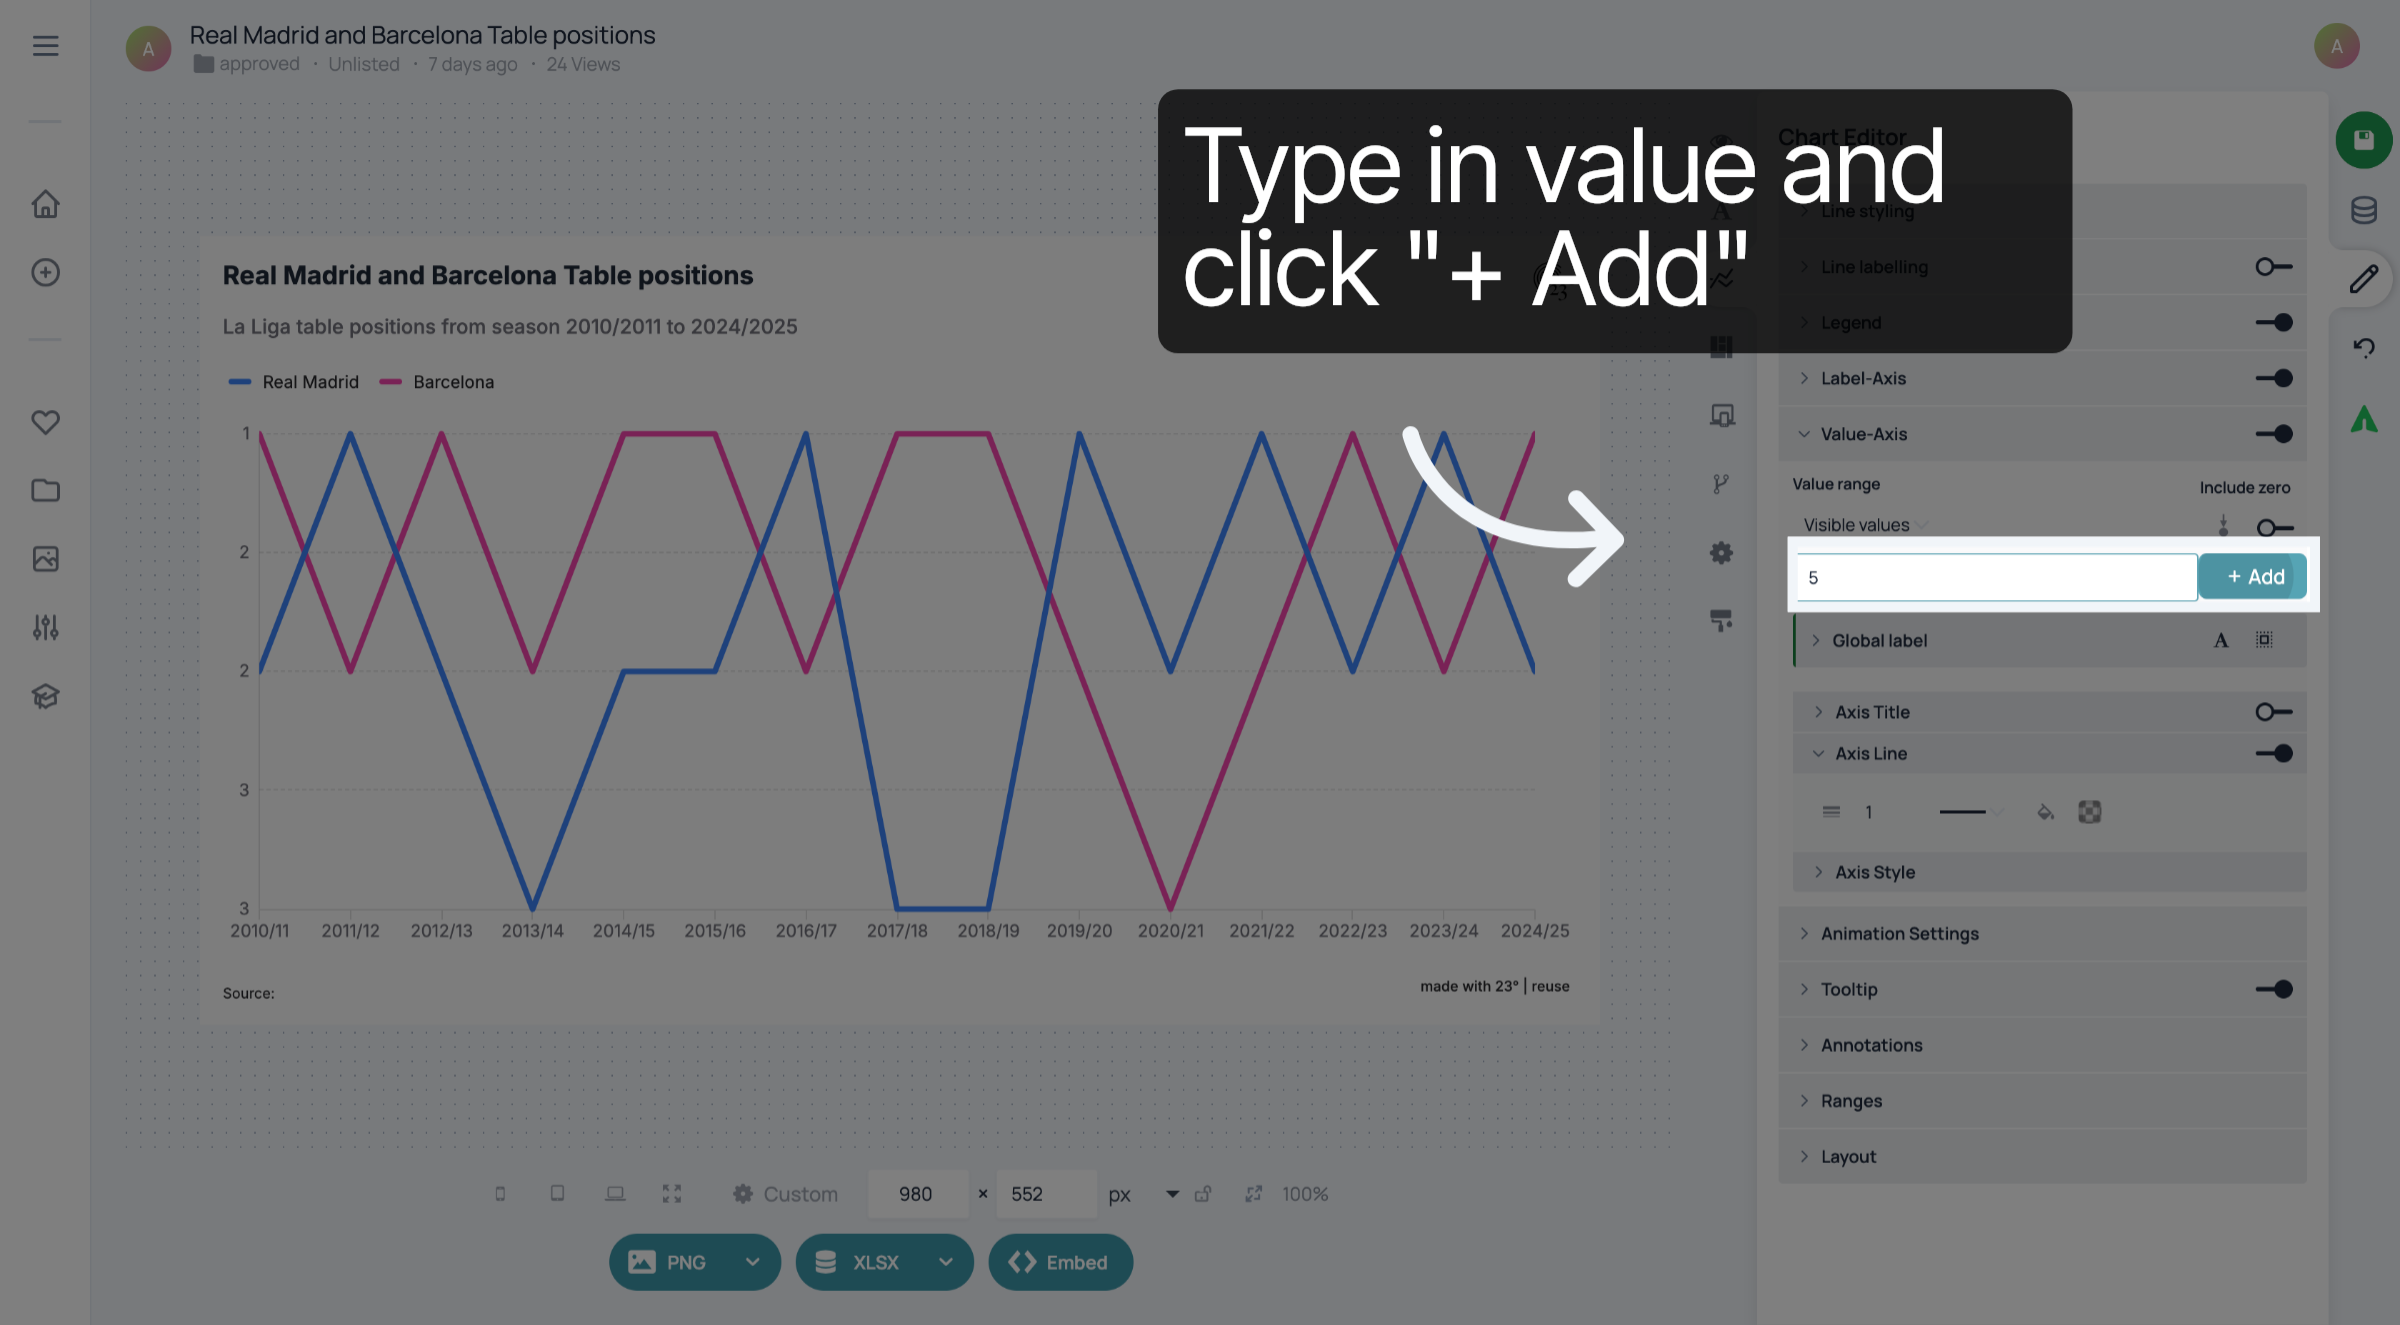
3. Add values
Type in a value you want to display on the value axis and click "+ Add".
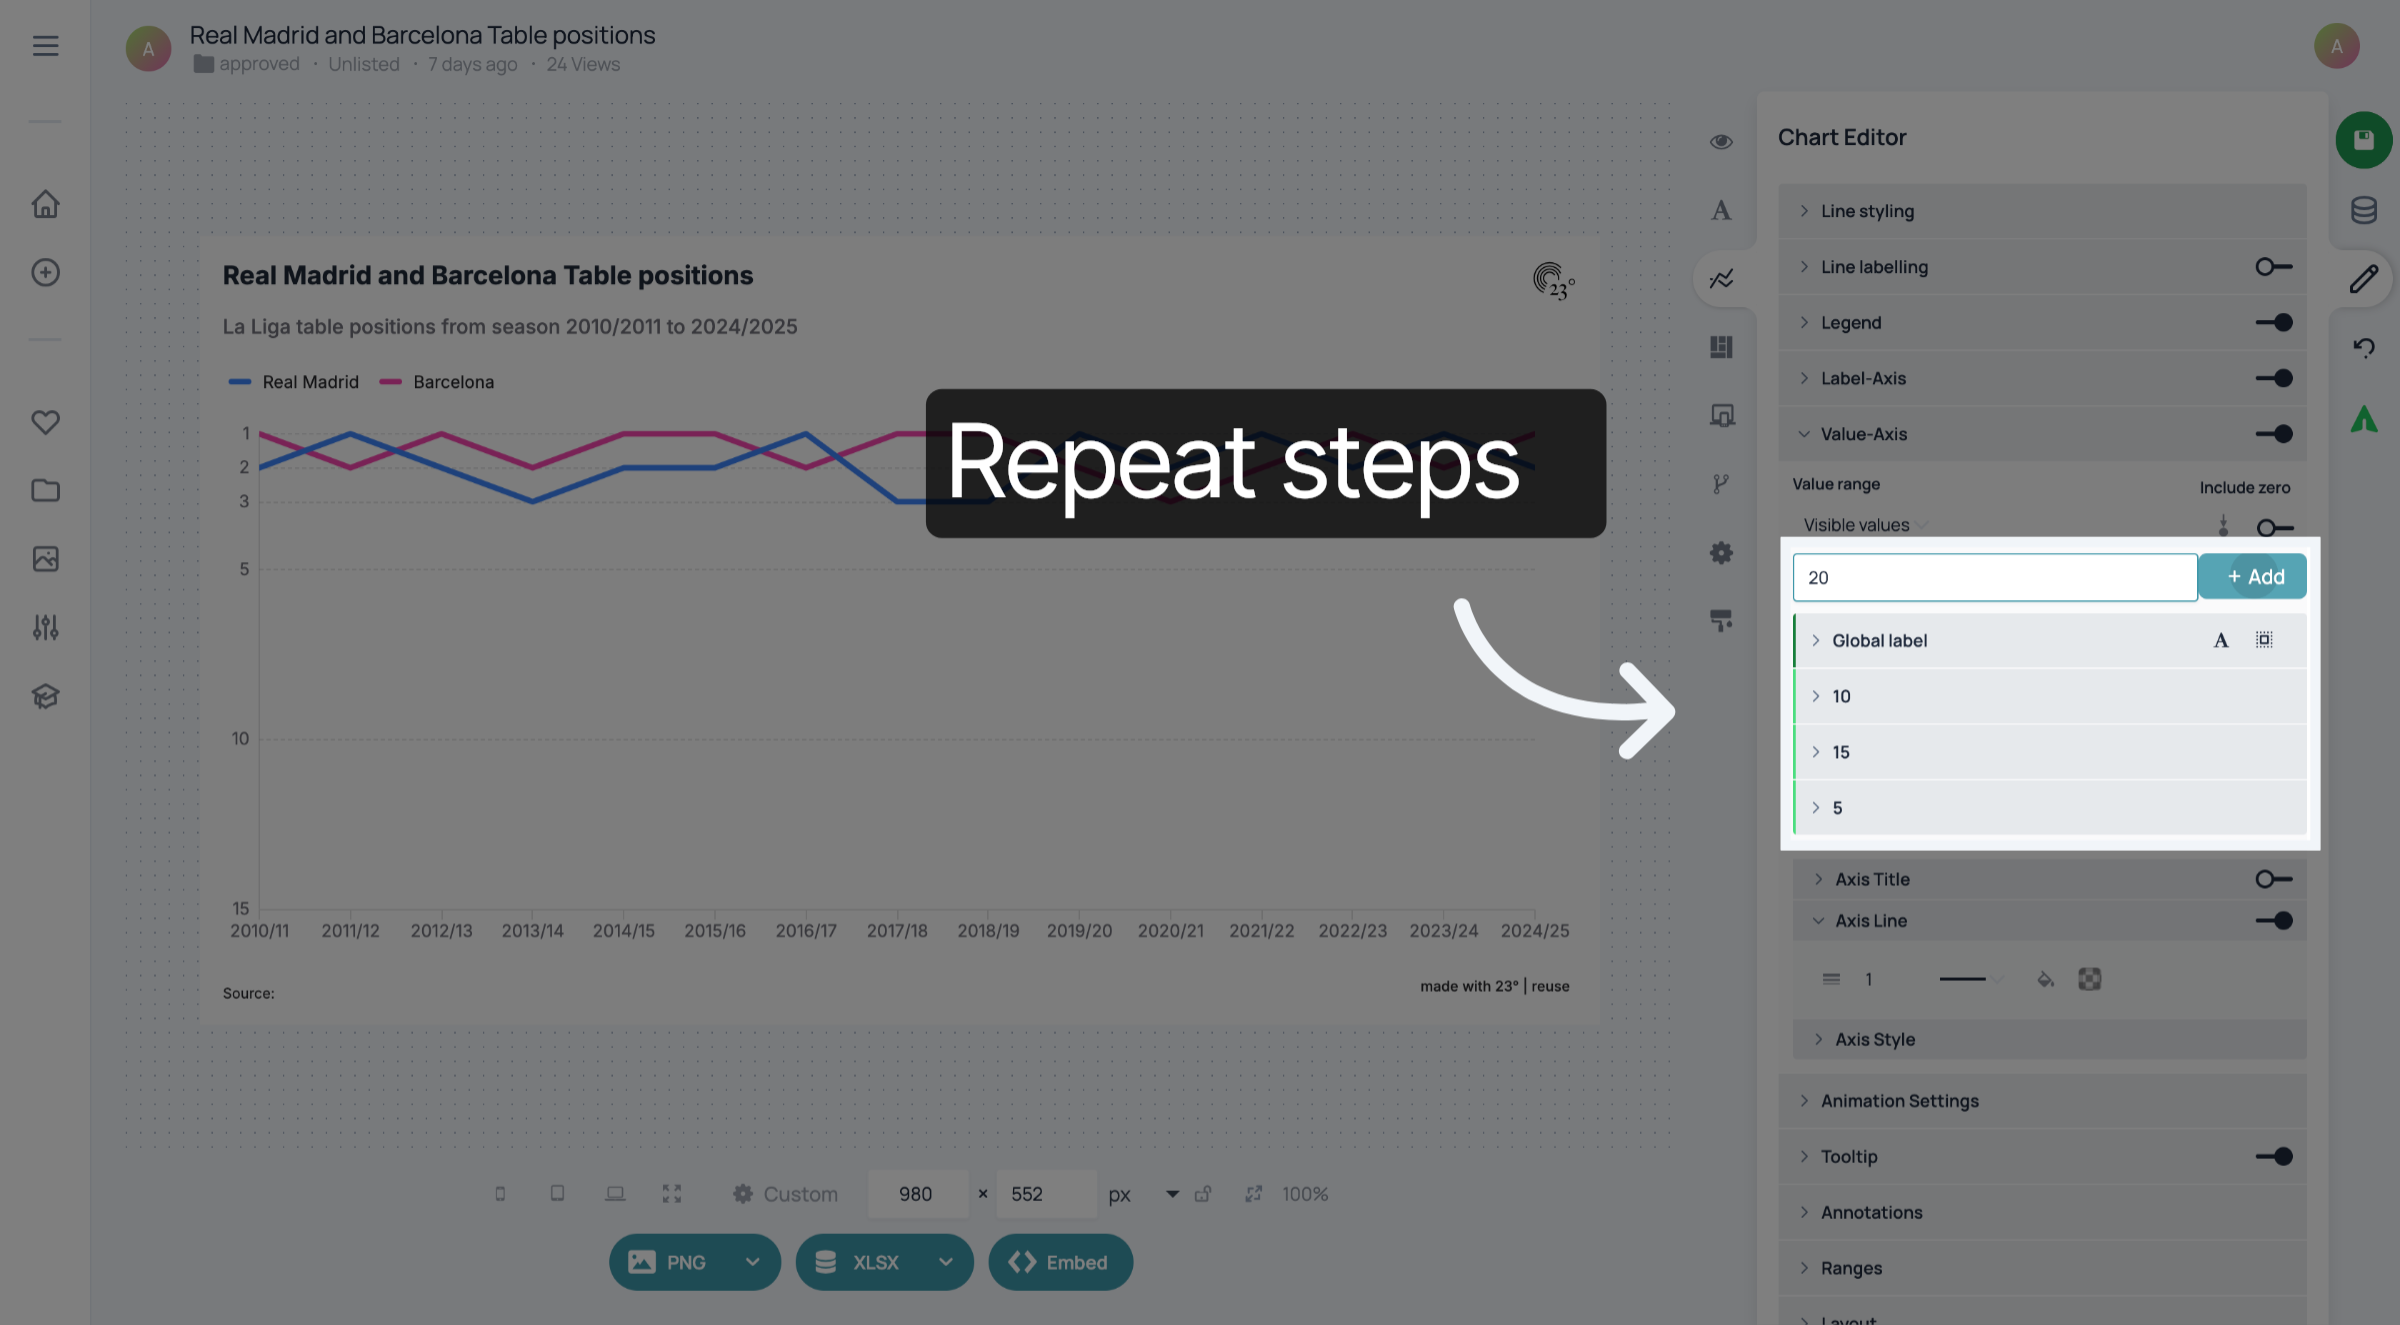
4. Repeat steps
Repeat for every custom line you want to add.
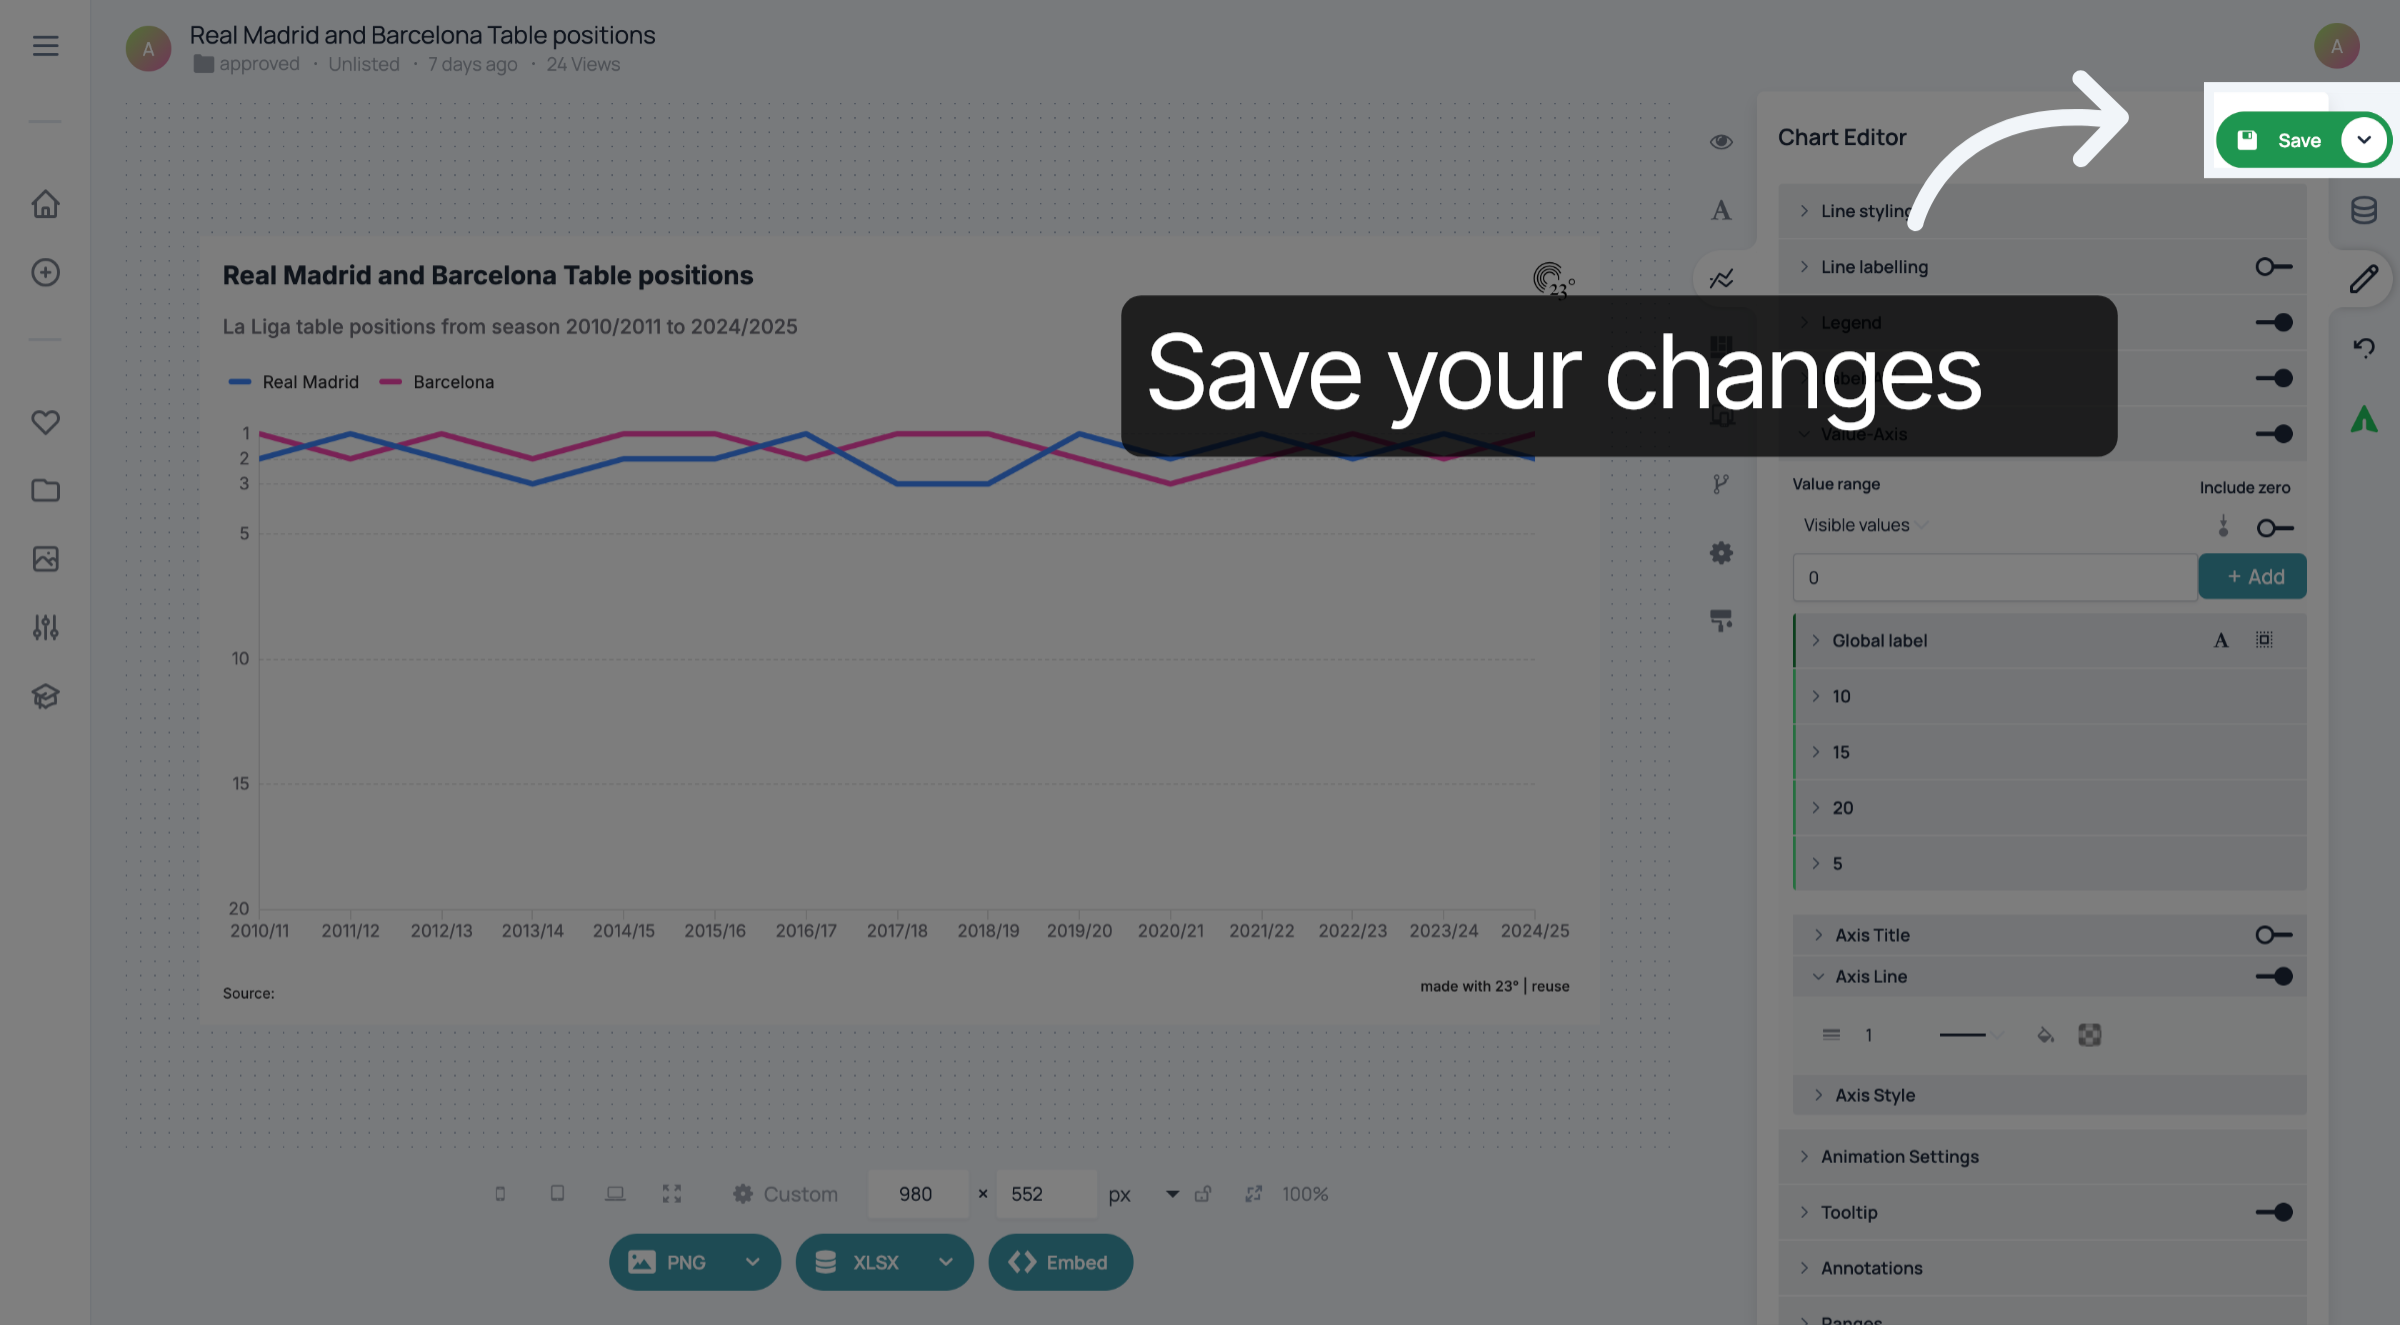
5. Save your changes
Don't forget to save your changes.
You have successfully added multiple custom lines to the value axis of your chart.