How to fill positive and negative areas between lines in a Line Chart
This tutorial shows how to fill positive and negative areas between two lines in a Line Chart.
1. Open Chart Editor
Open Chart Editor

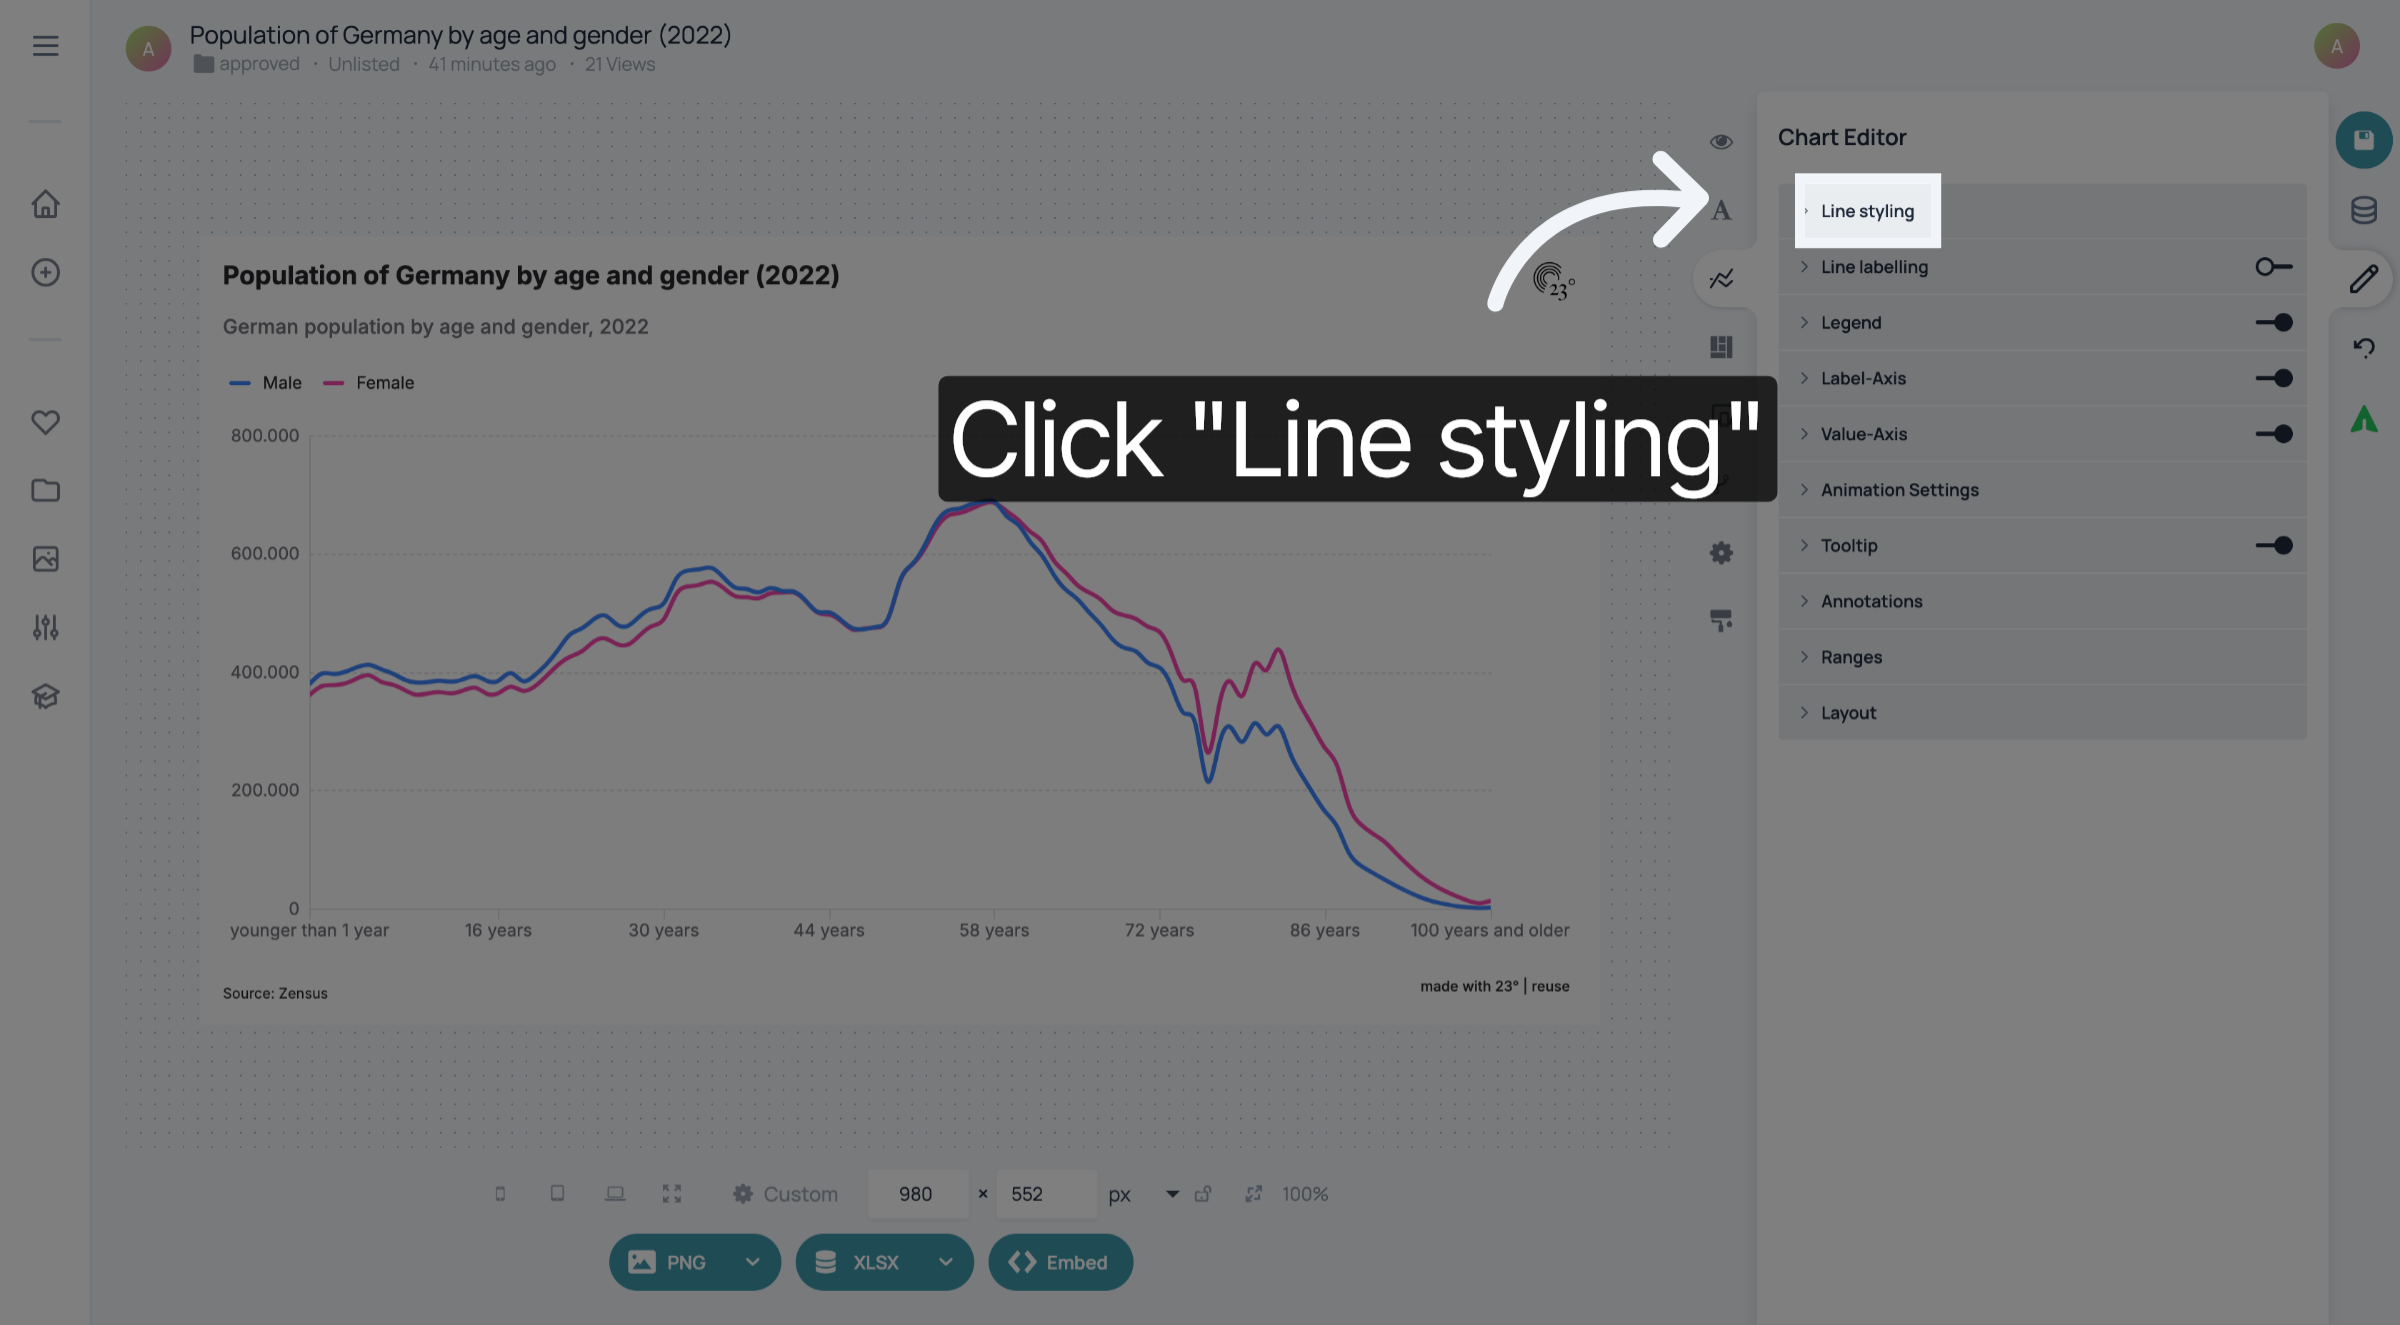
2. Click "Line Styling"
Click "Line styling".
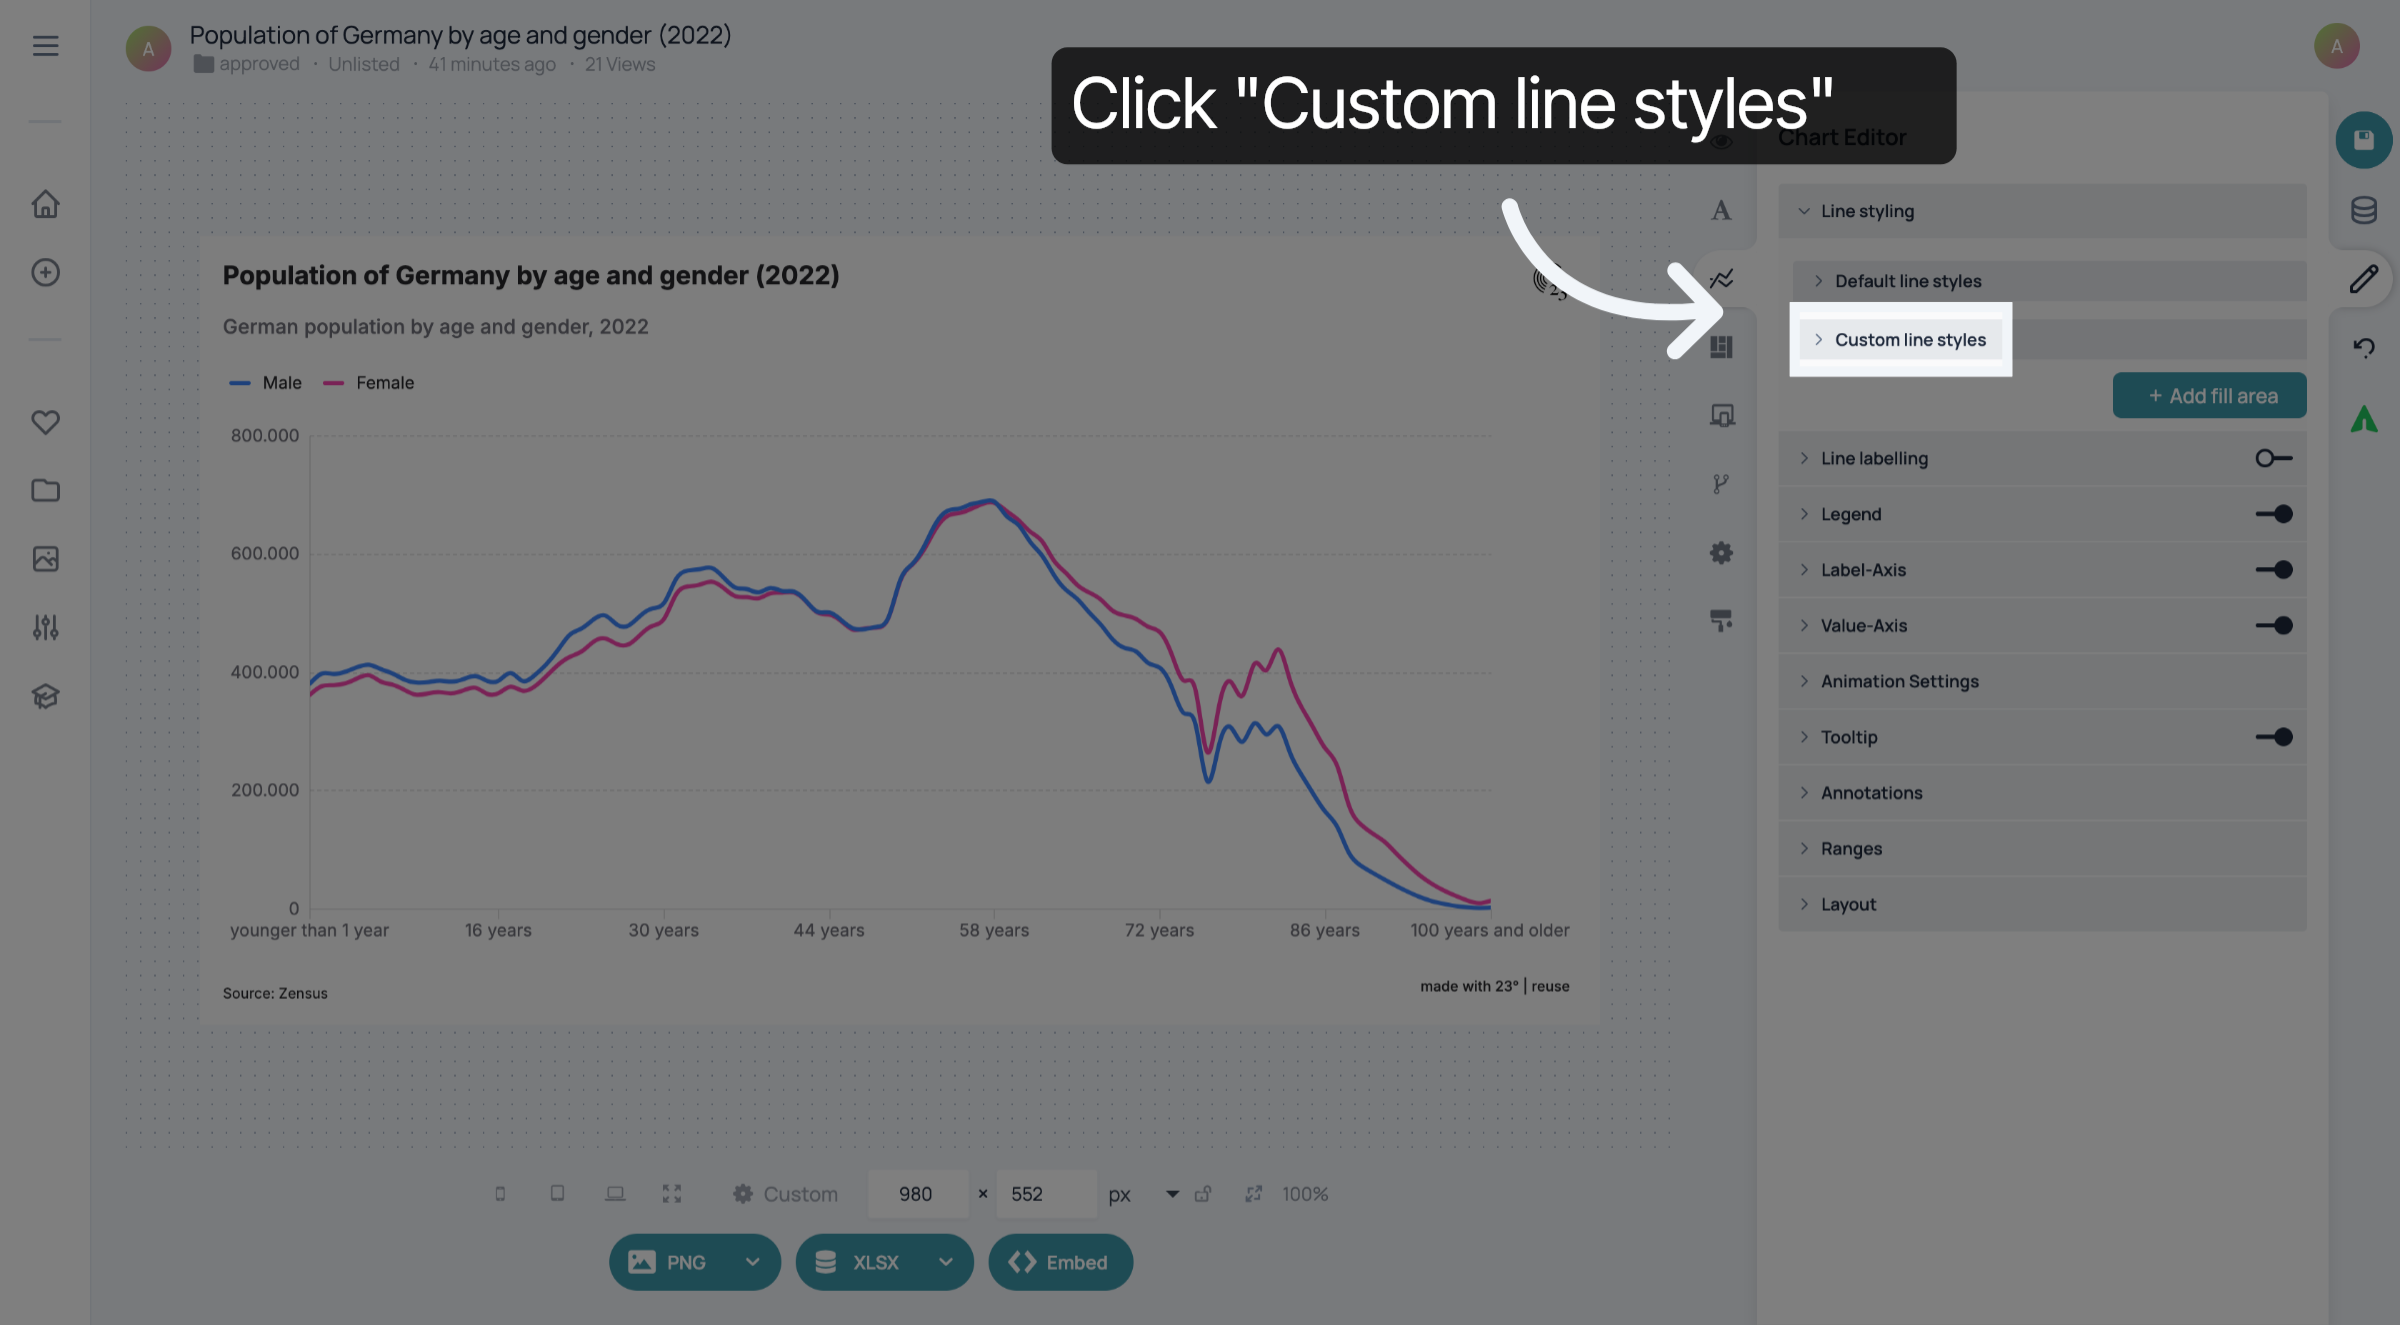
3. Open "Custom line styles"
Click "Custom line styles".
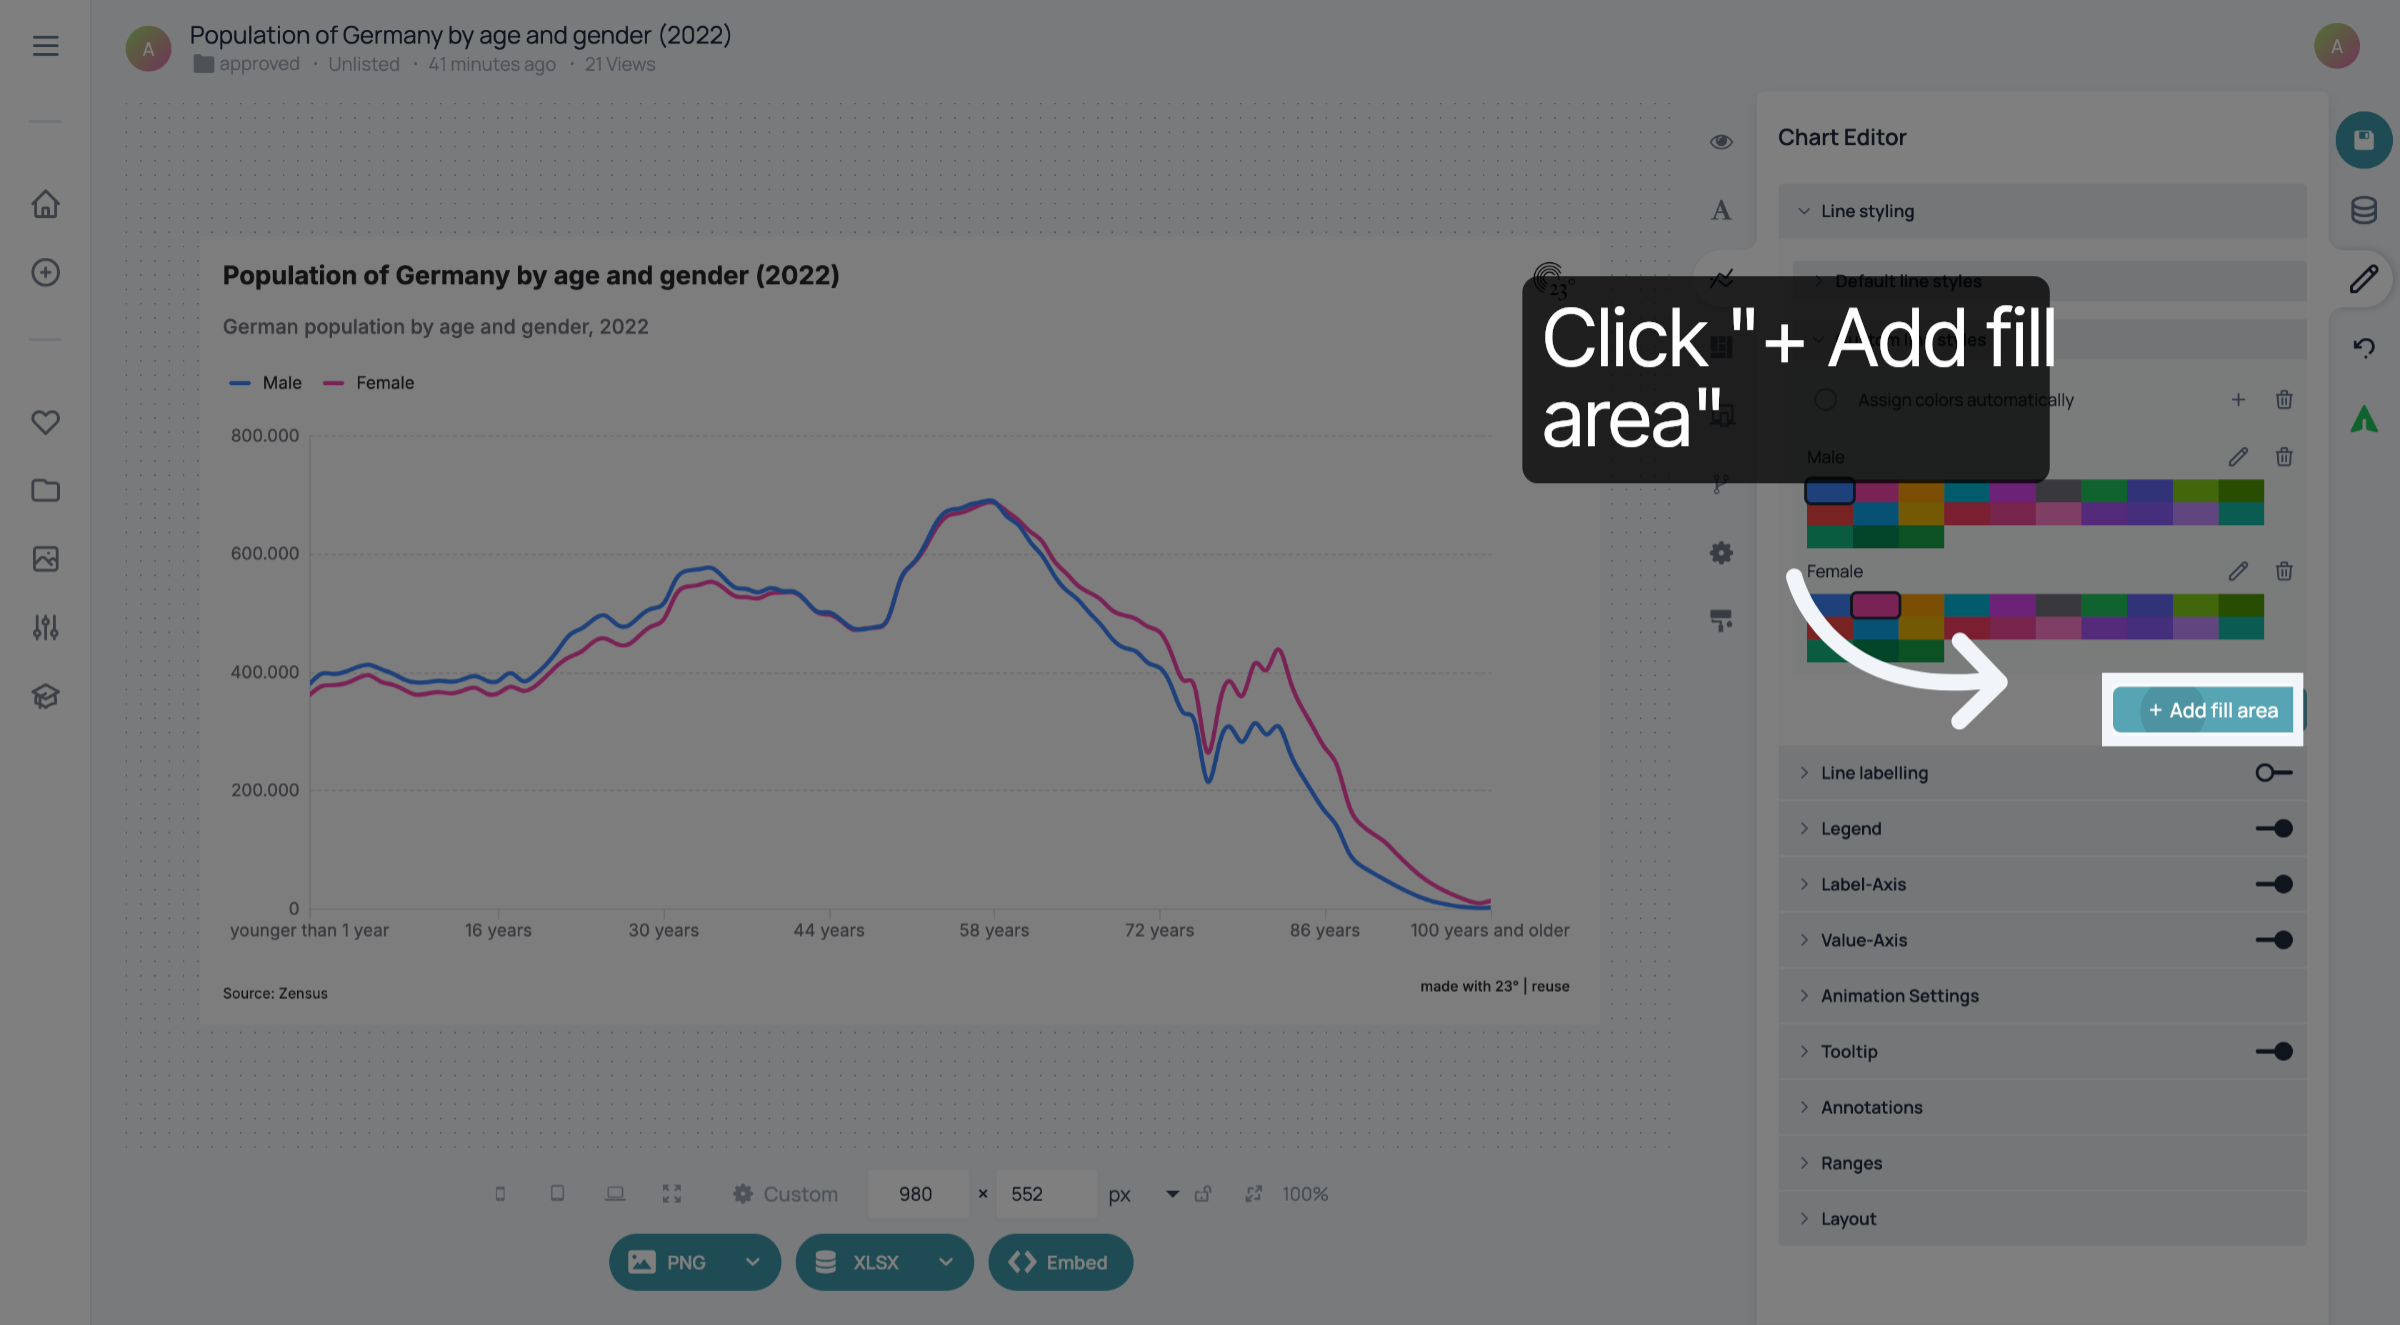
4. Add Fill Area
Click "+ Add fill area".
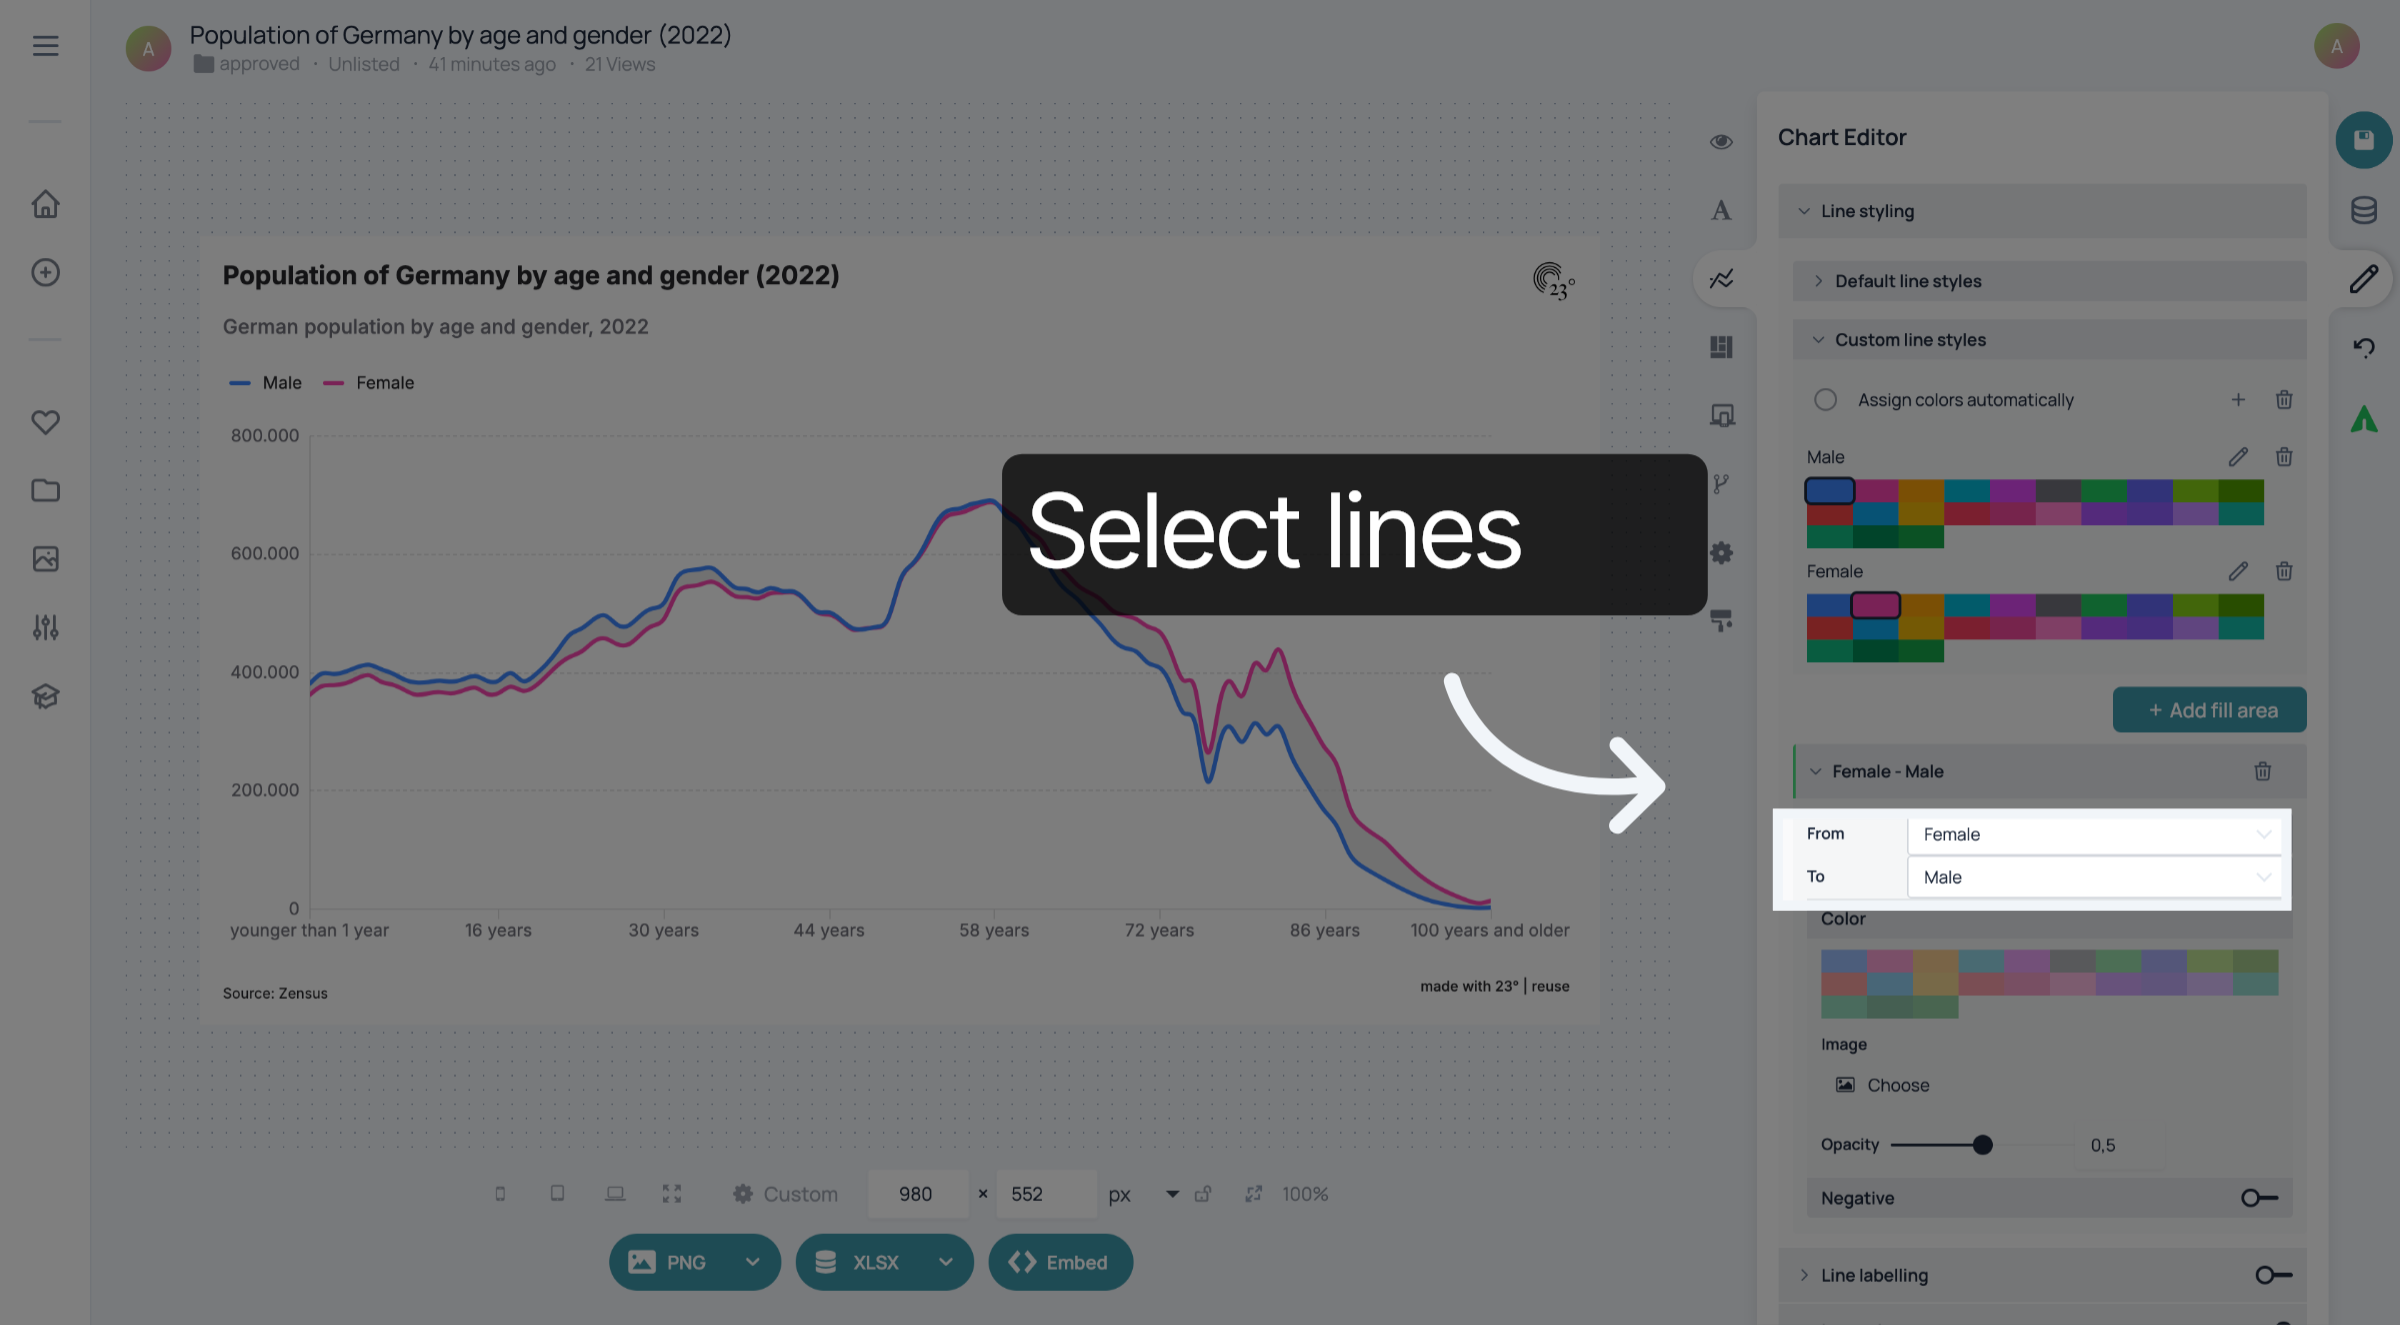
5. Select lines
Select the two lines between which you want to fill the area.
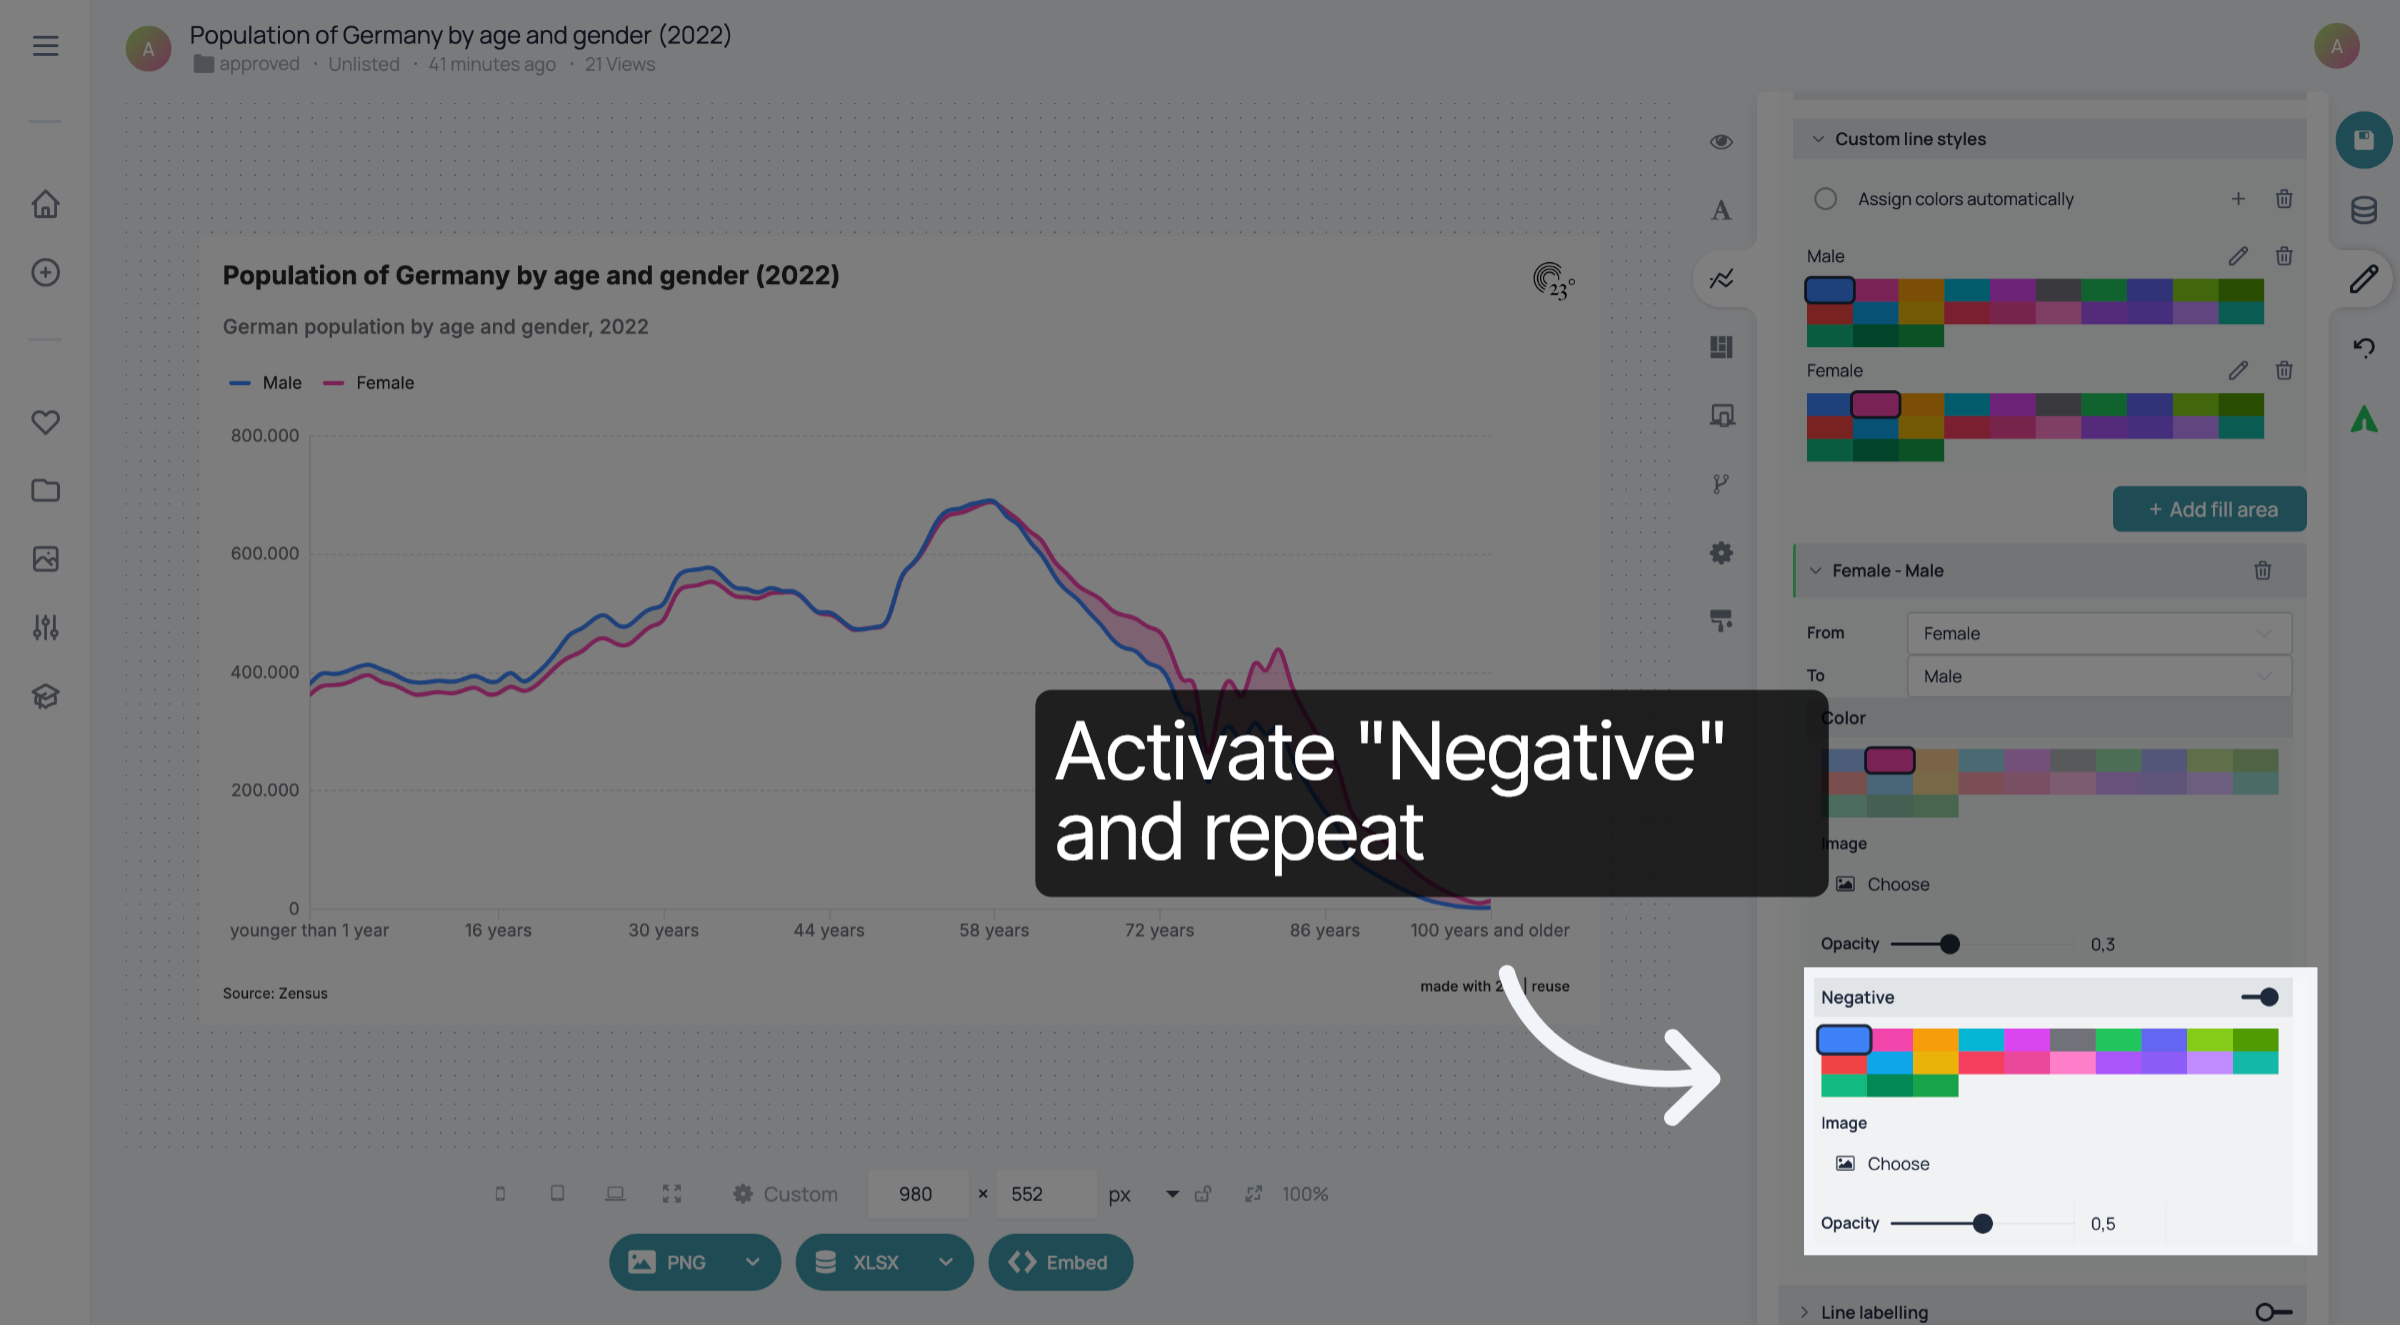
6. Add colour for negative
To add a different colour depending on which line has the higher value, activate "Negative" and choose a colour and opacity.
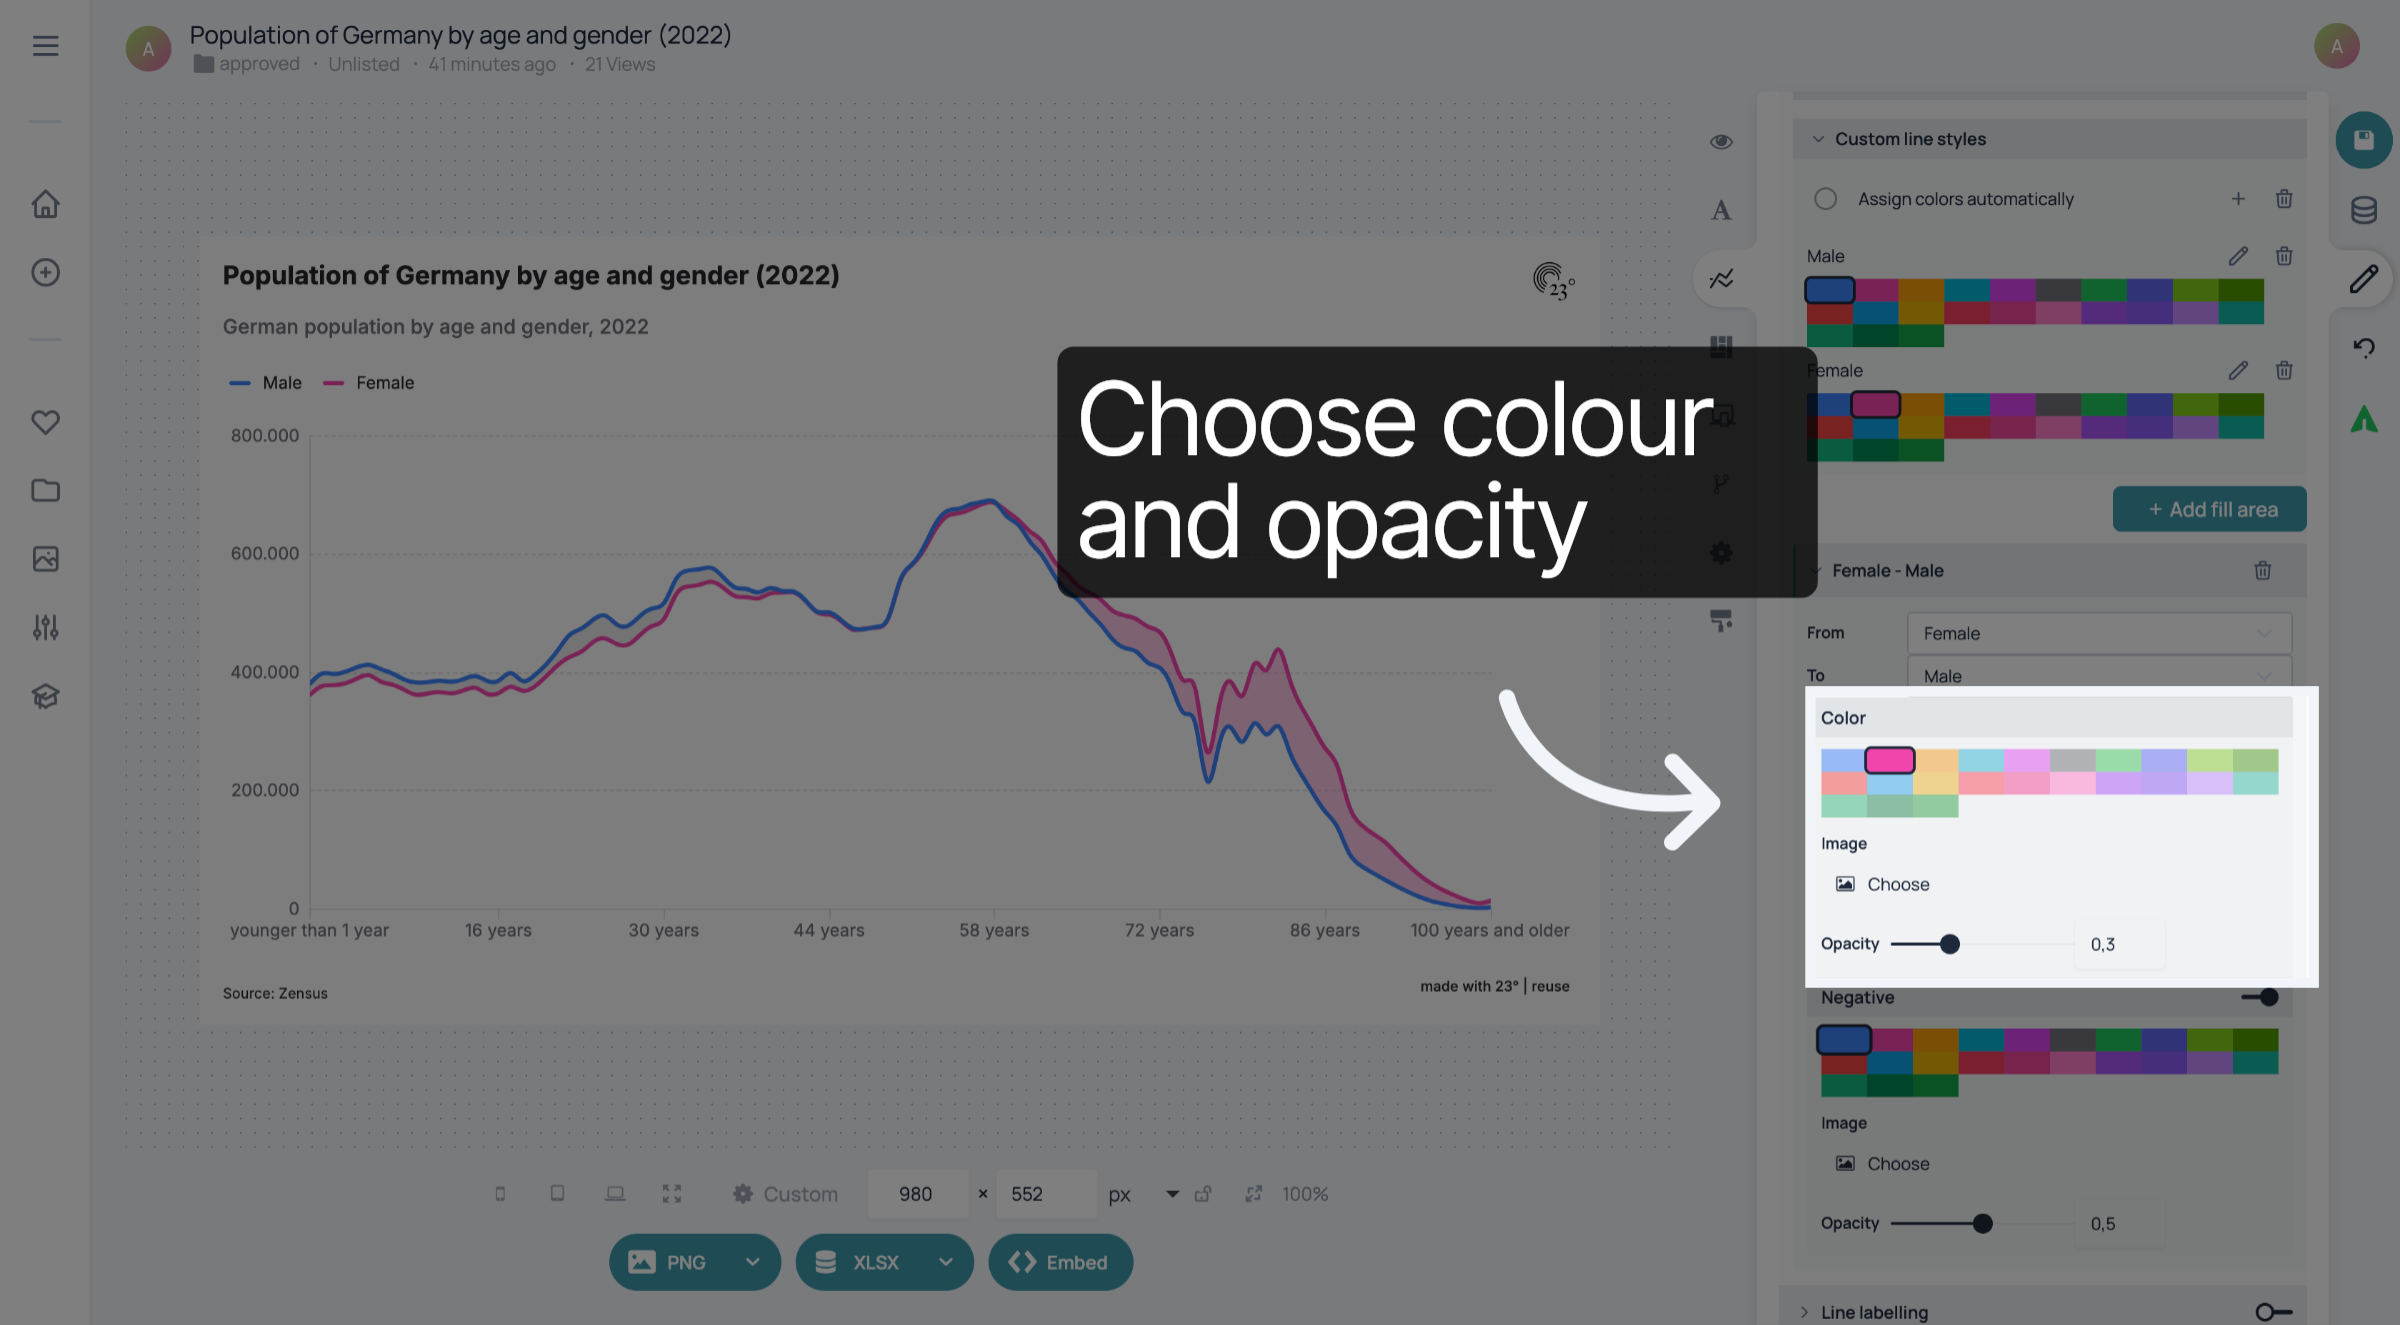
7. Add colour for negative
To add a different colour depending on which line has the higher value, activate "Negative" and choose a colour and opacity.
8. Save your changes
Don't forget to save your changes.
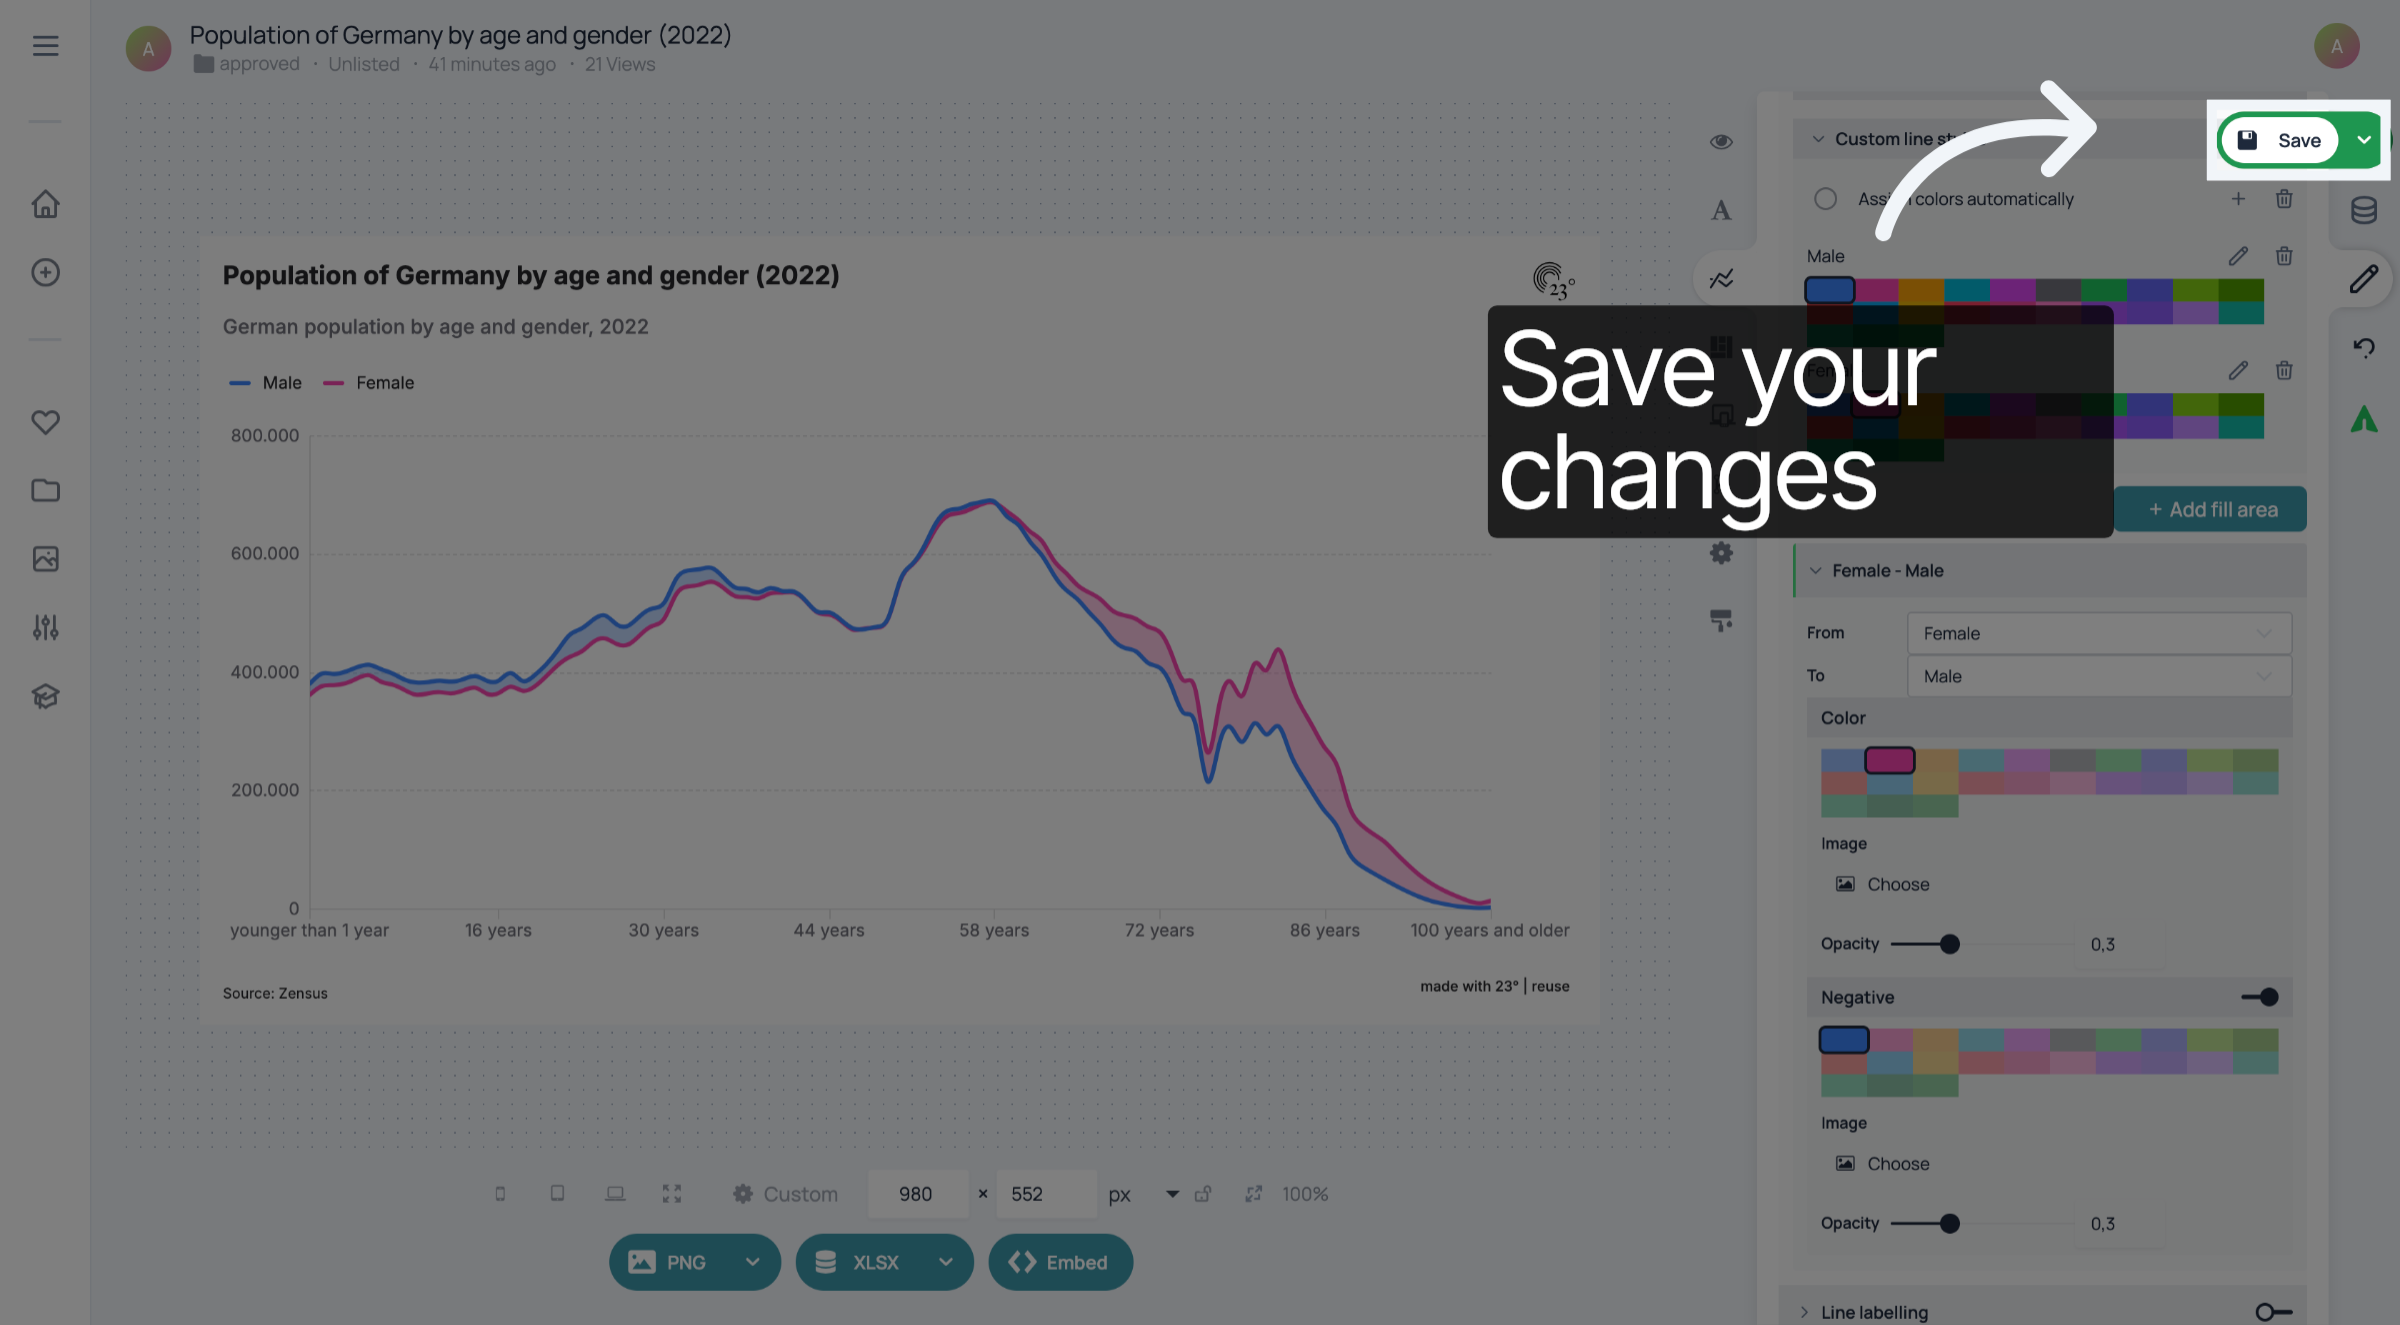
You have successfully filled the area between two lines in your linechart.