Add Images to Bar Charts in 23degrees
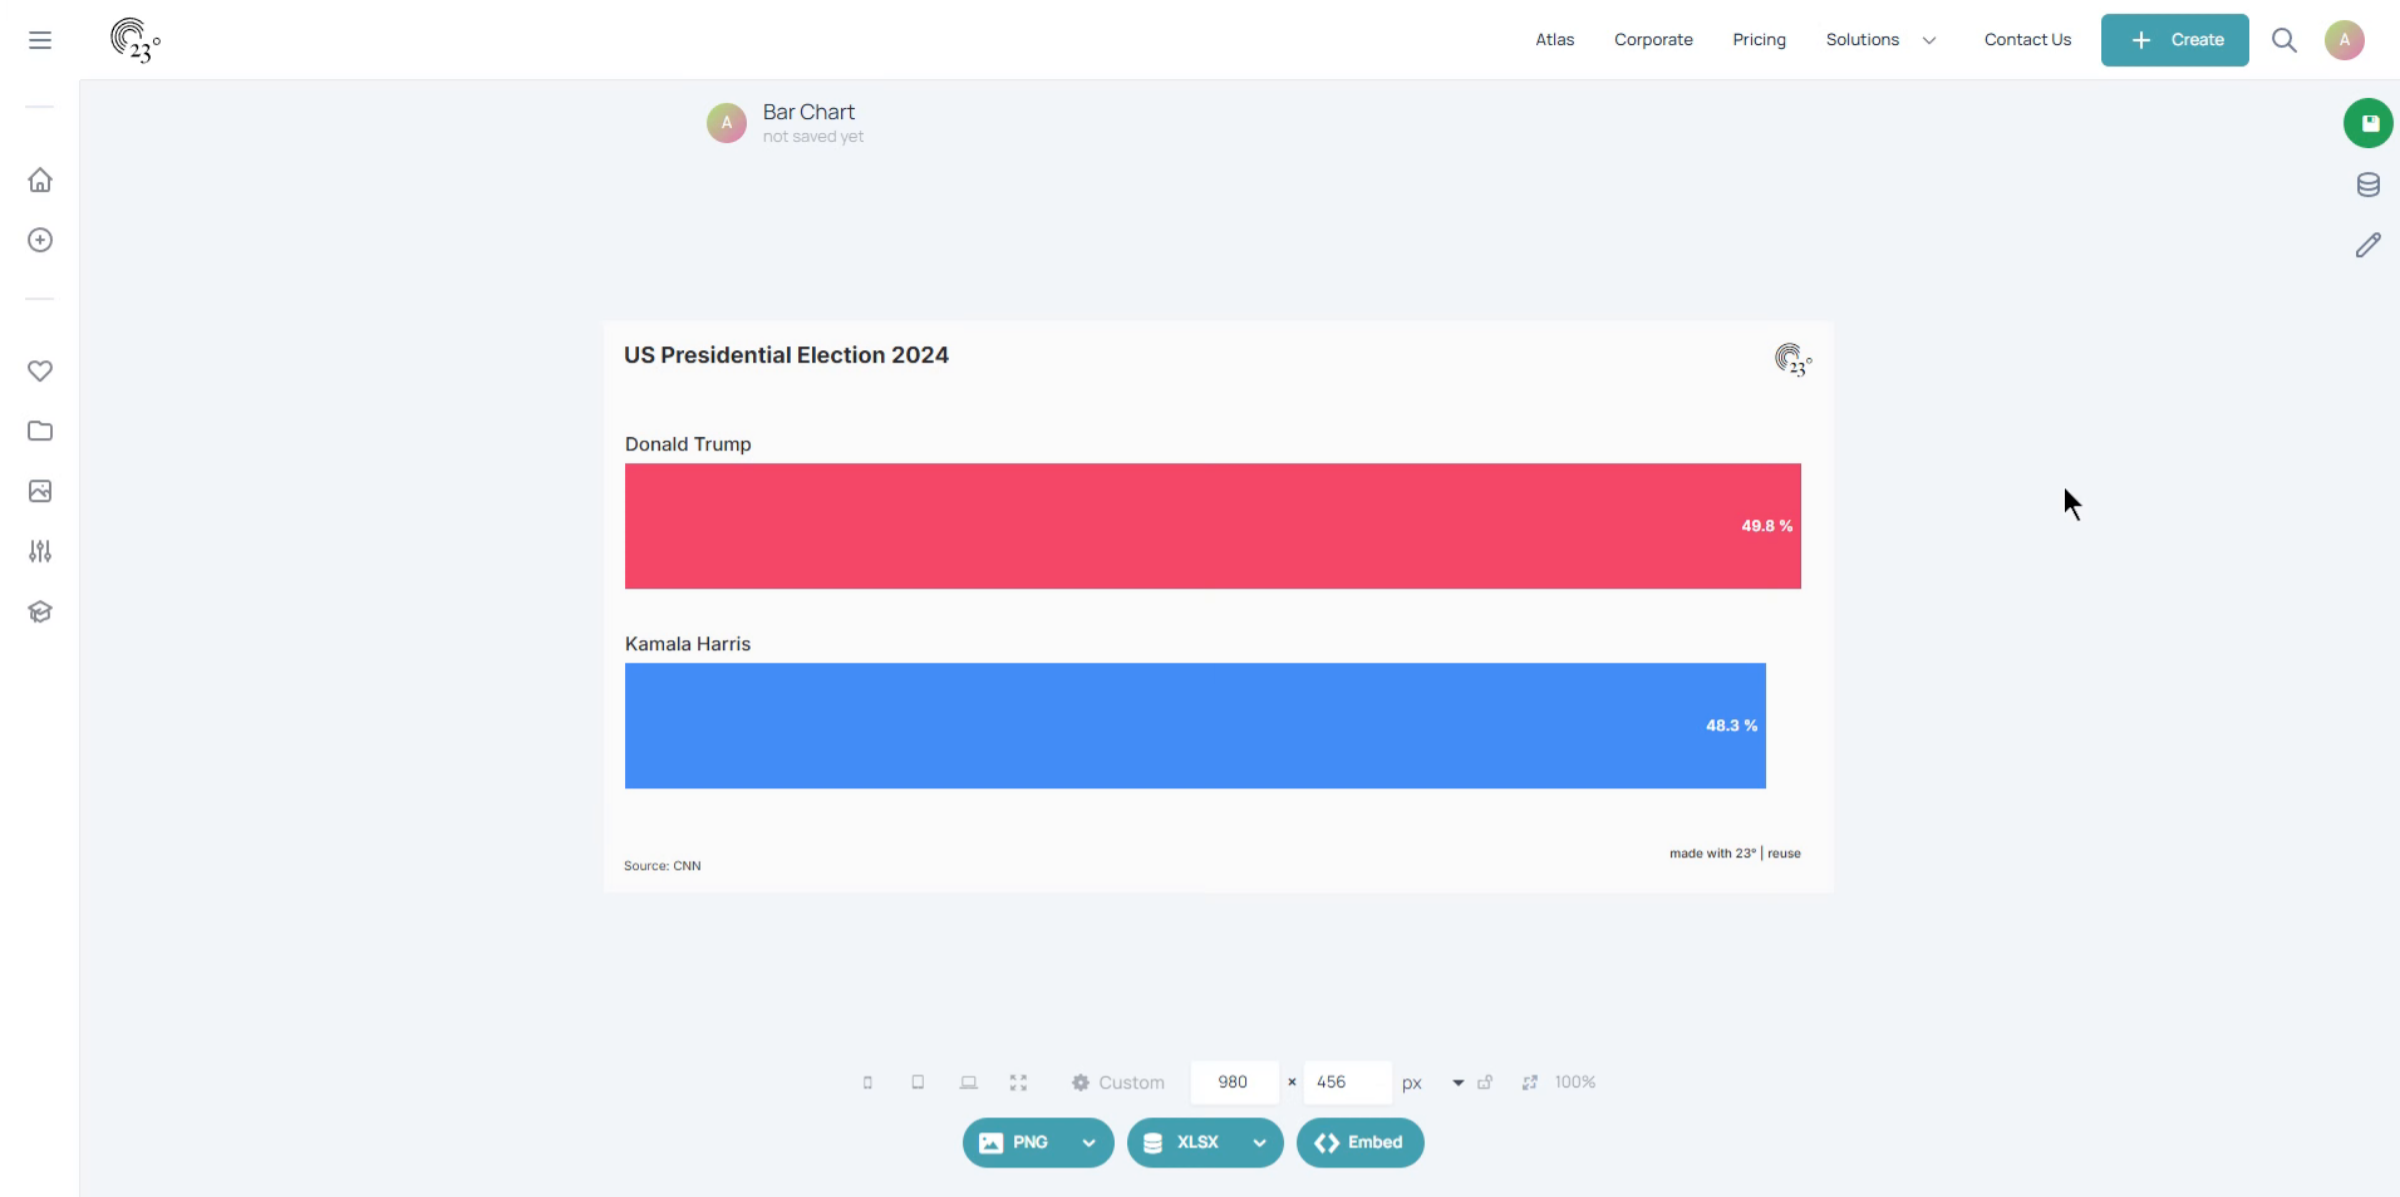
This tutorial demonstrates how to add images to a bar chart using the 23degrees application.
You’ll learn how to customise individual bars with specific images to make your chart more visual and engaging
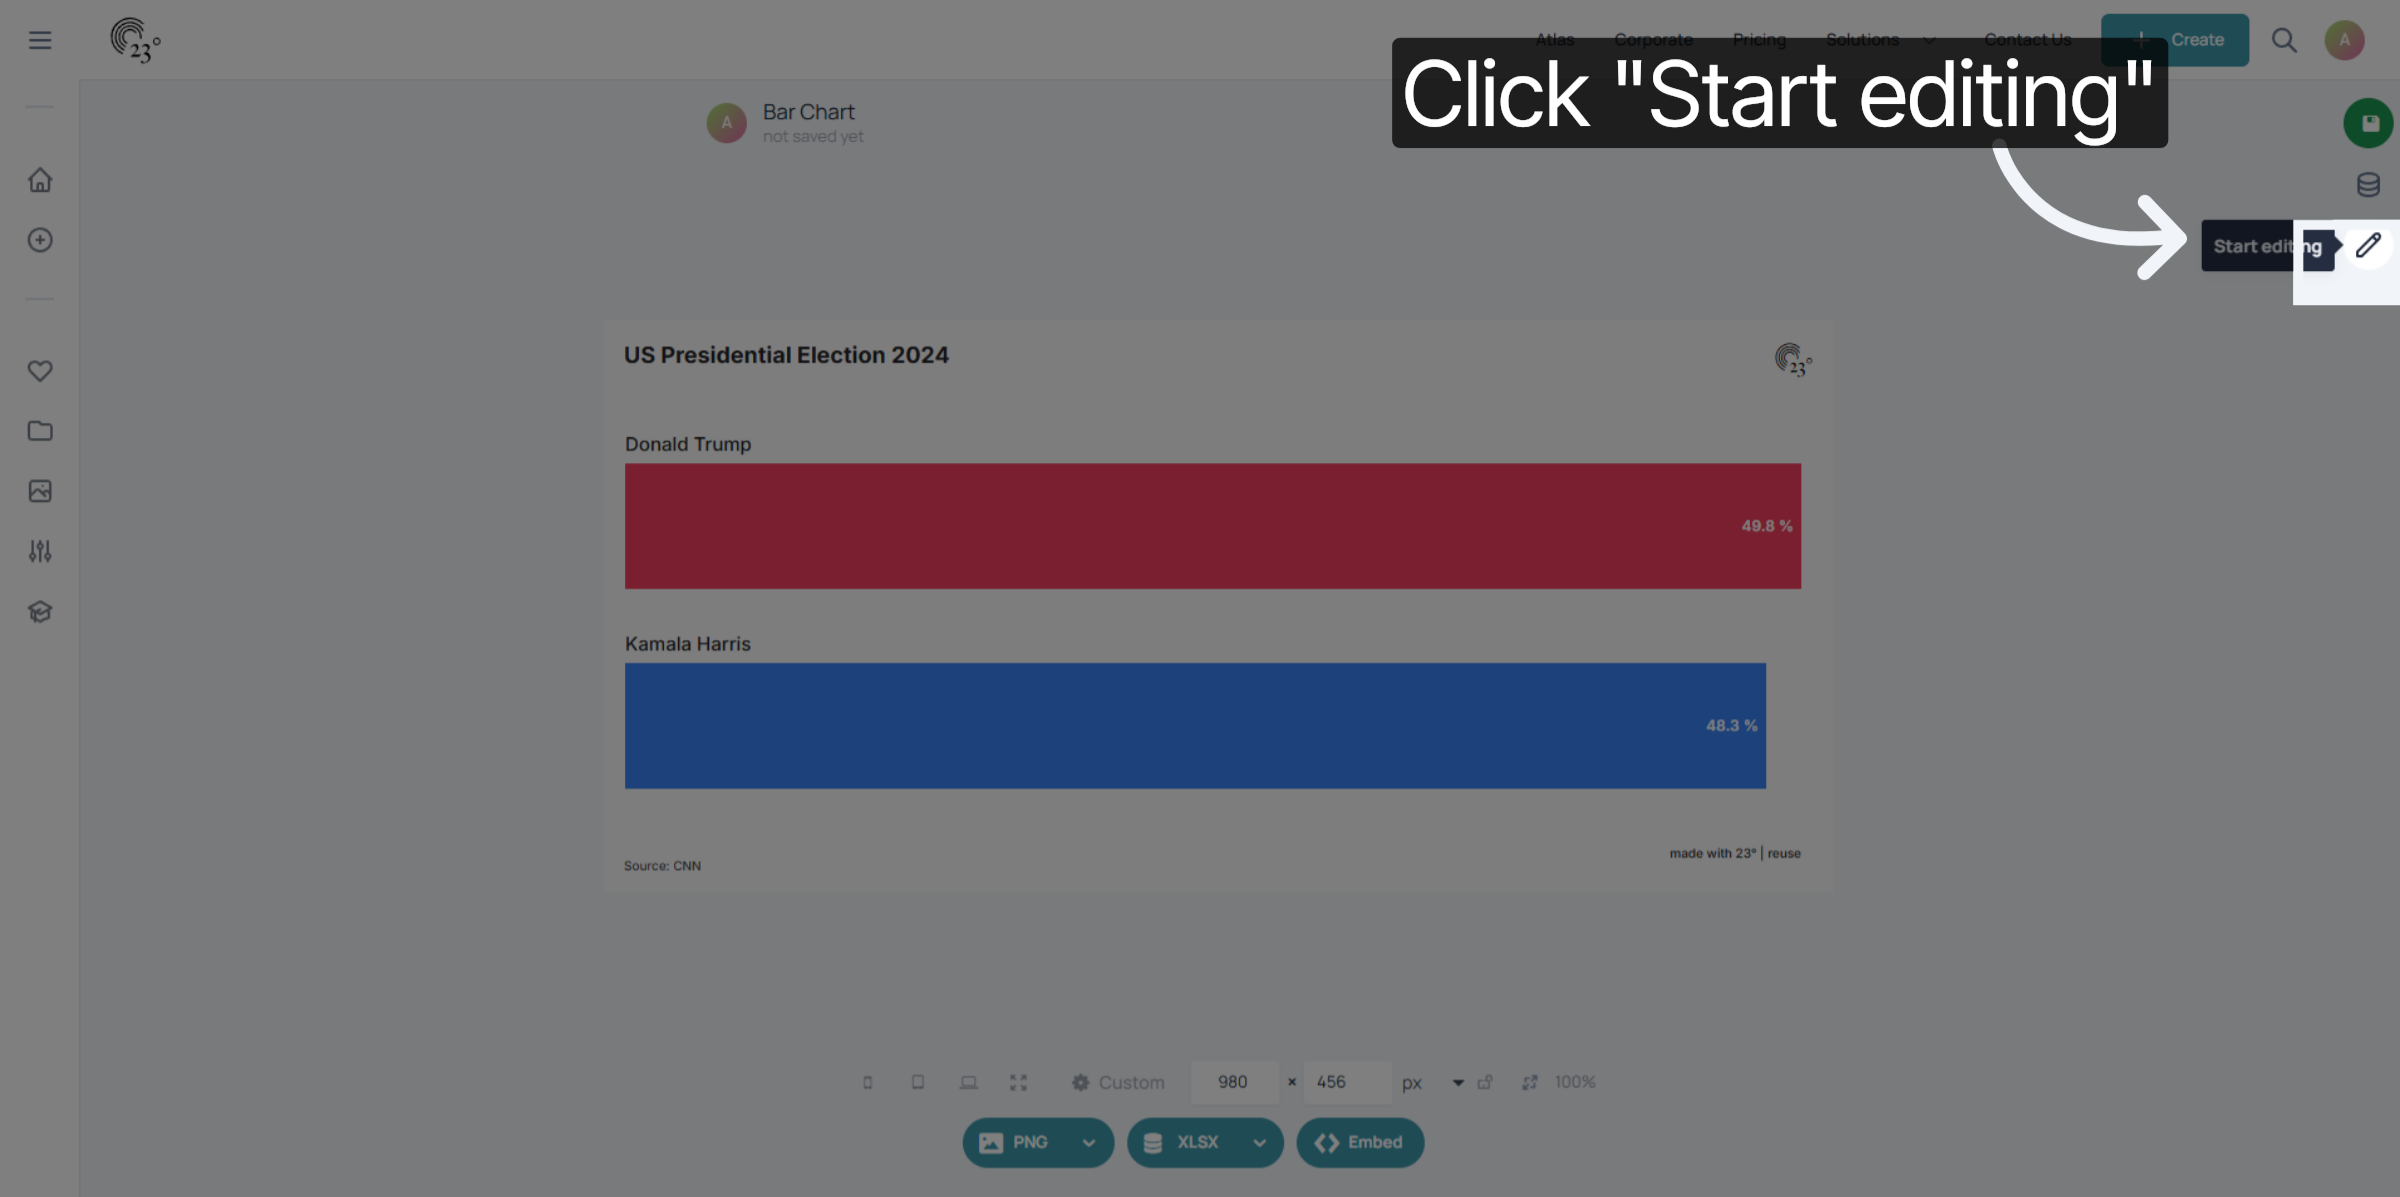
Click the Start editing button to begin modifying your bar chart.
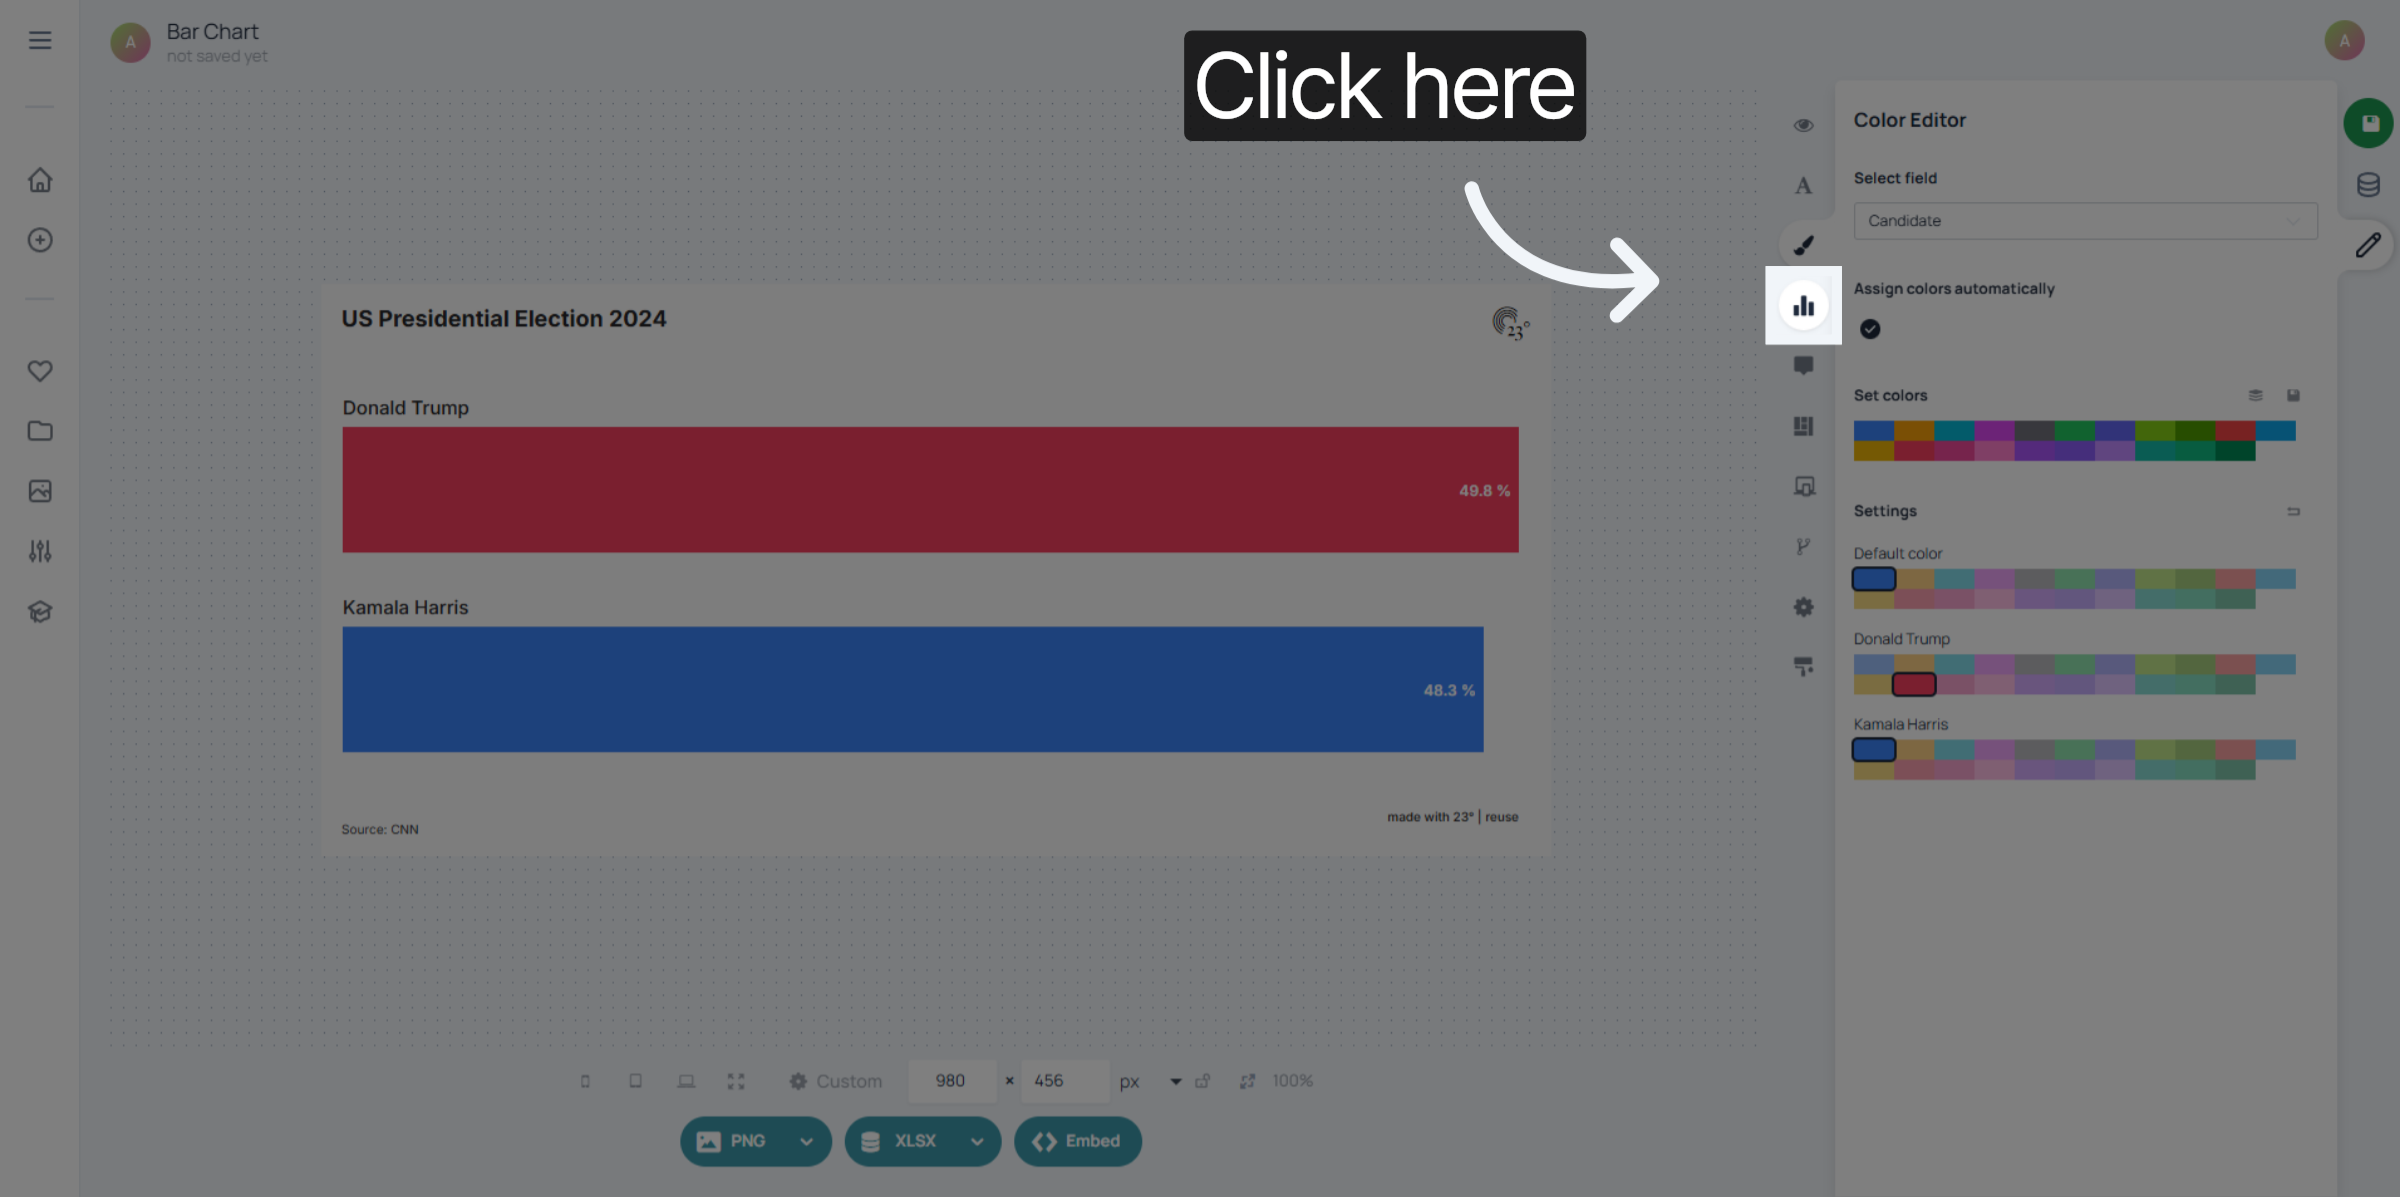
Go to the chart editor menu.
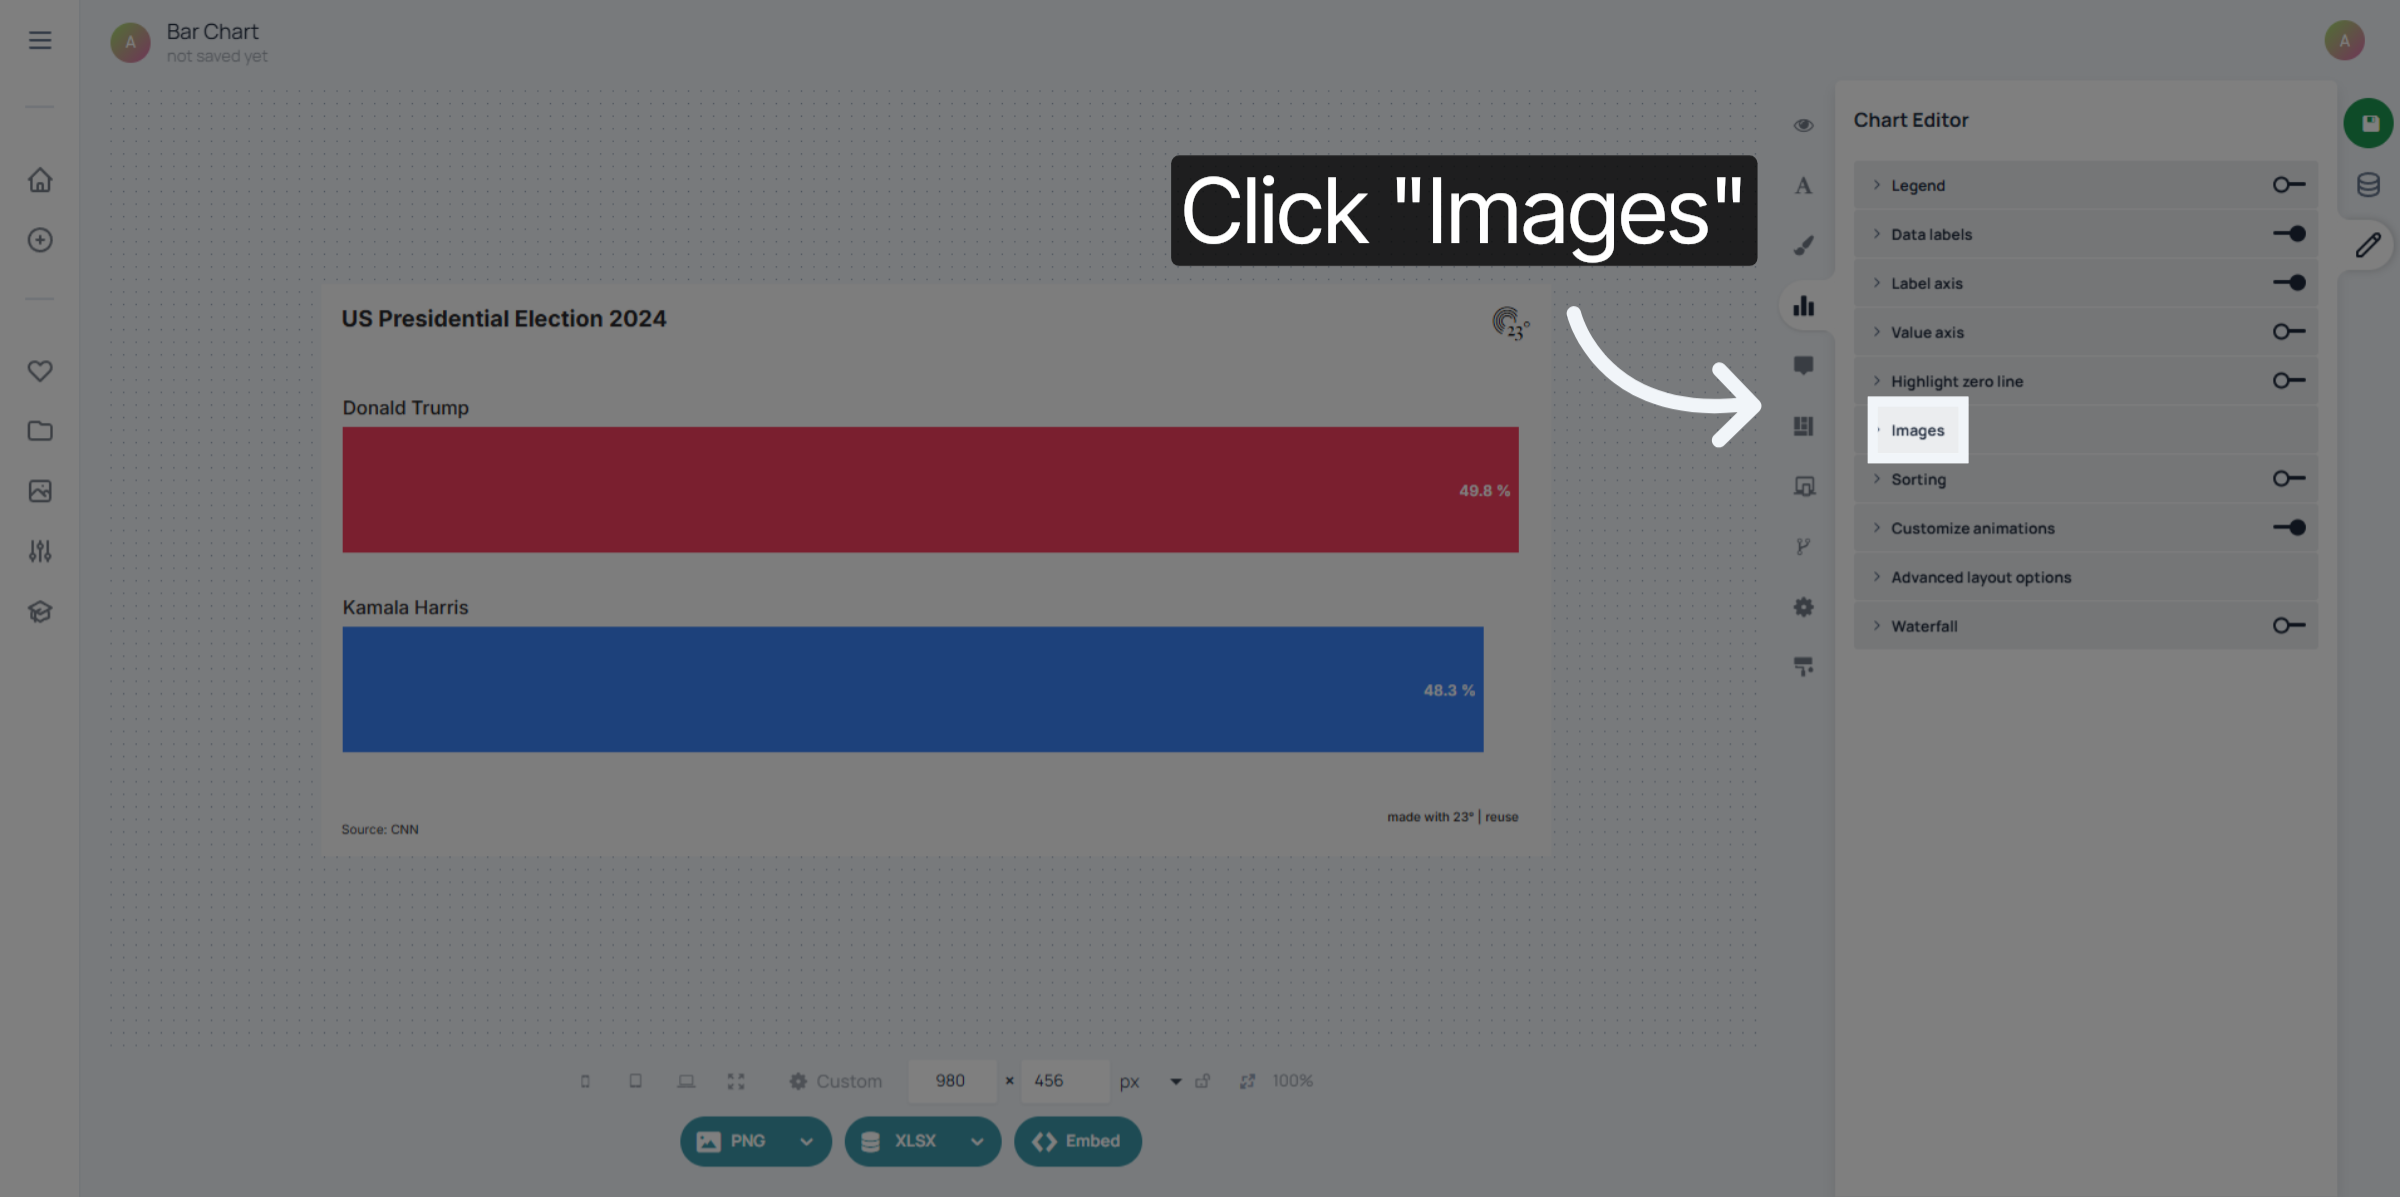
And click the Images tab. This is where you can manage and add images that will be used inside your bar chart.
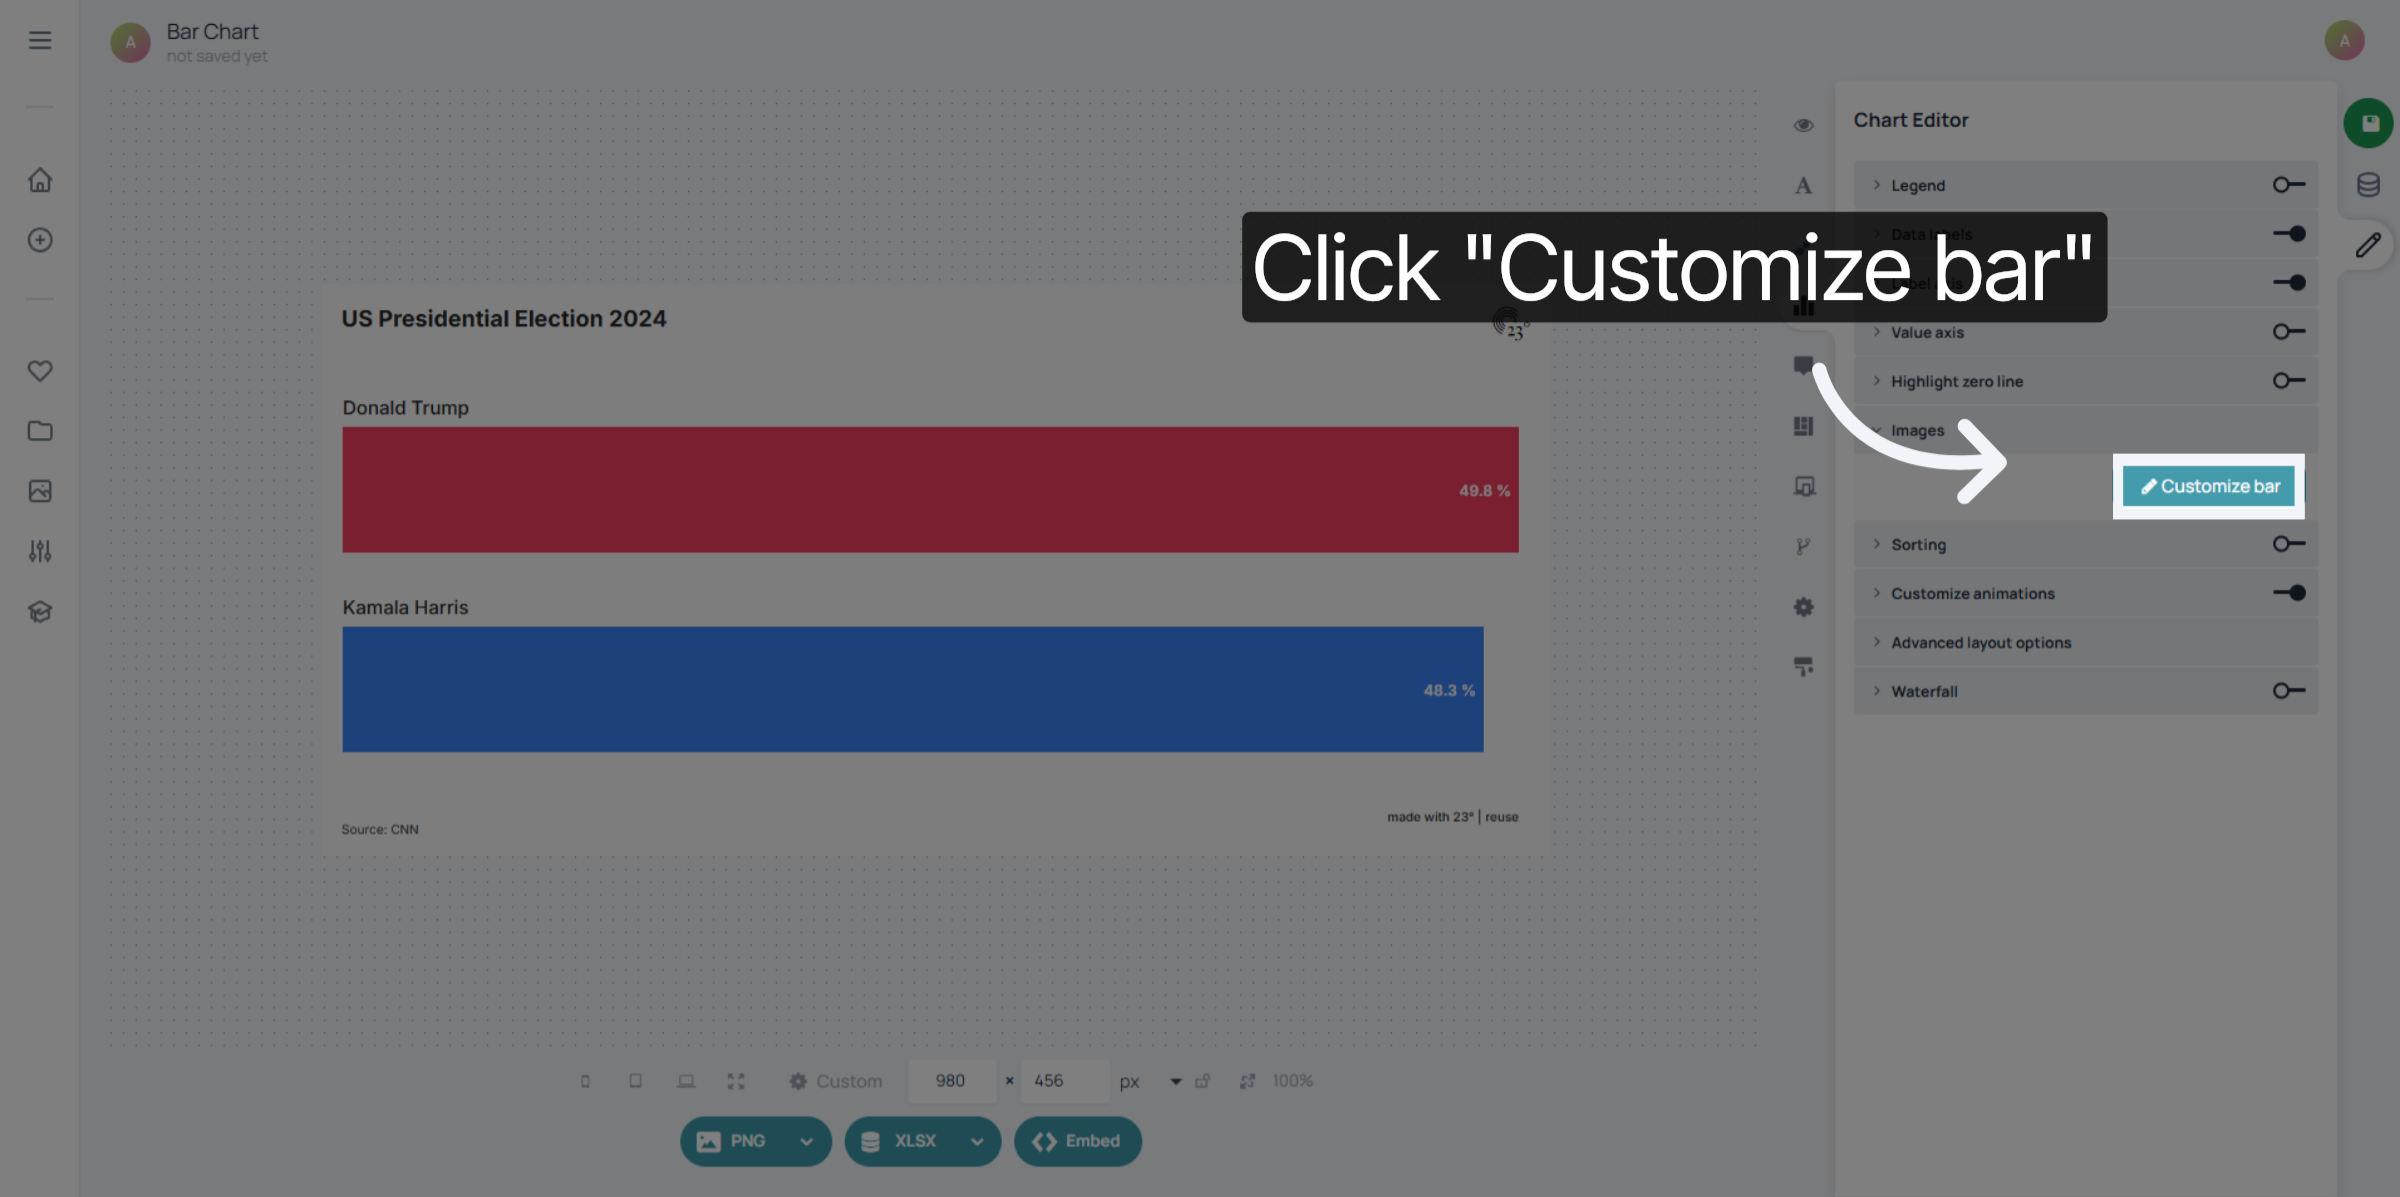
Click Customize bar to modify individual bar elements within the chart.
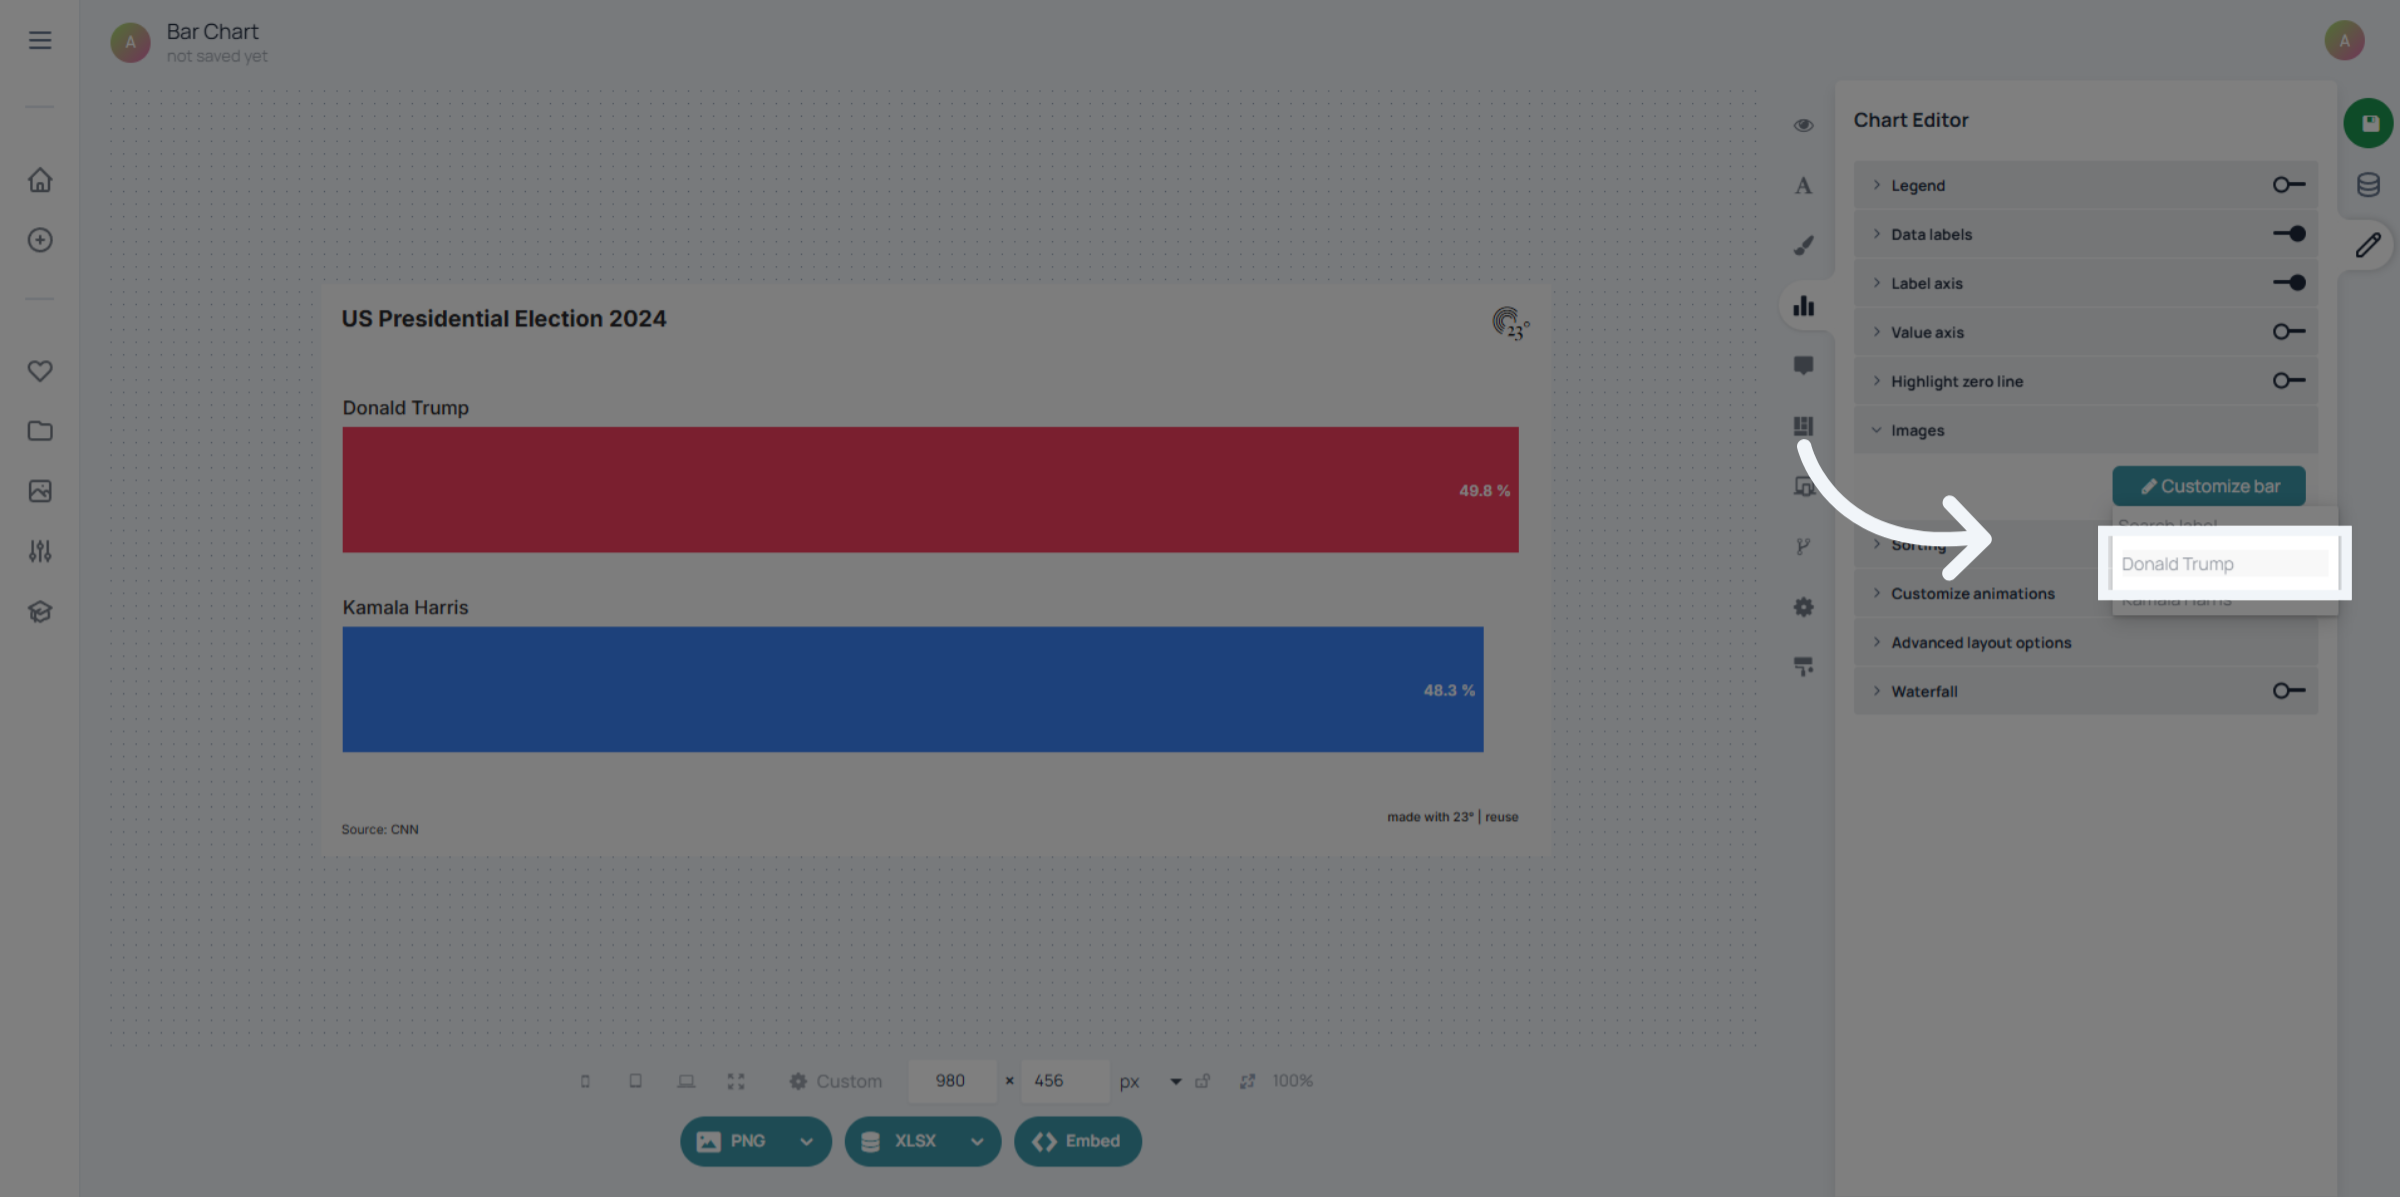
Select the bars where you wish to add an image. This lets you target specific bars instead of applying the same image to all of them.
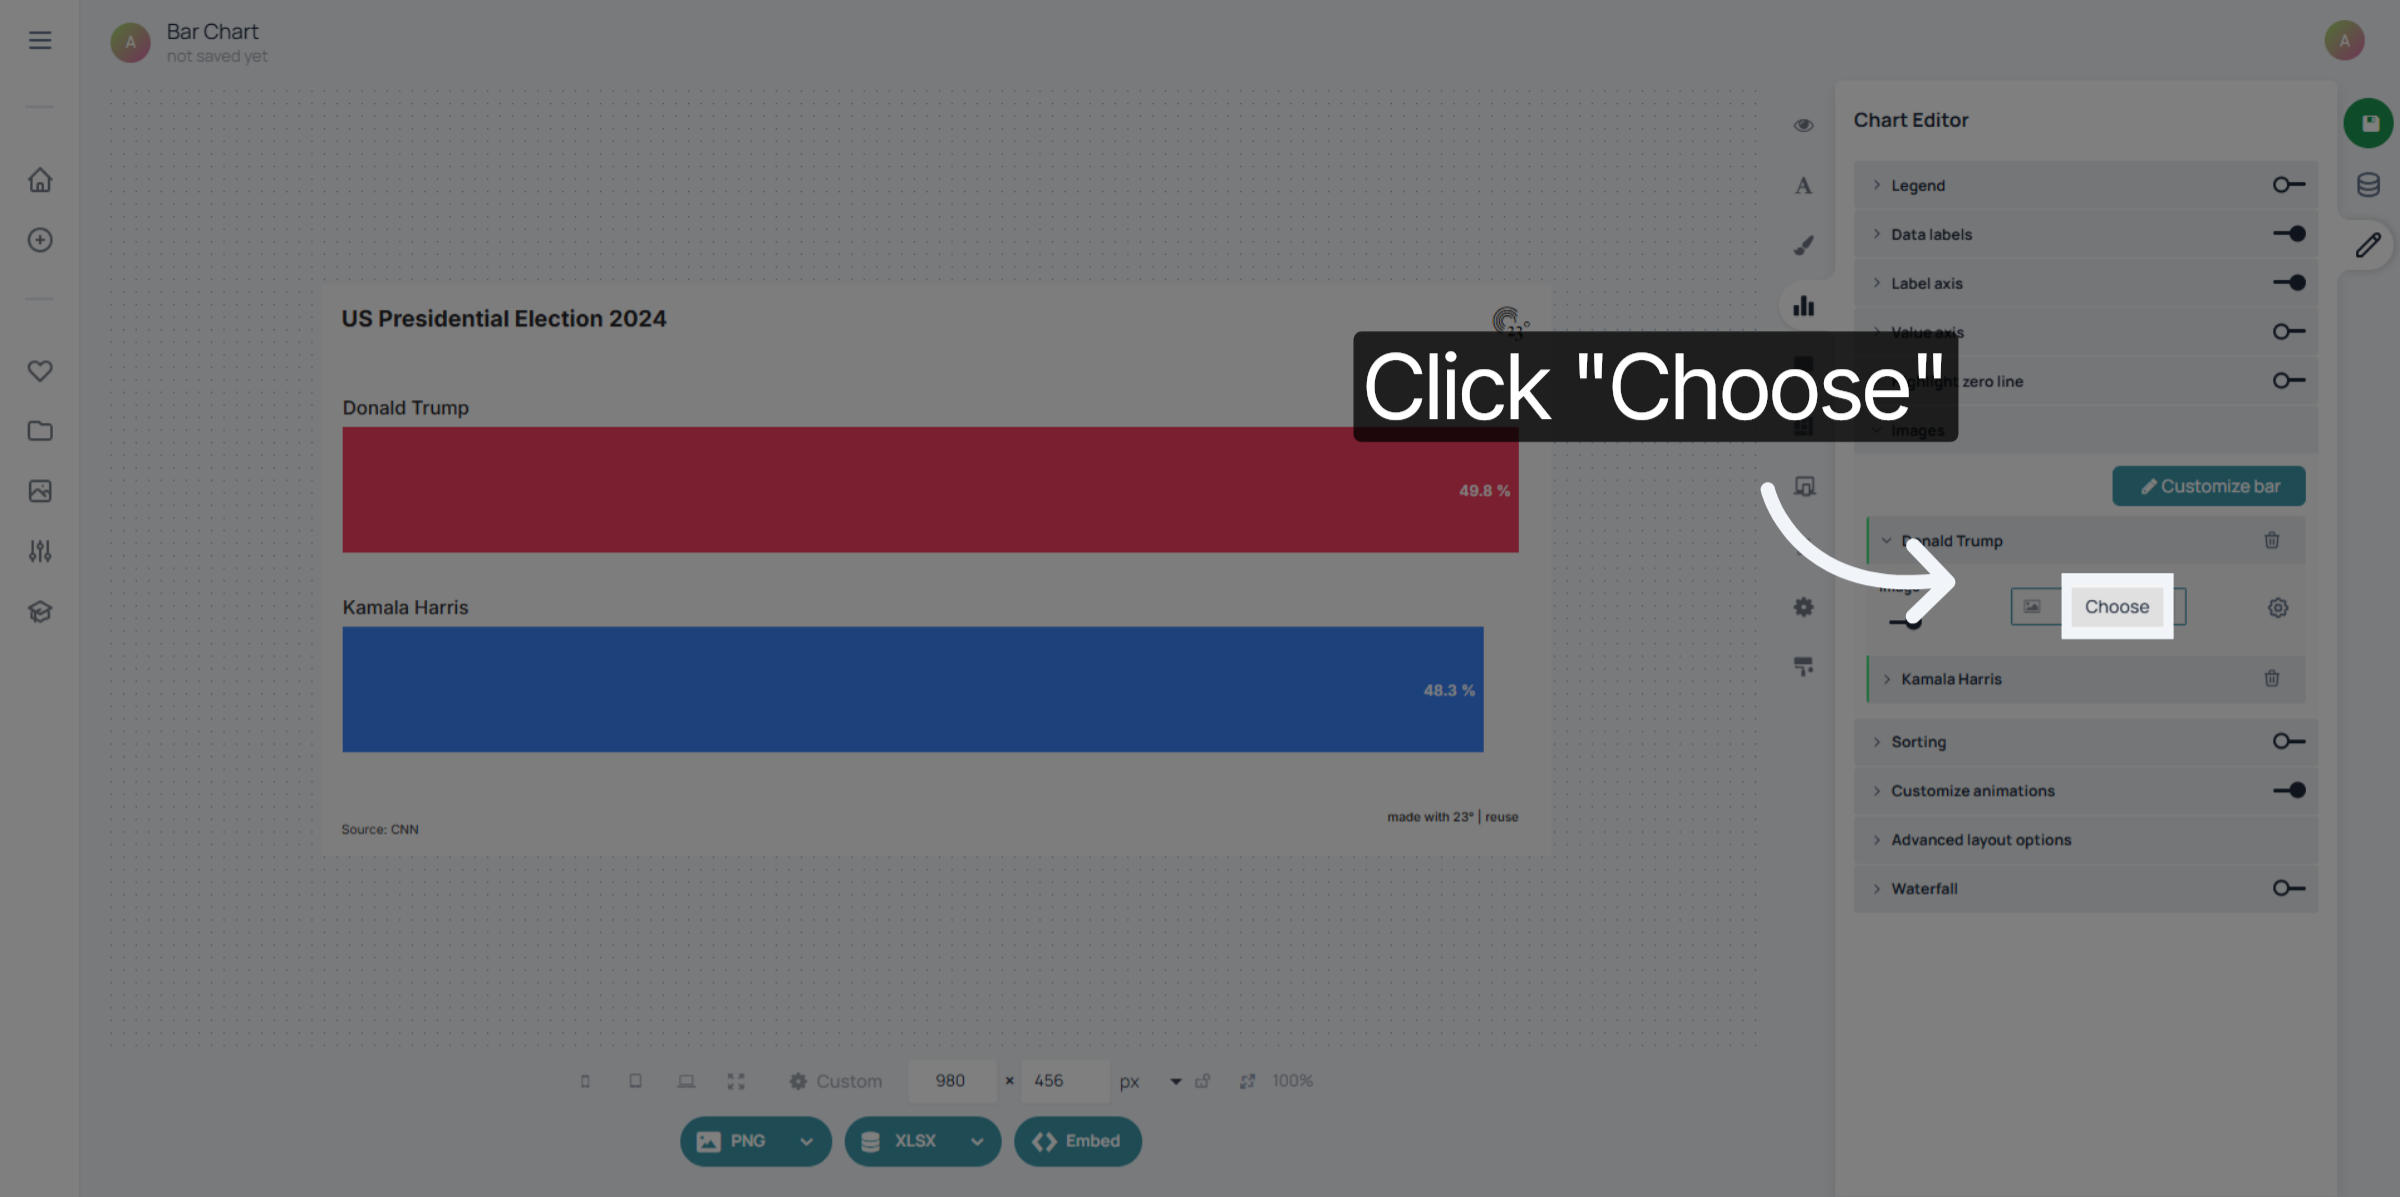
Click the "Choose" button to select an image from your media library.
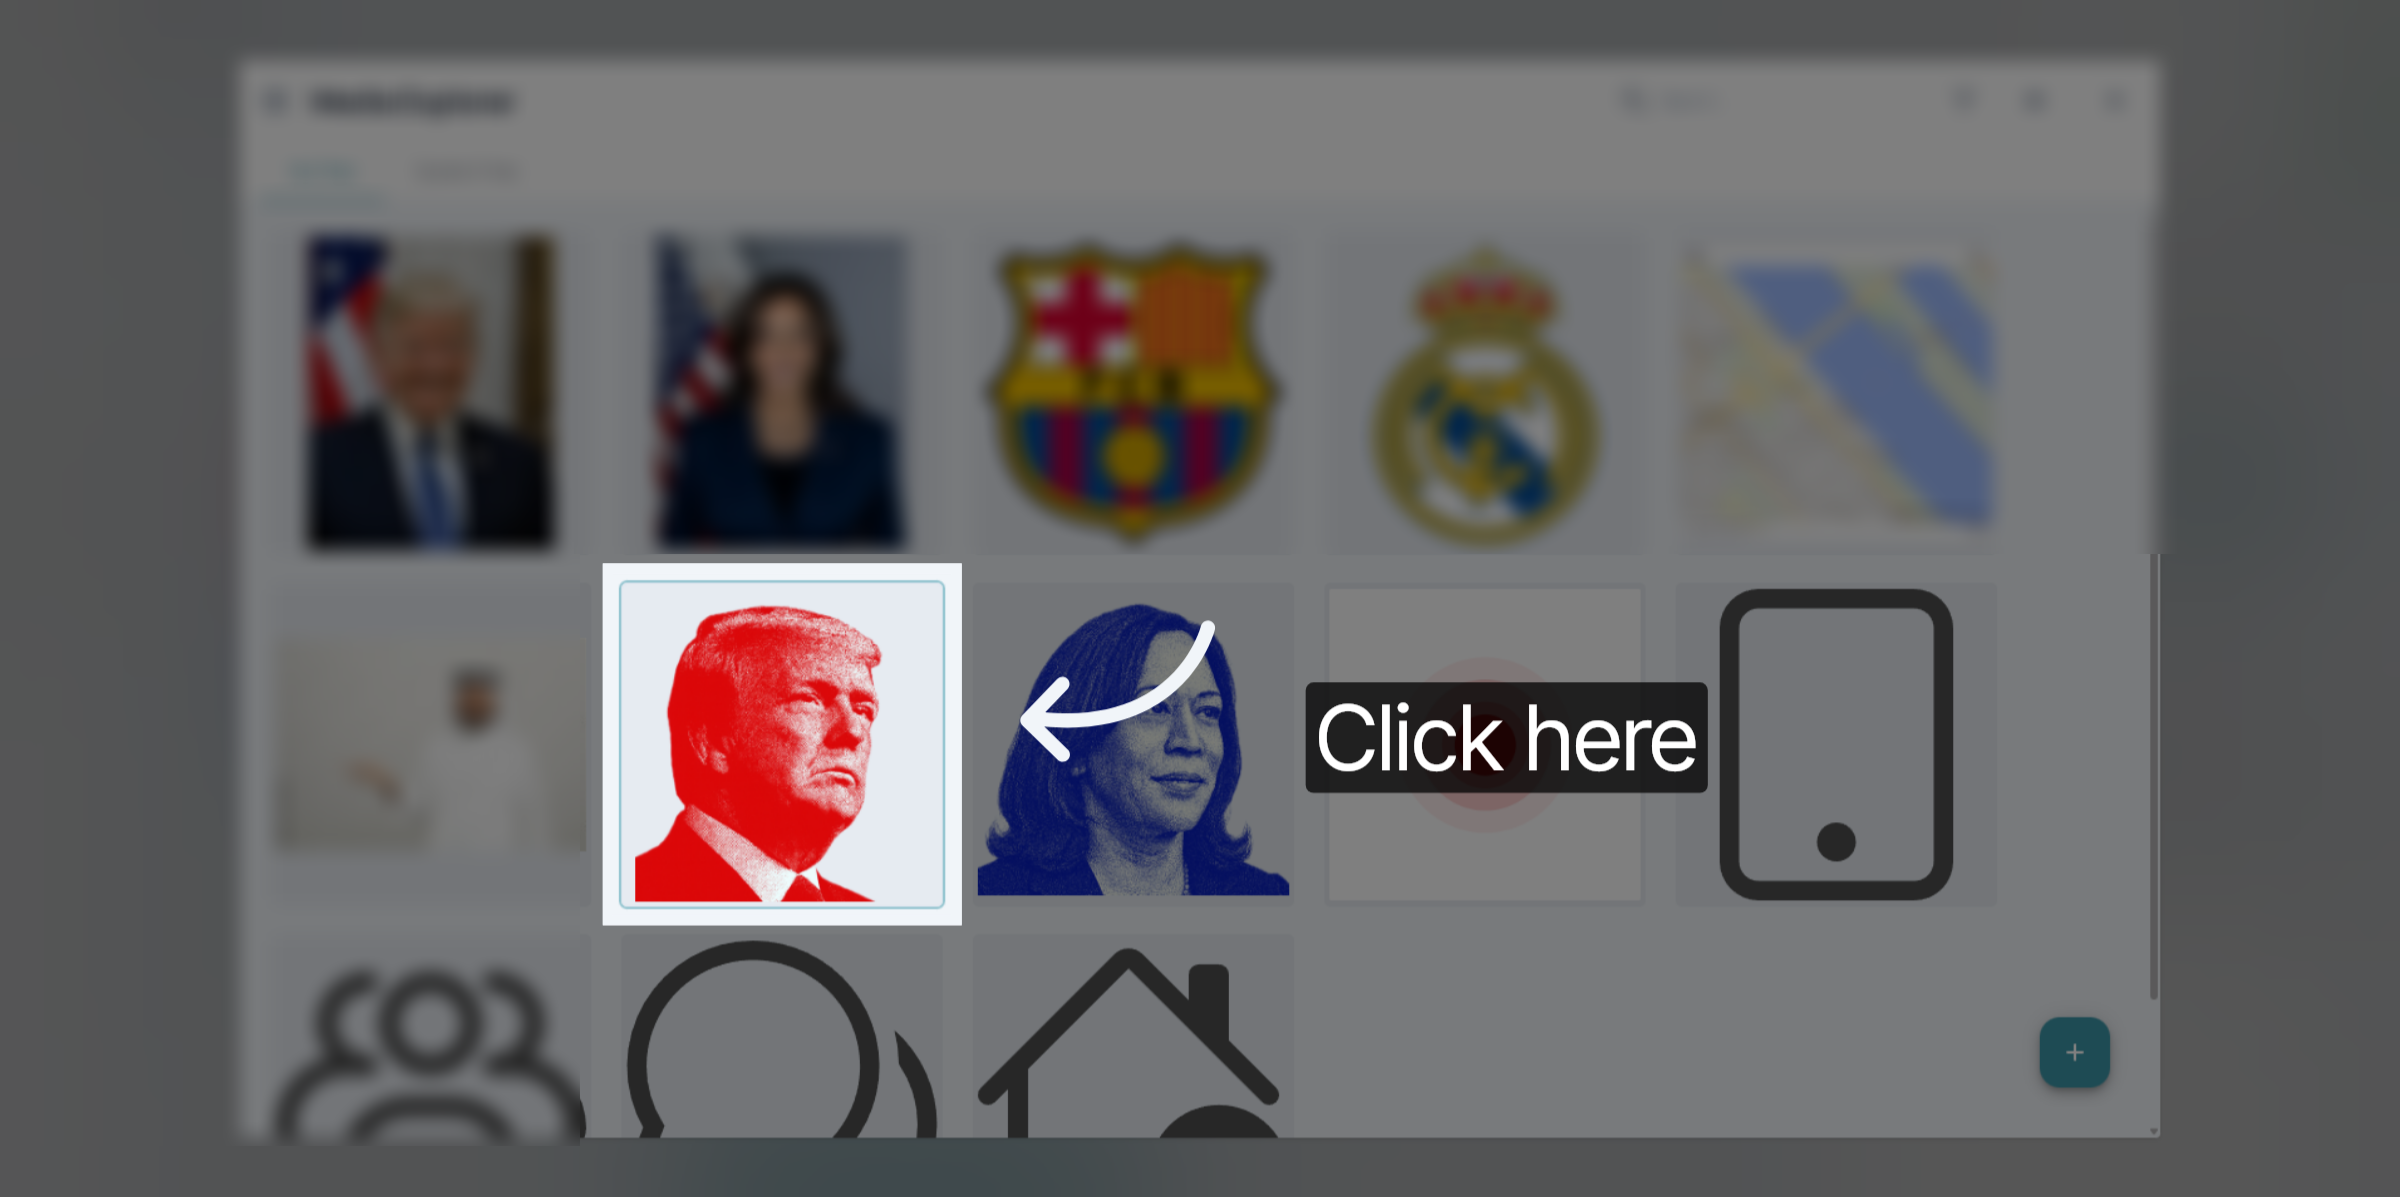
Select your image.
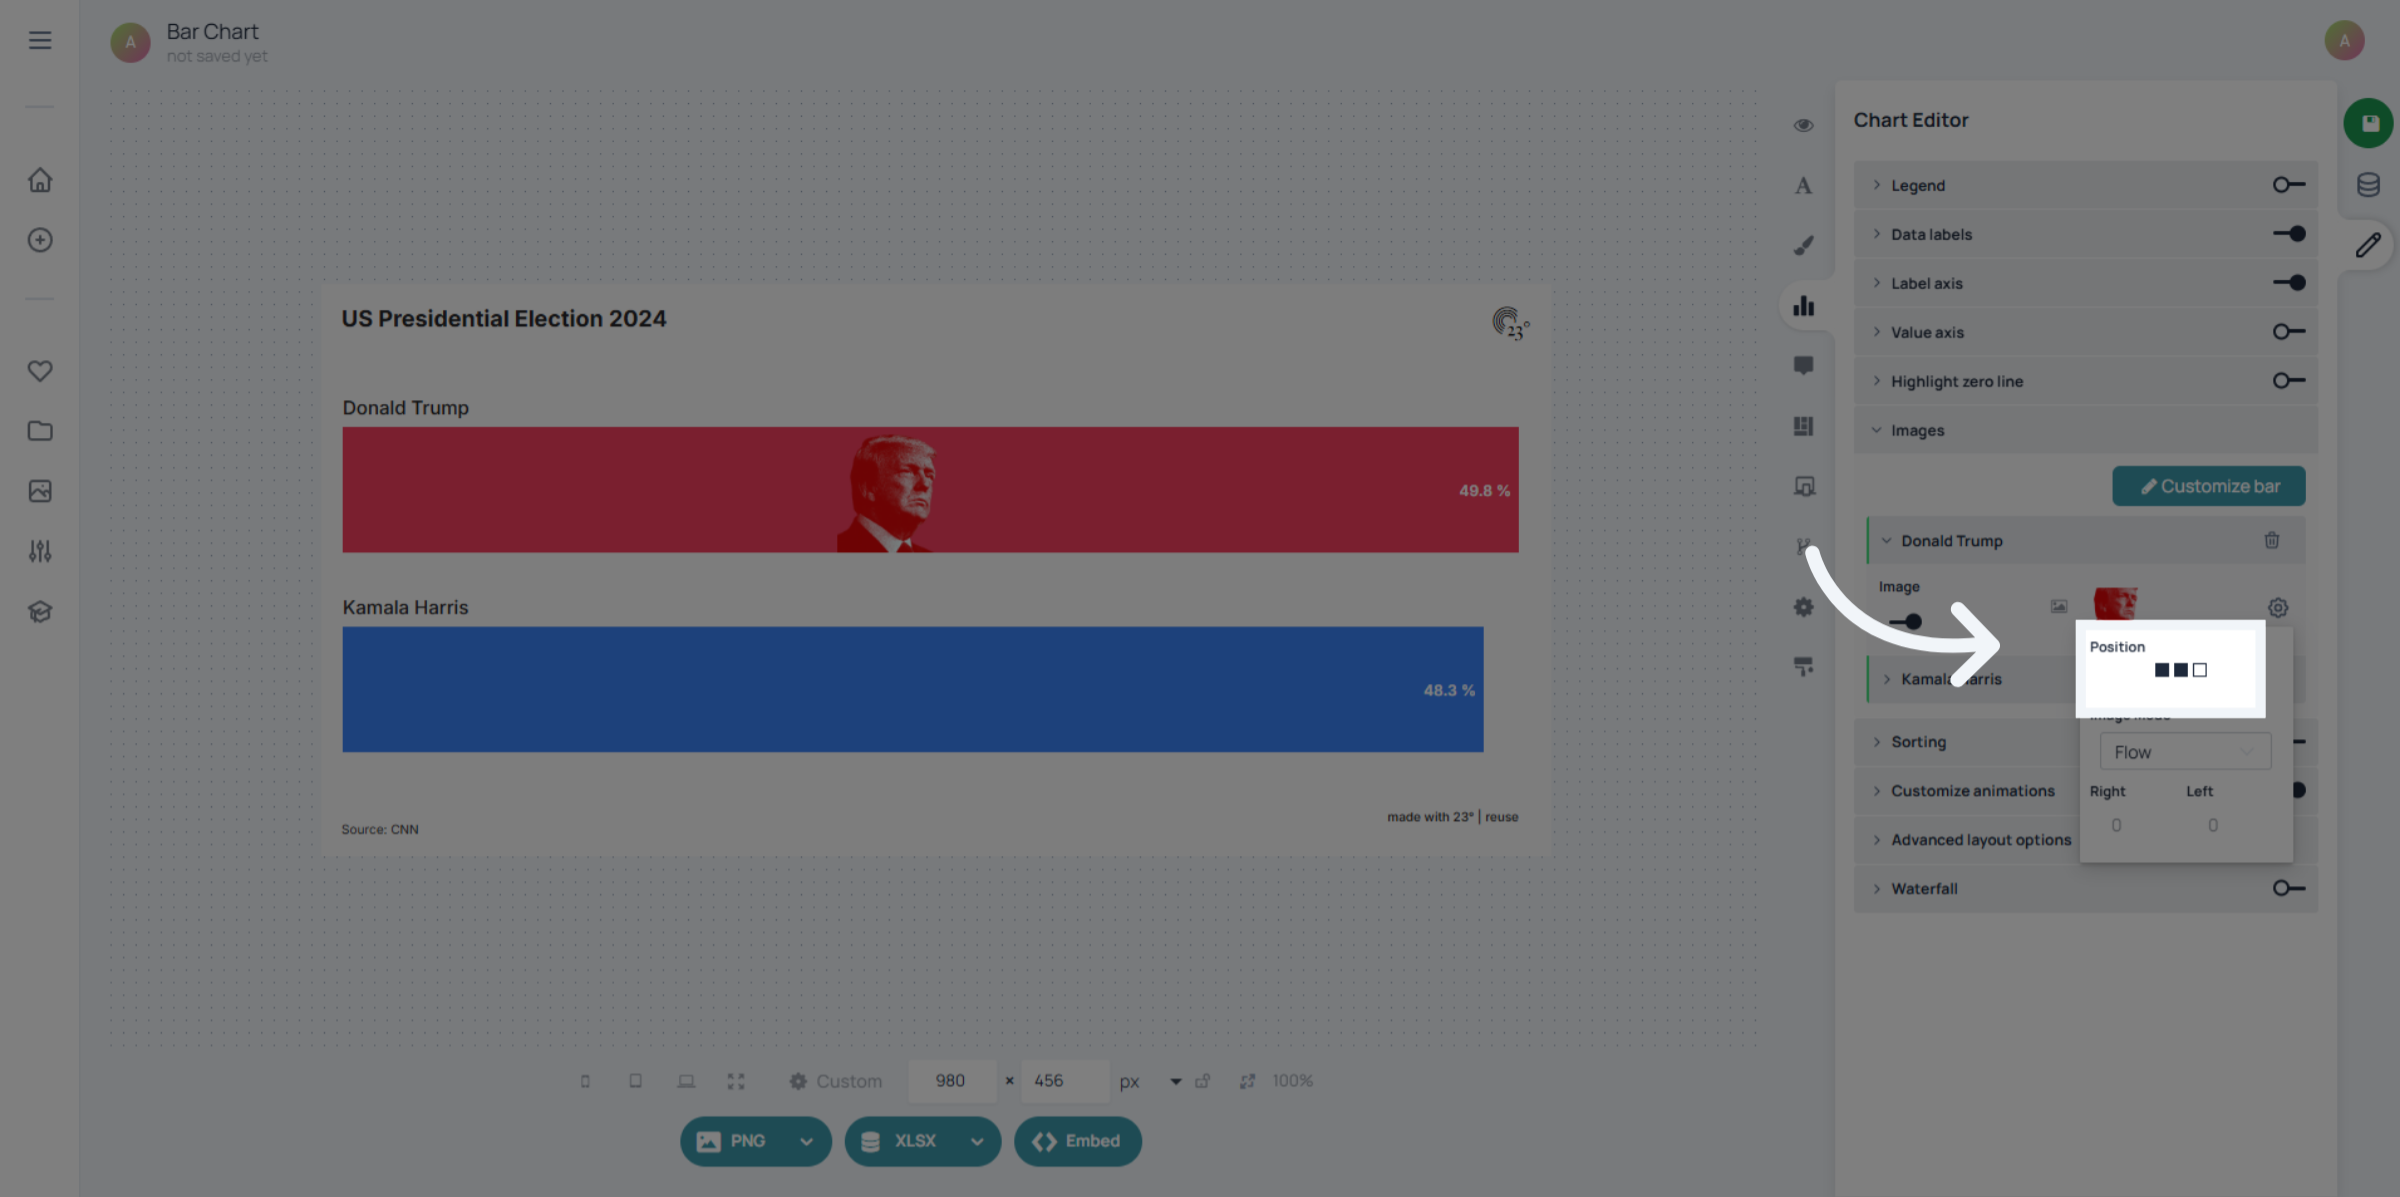
Now that your image appears inside the bar, click the options button next to the bar image settings to choose its placement.
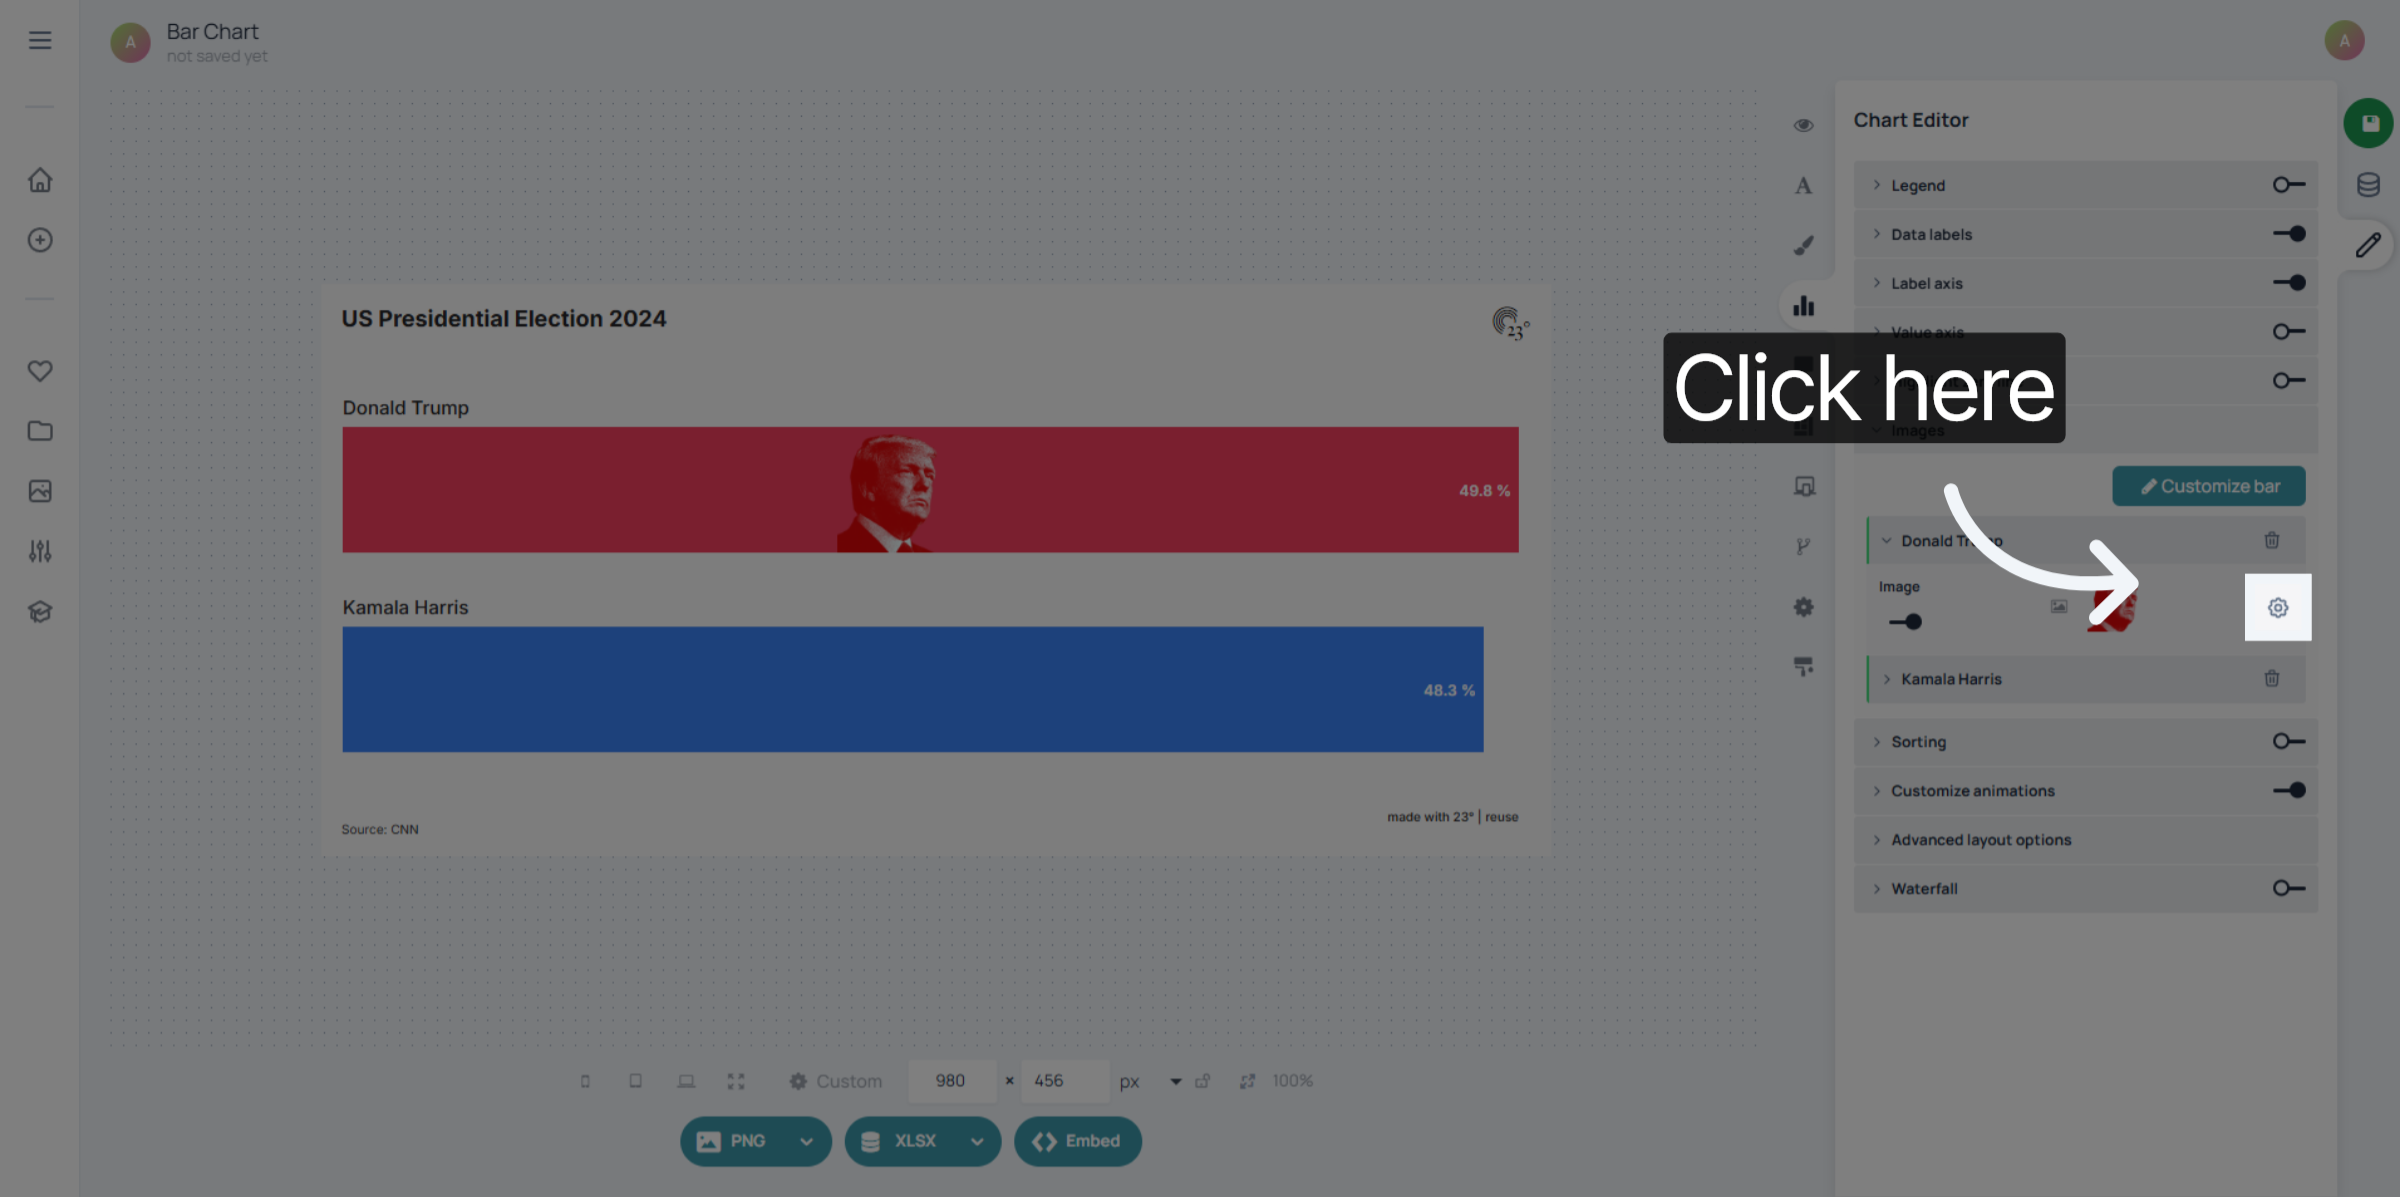
You can align the image left, centre, or right within the bar.
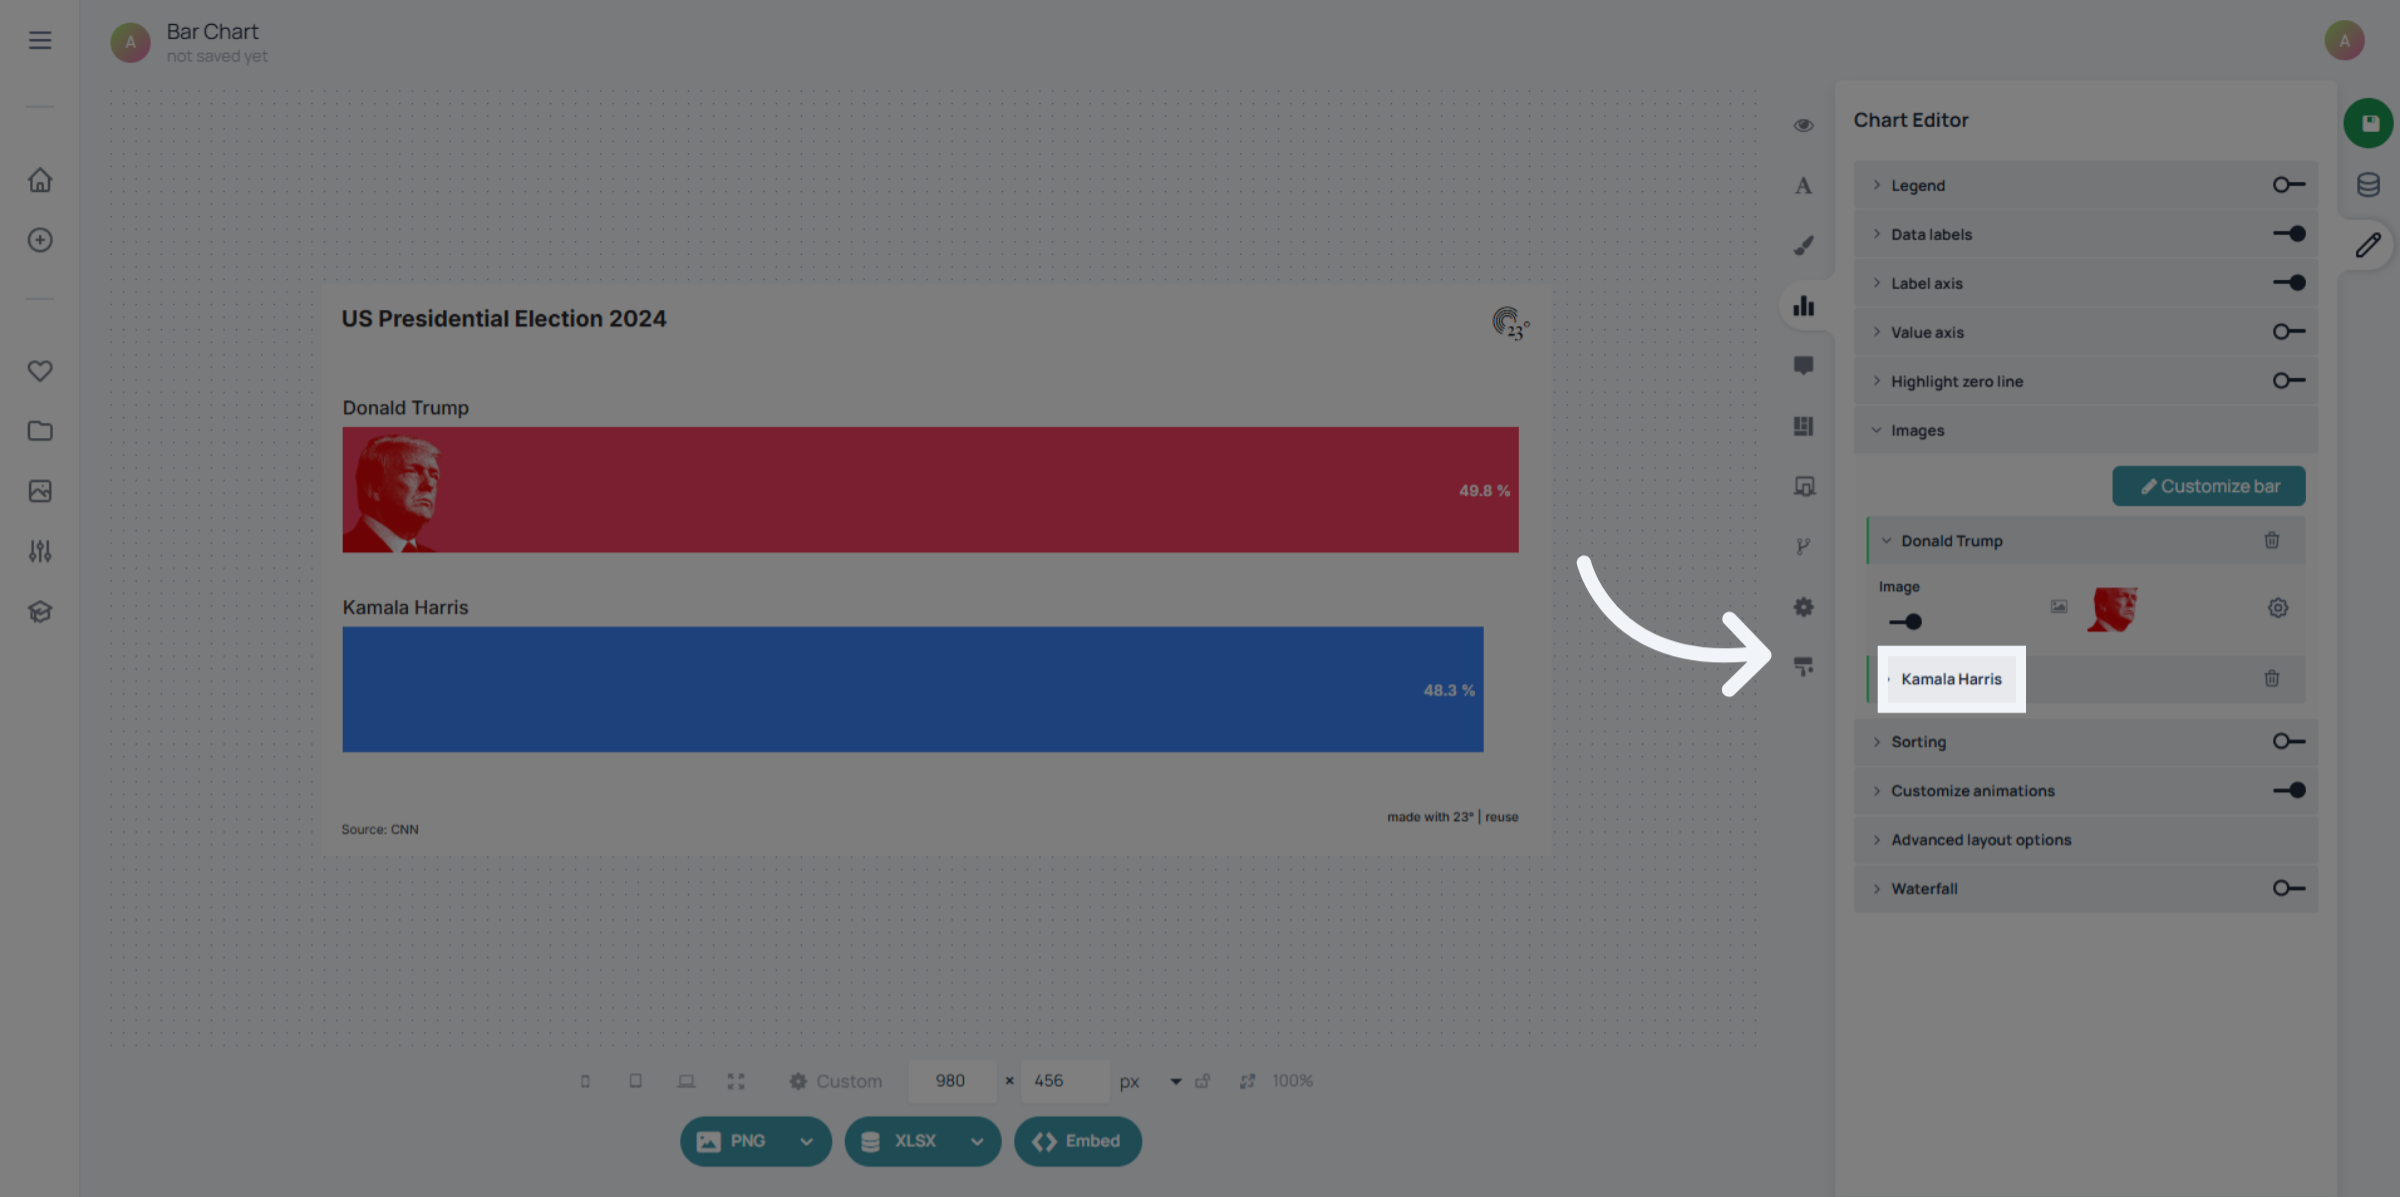
Repeat these steps for all the bars that should have images. You can use different images for different bars to create a more descriptive and visual chart.
And that's it. Easy isn't it
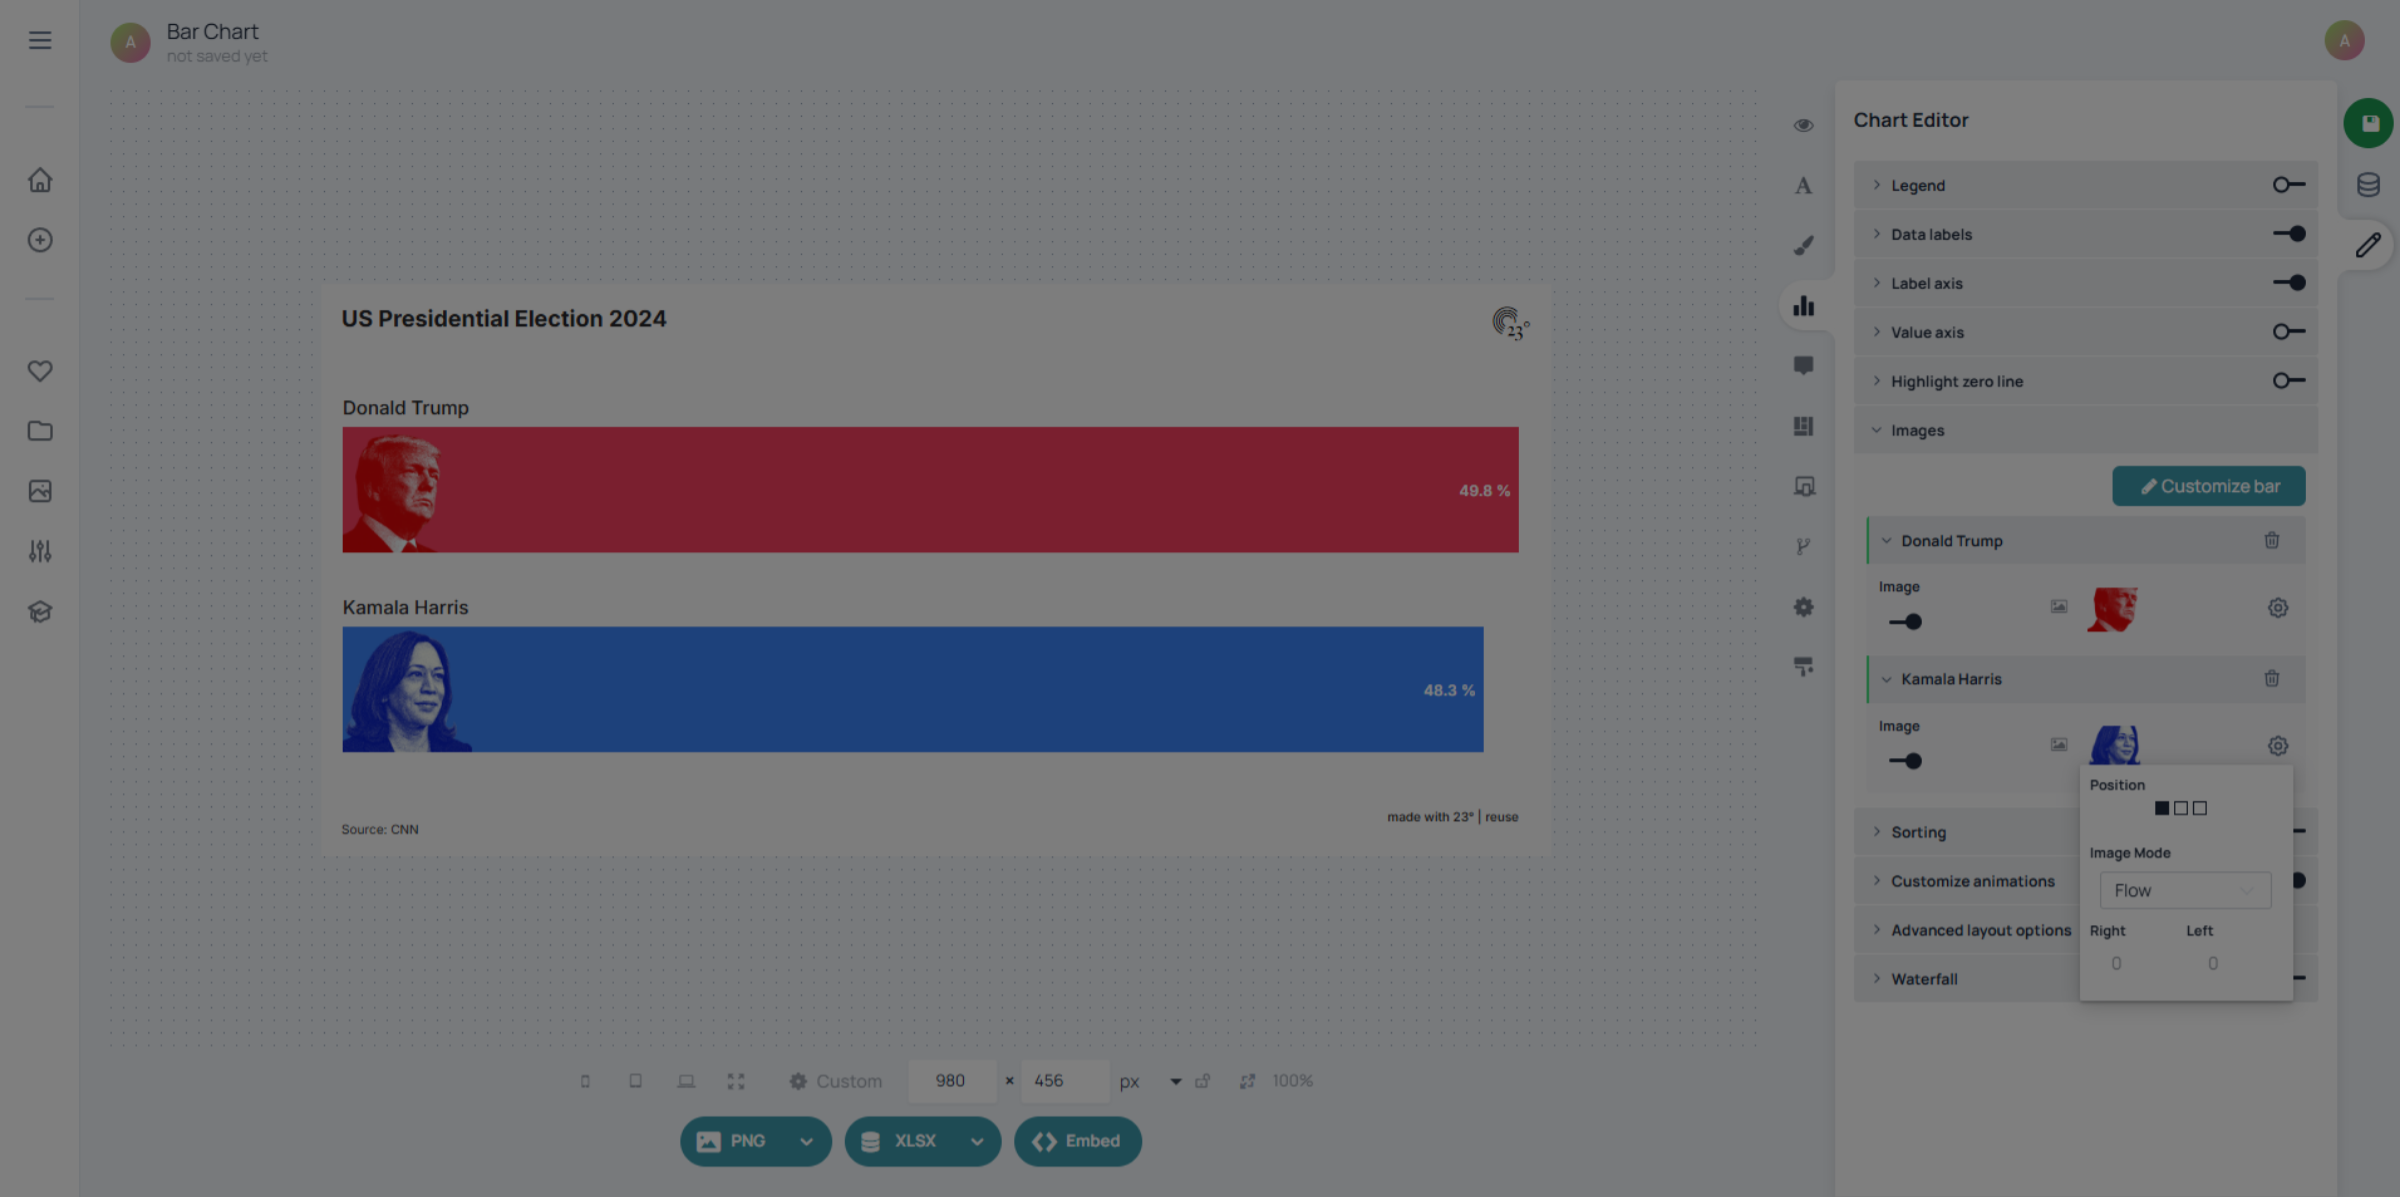
Your bars now have images applied and customised. You’ve successfully added and positioned images for individual bars in your bar chart using the 23degrees application, enhancing both the visual representation of your data and the engagement of your presentation.