Customize Specific Value Labels in Charts
This tutorial guides you through customizing specific labels within charts in 23degrees.
You will learn how to modify label settings to tailor data presentation effectively.
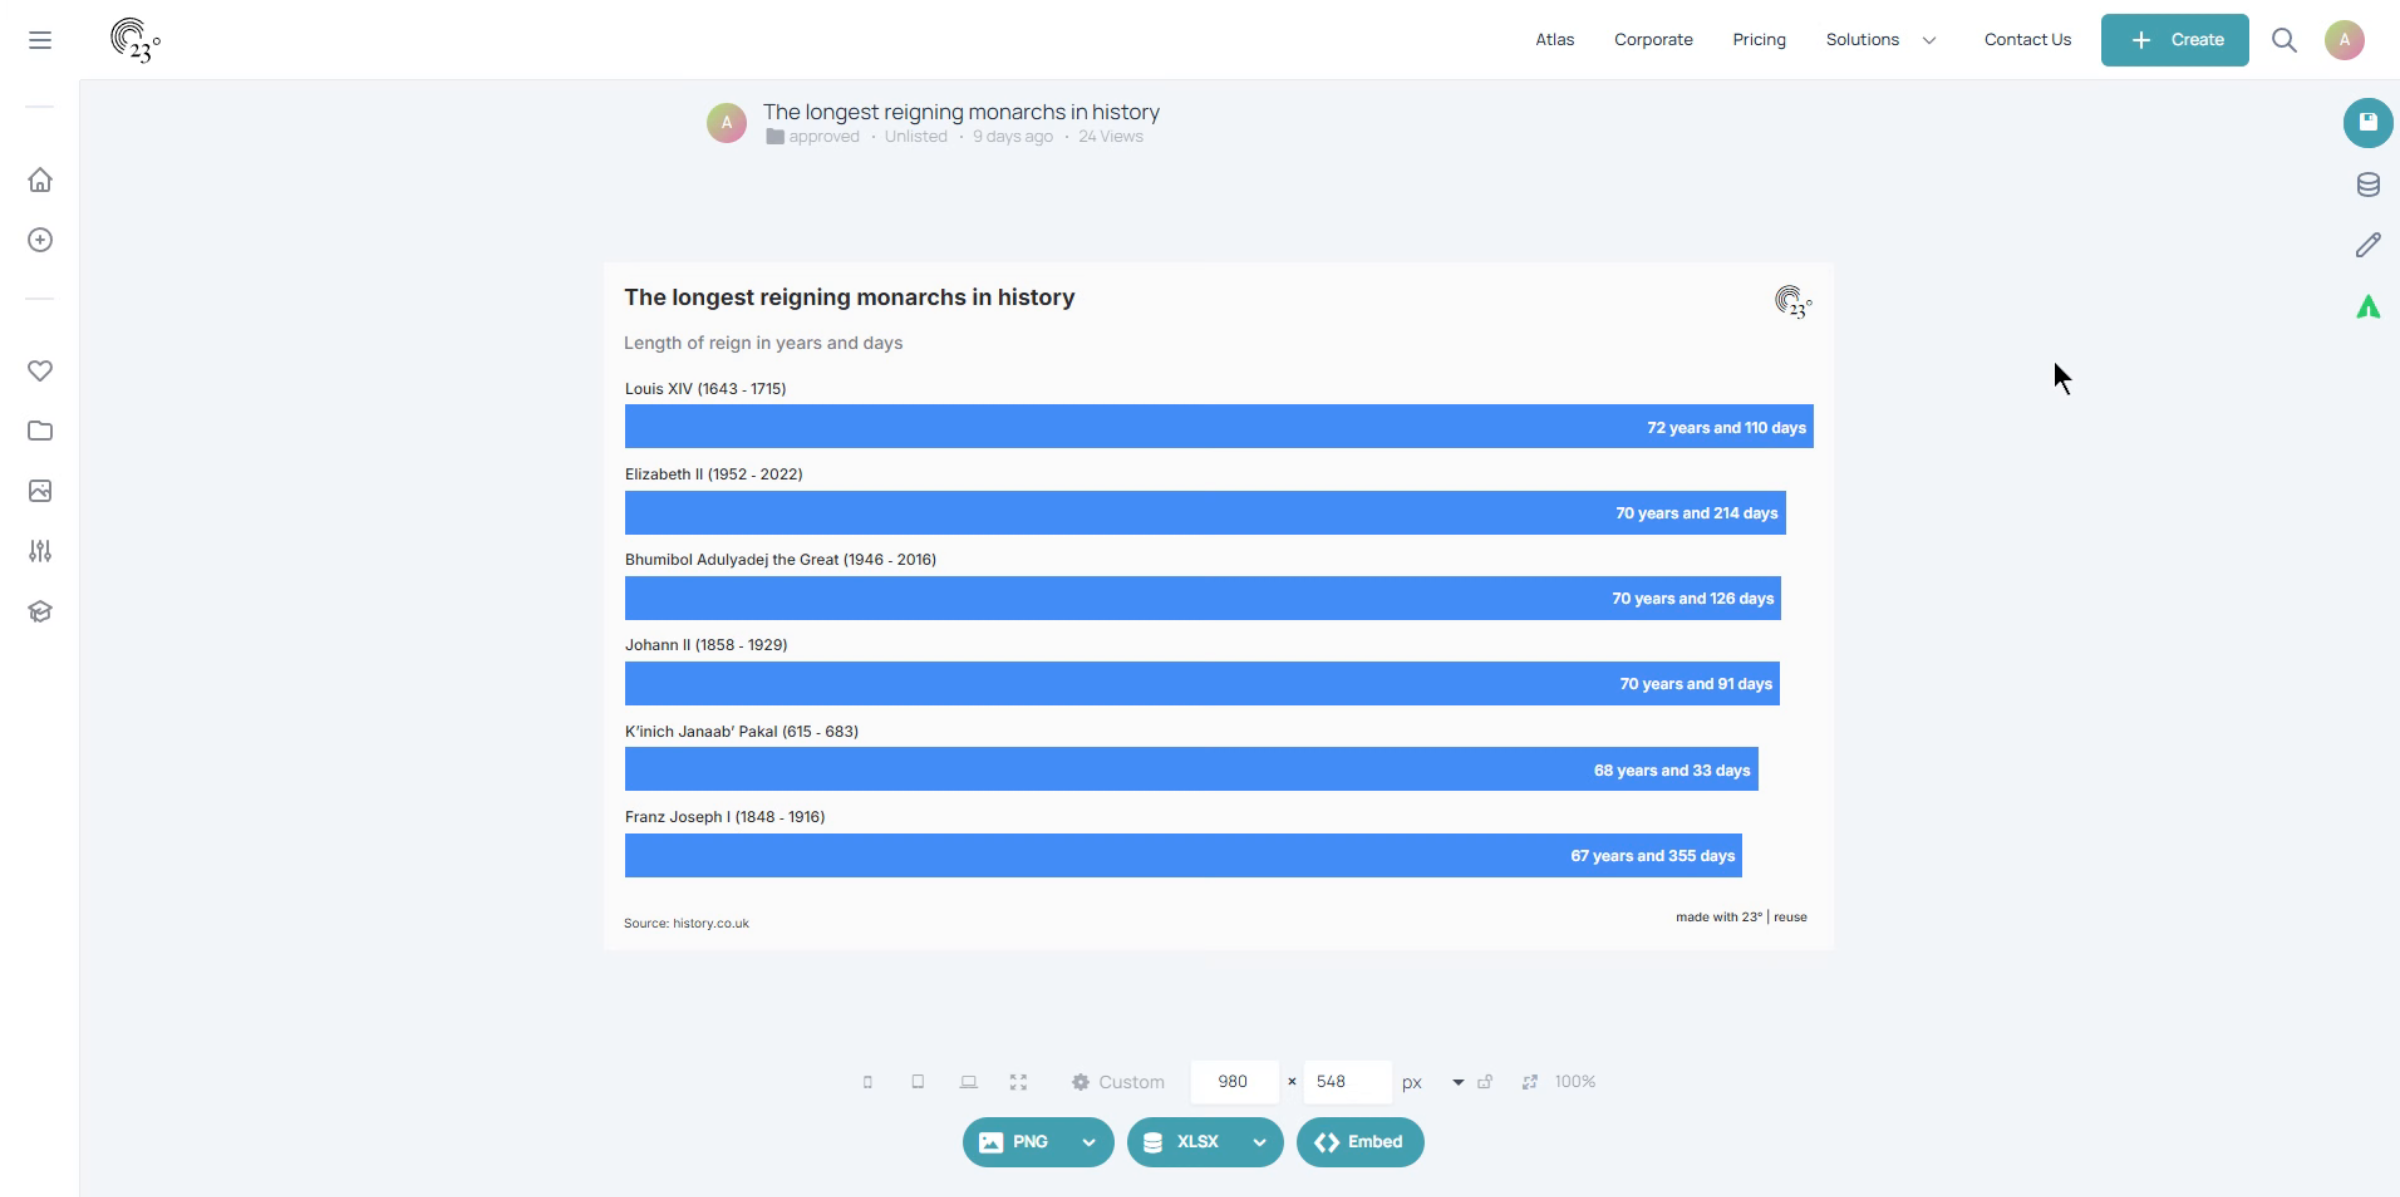
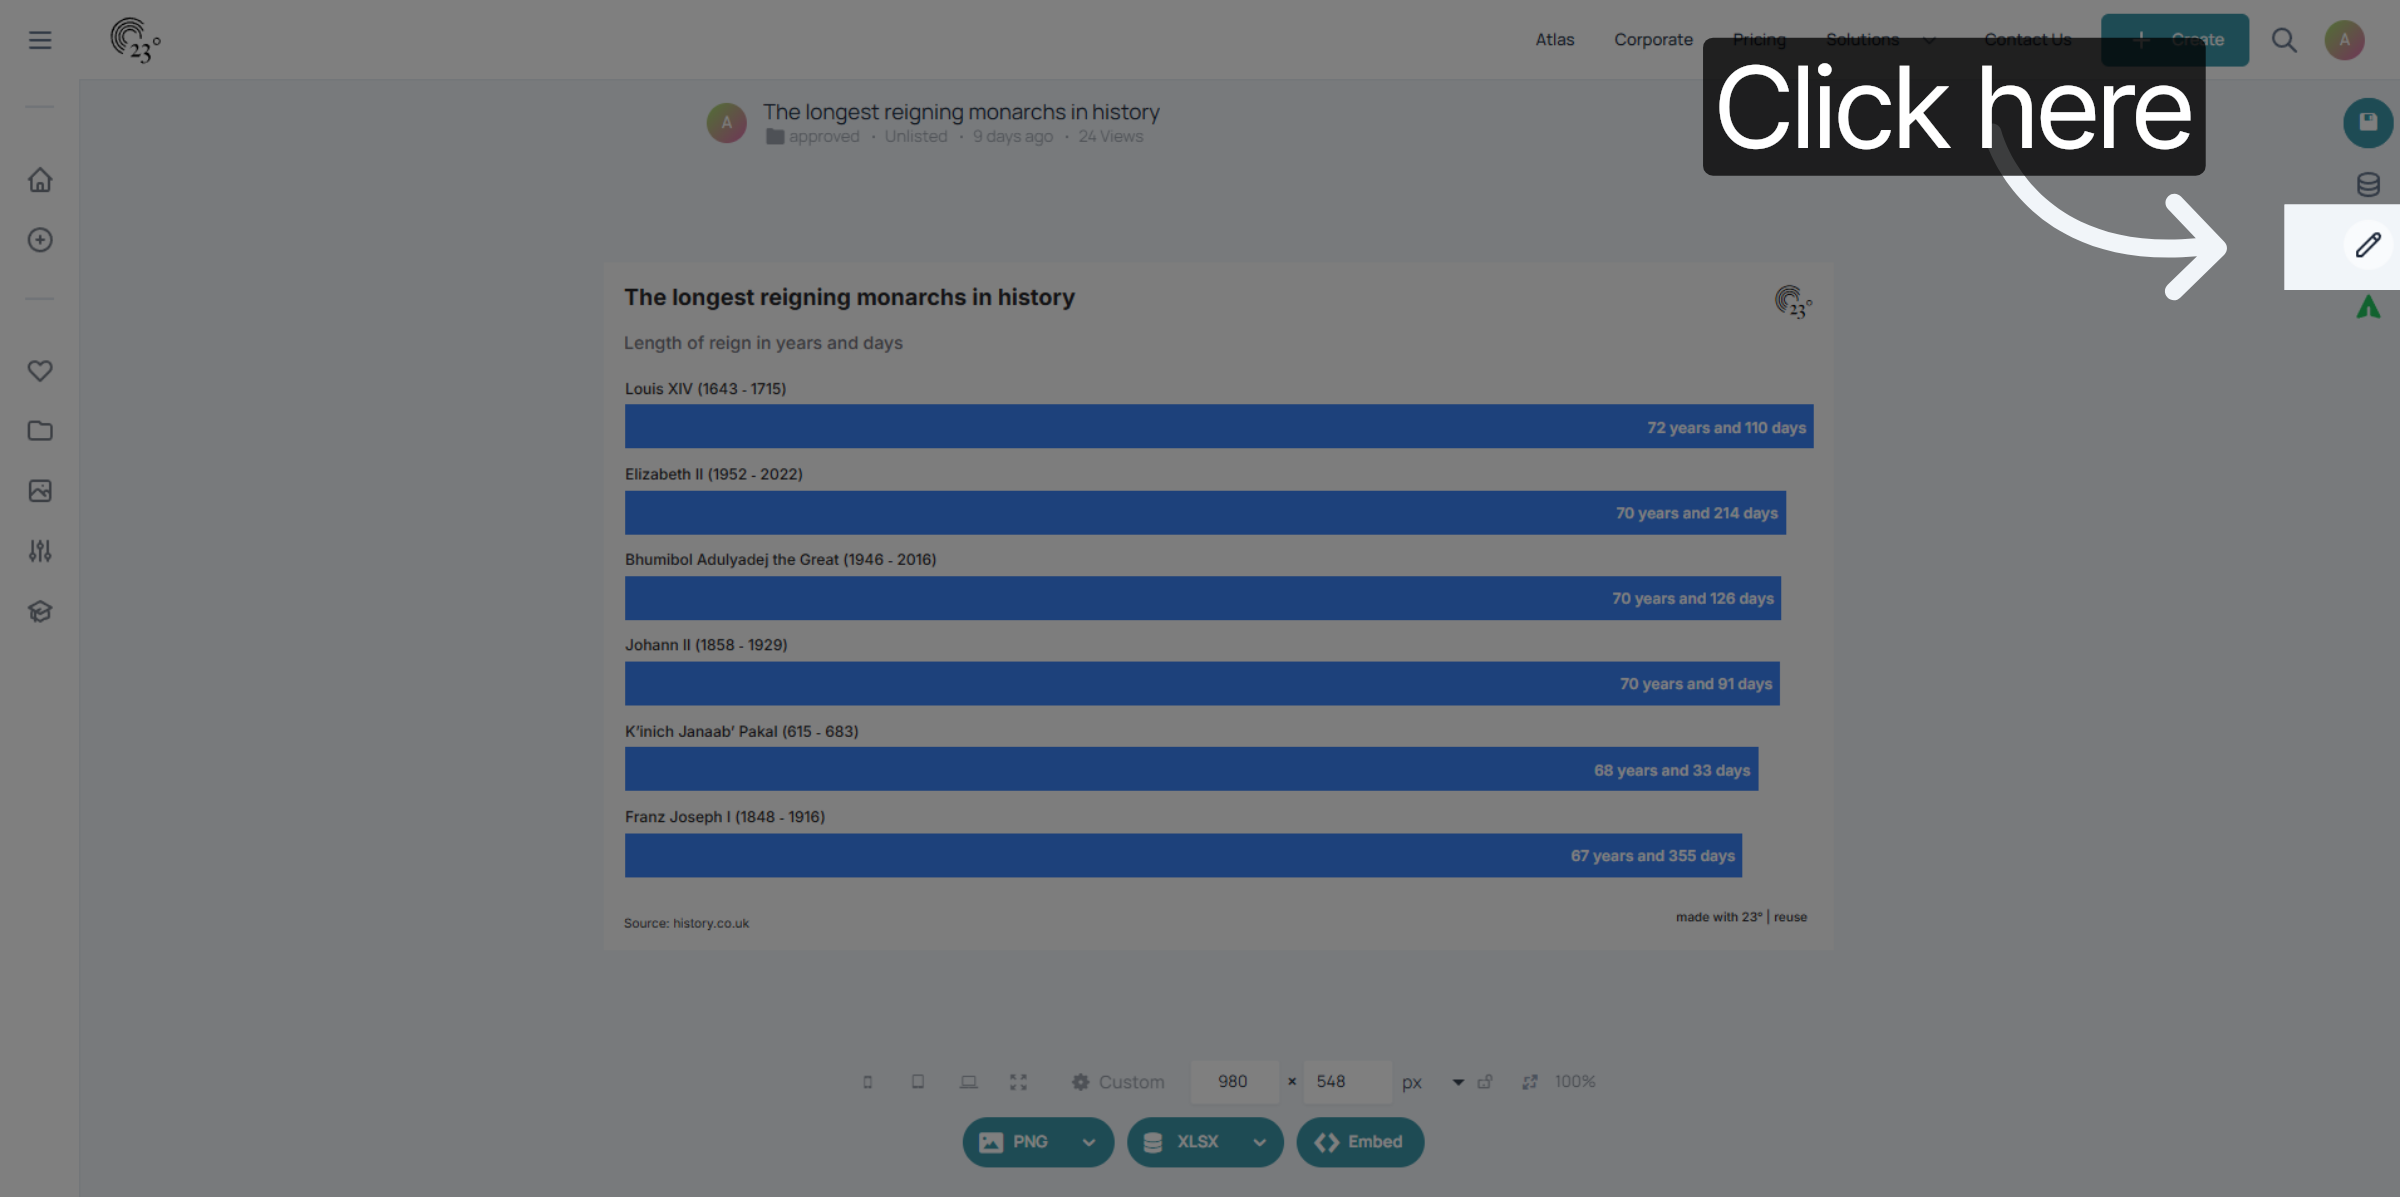
Click here to start editing.
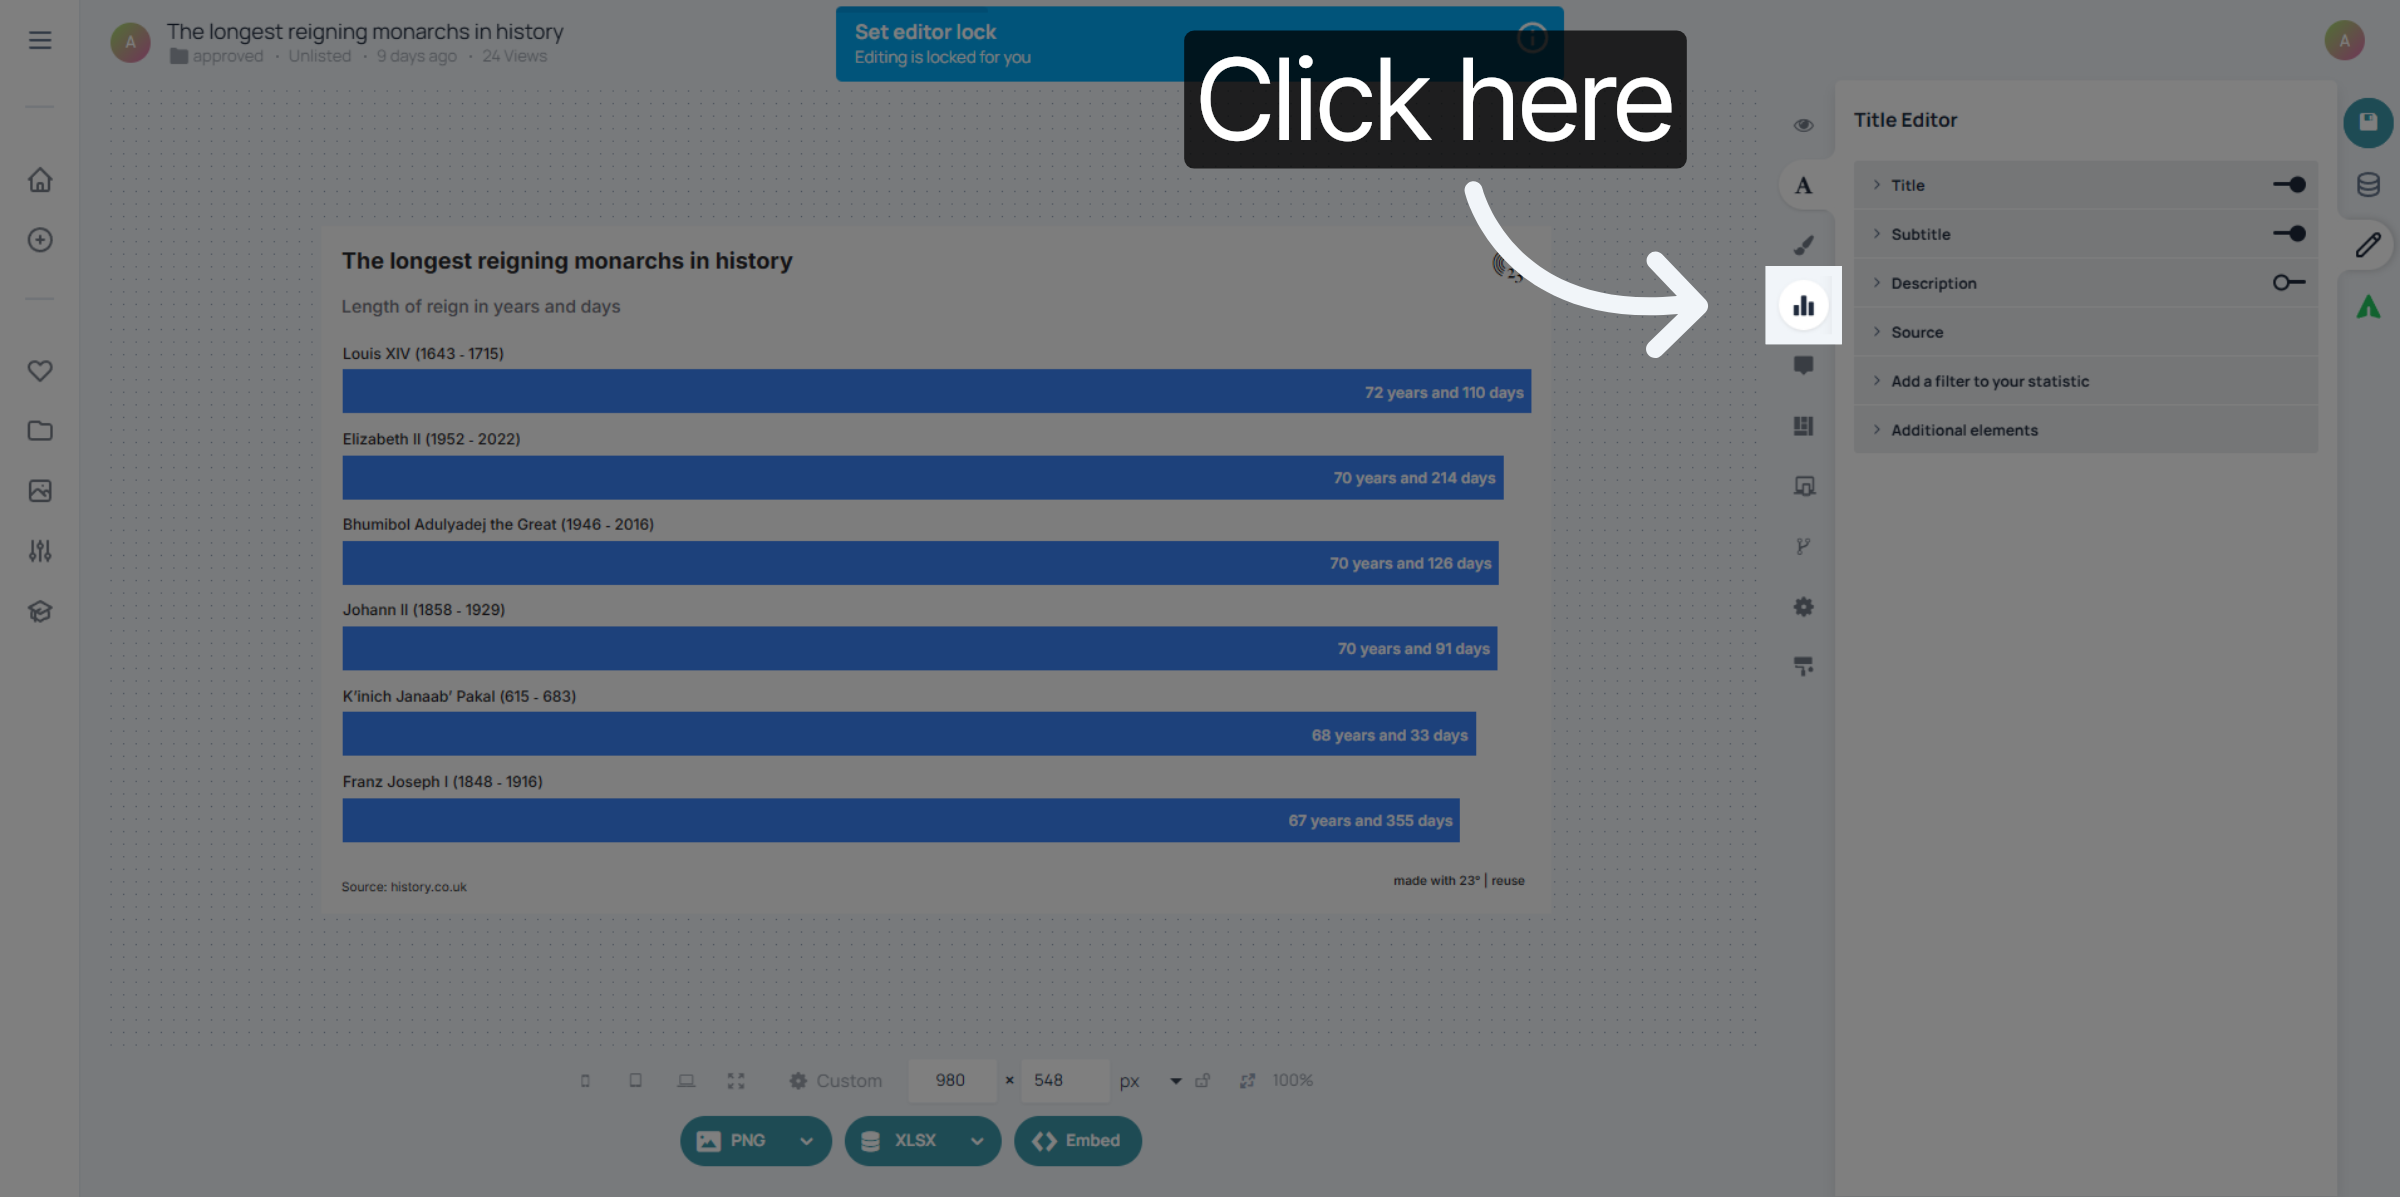
Go to the chart editor
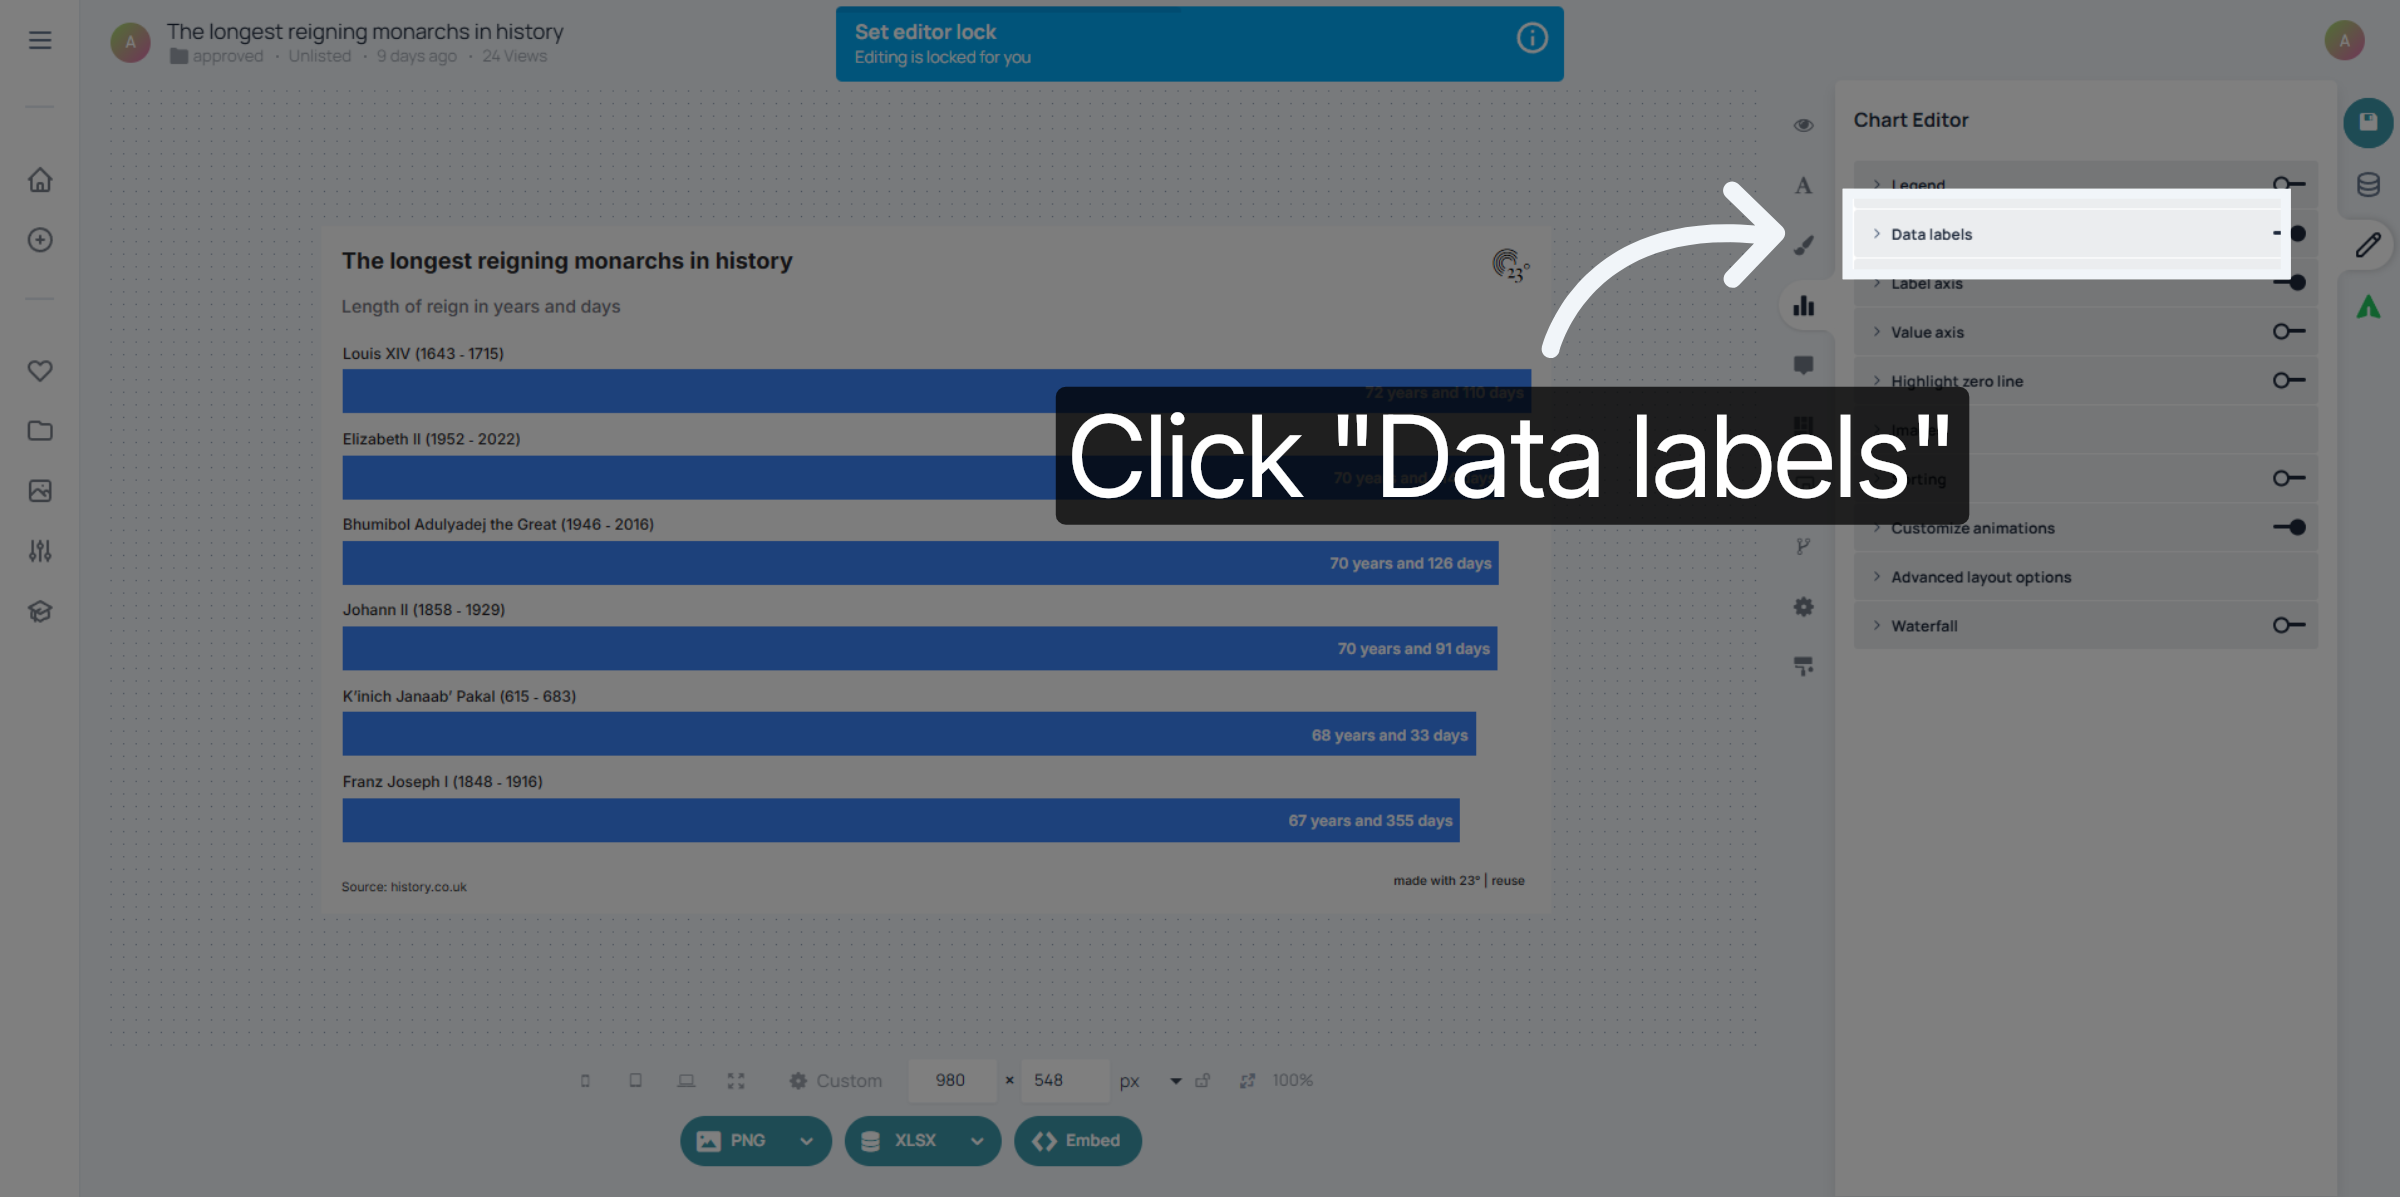
Click "Data labels" to open the label customization options.
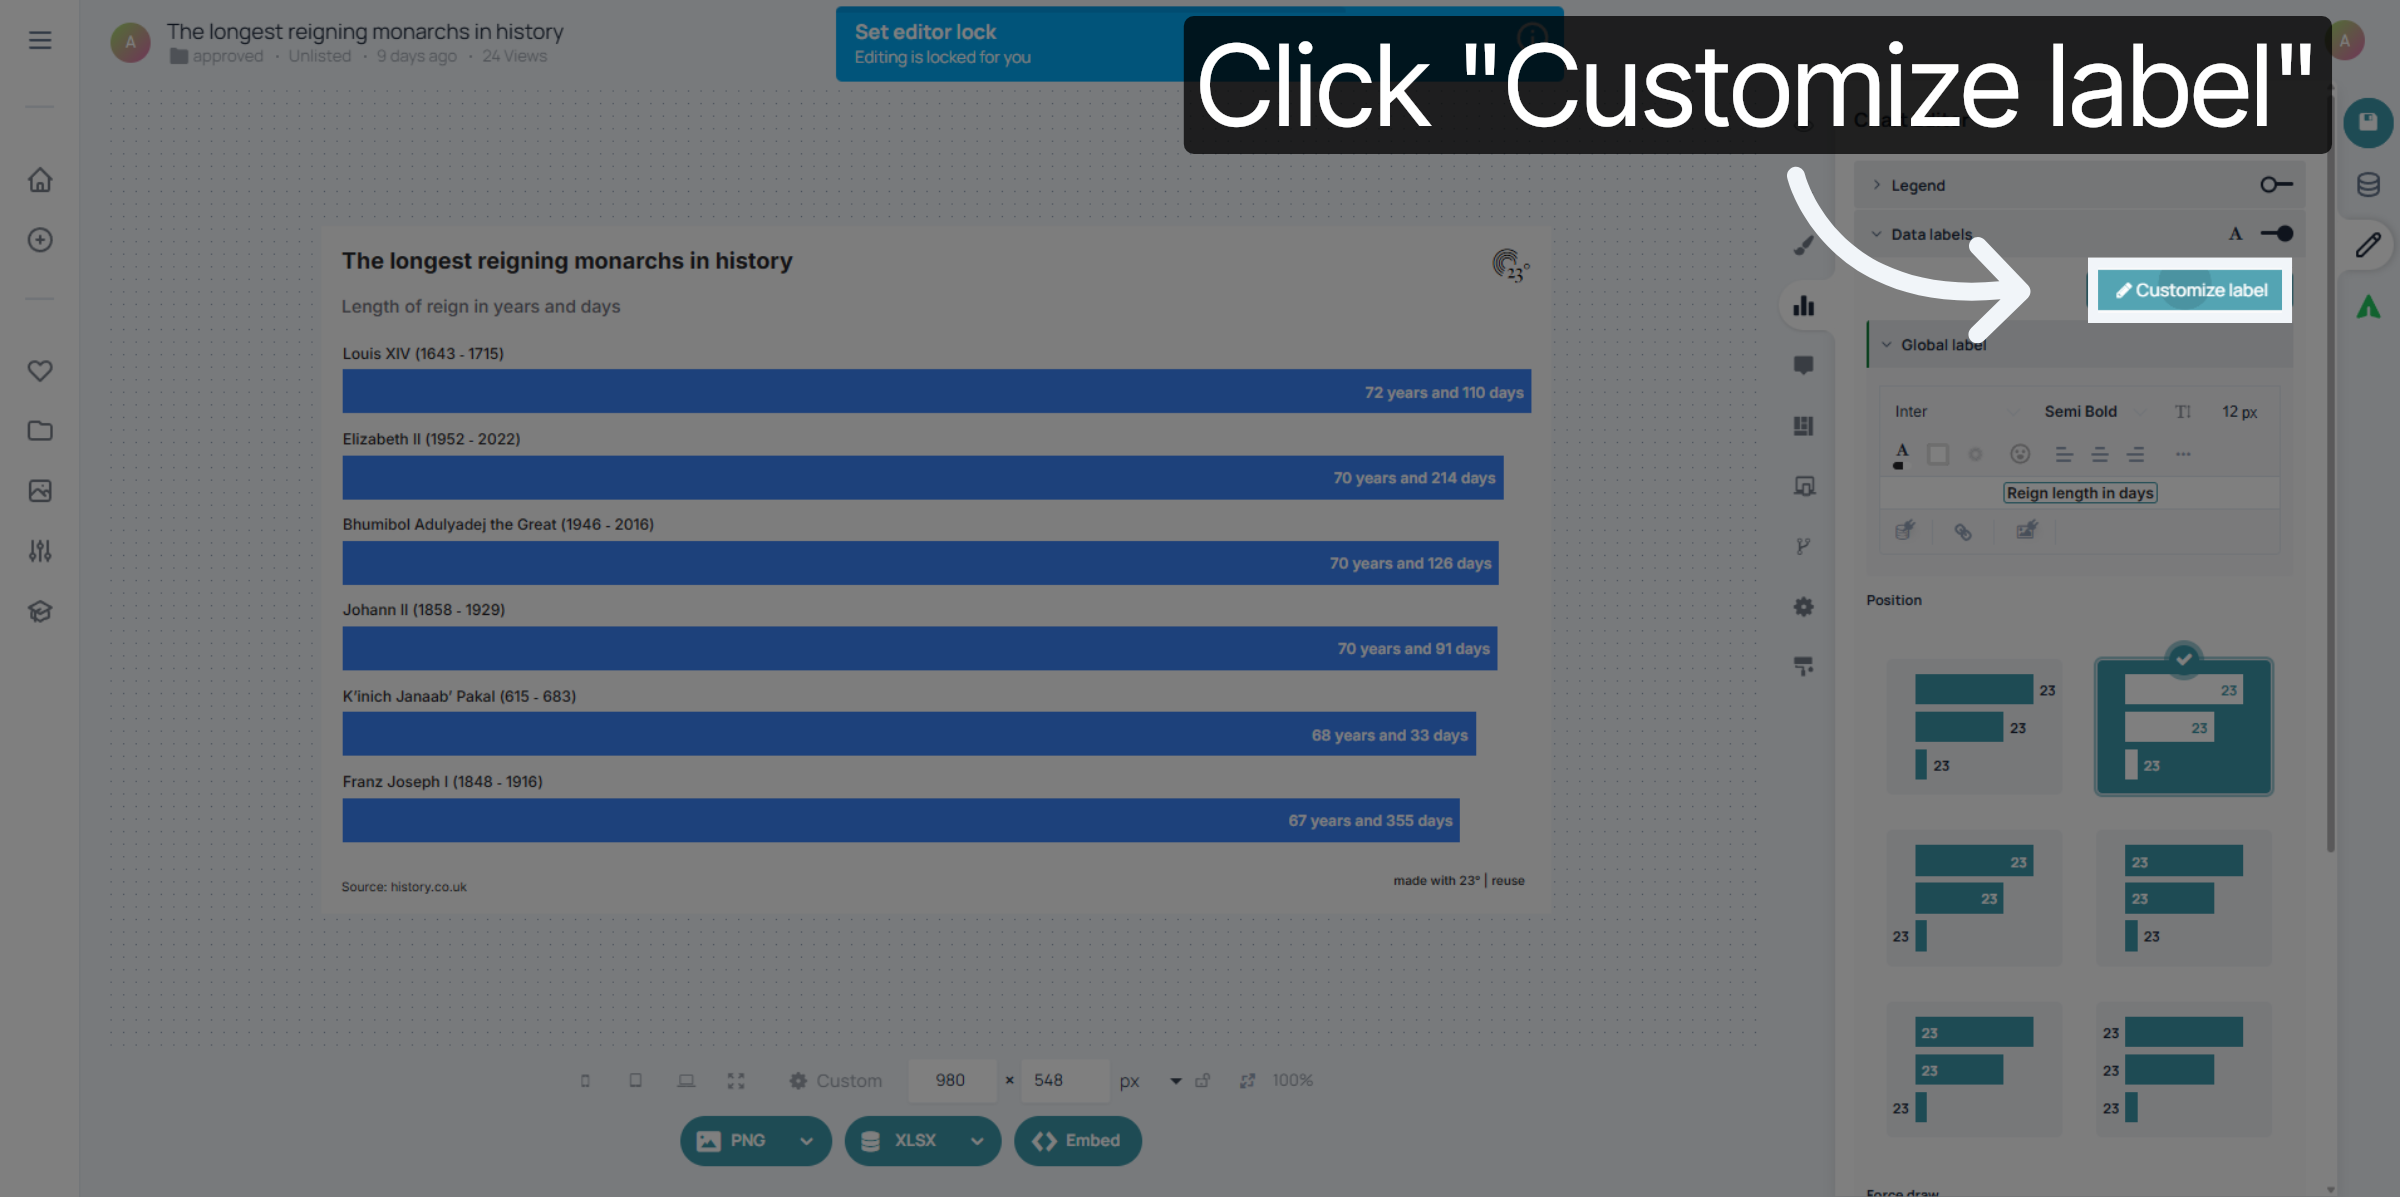
Click "Customize label" to begin editing specific label details.
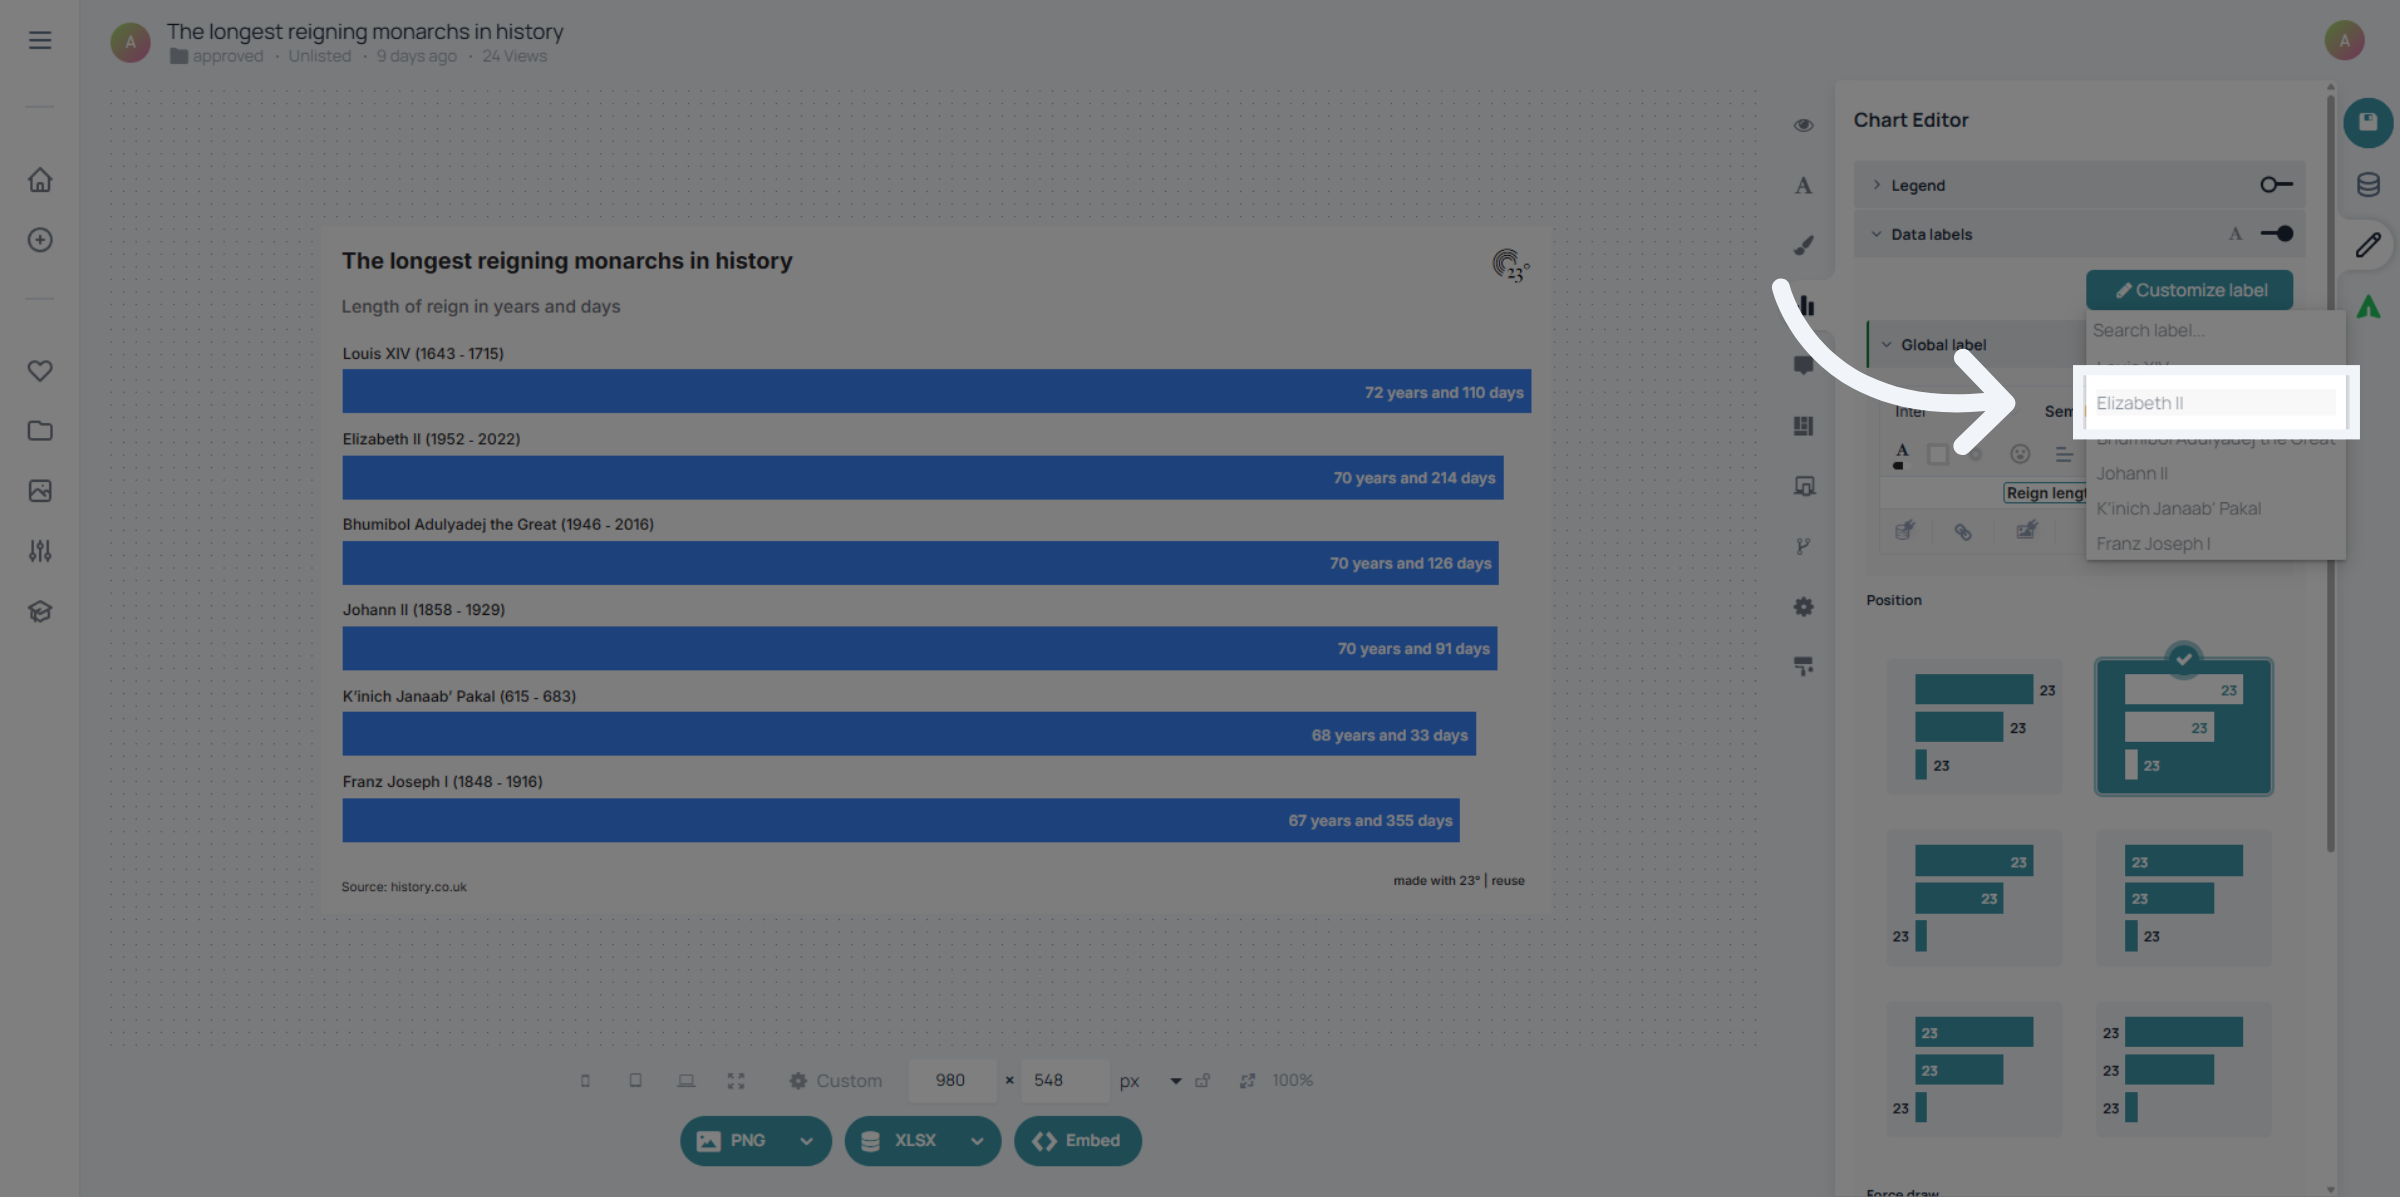
Select the Value Label that you want to customize
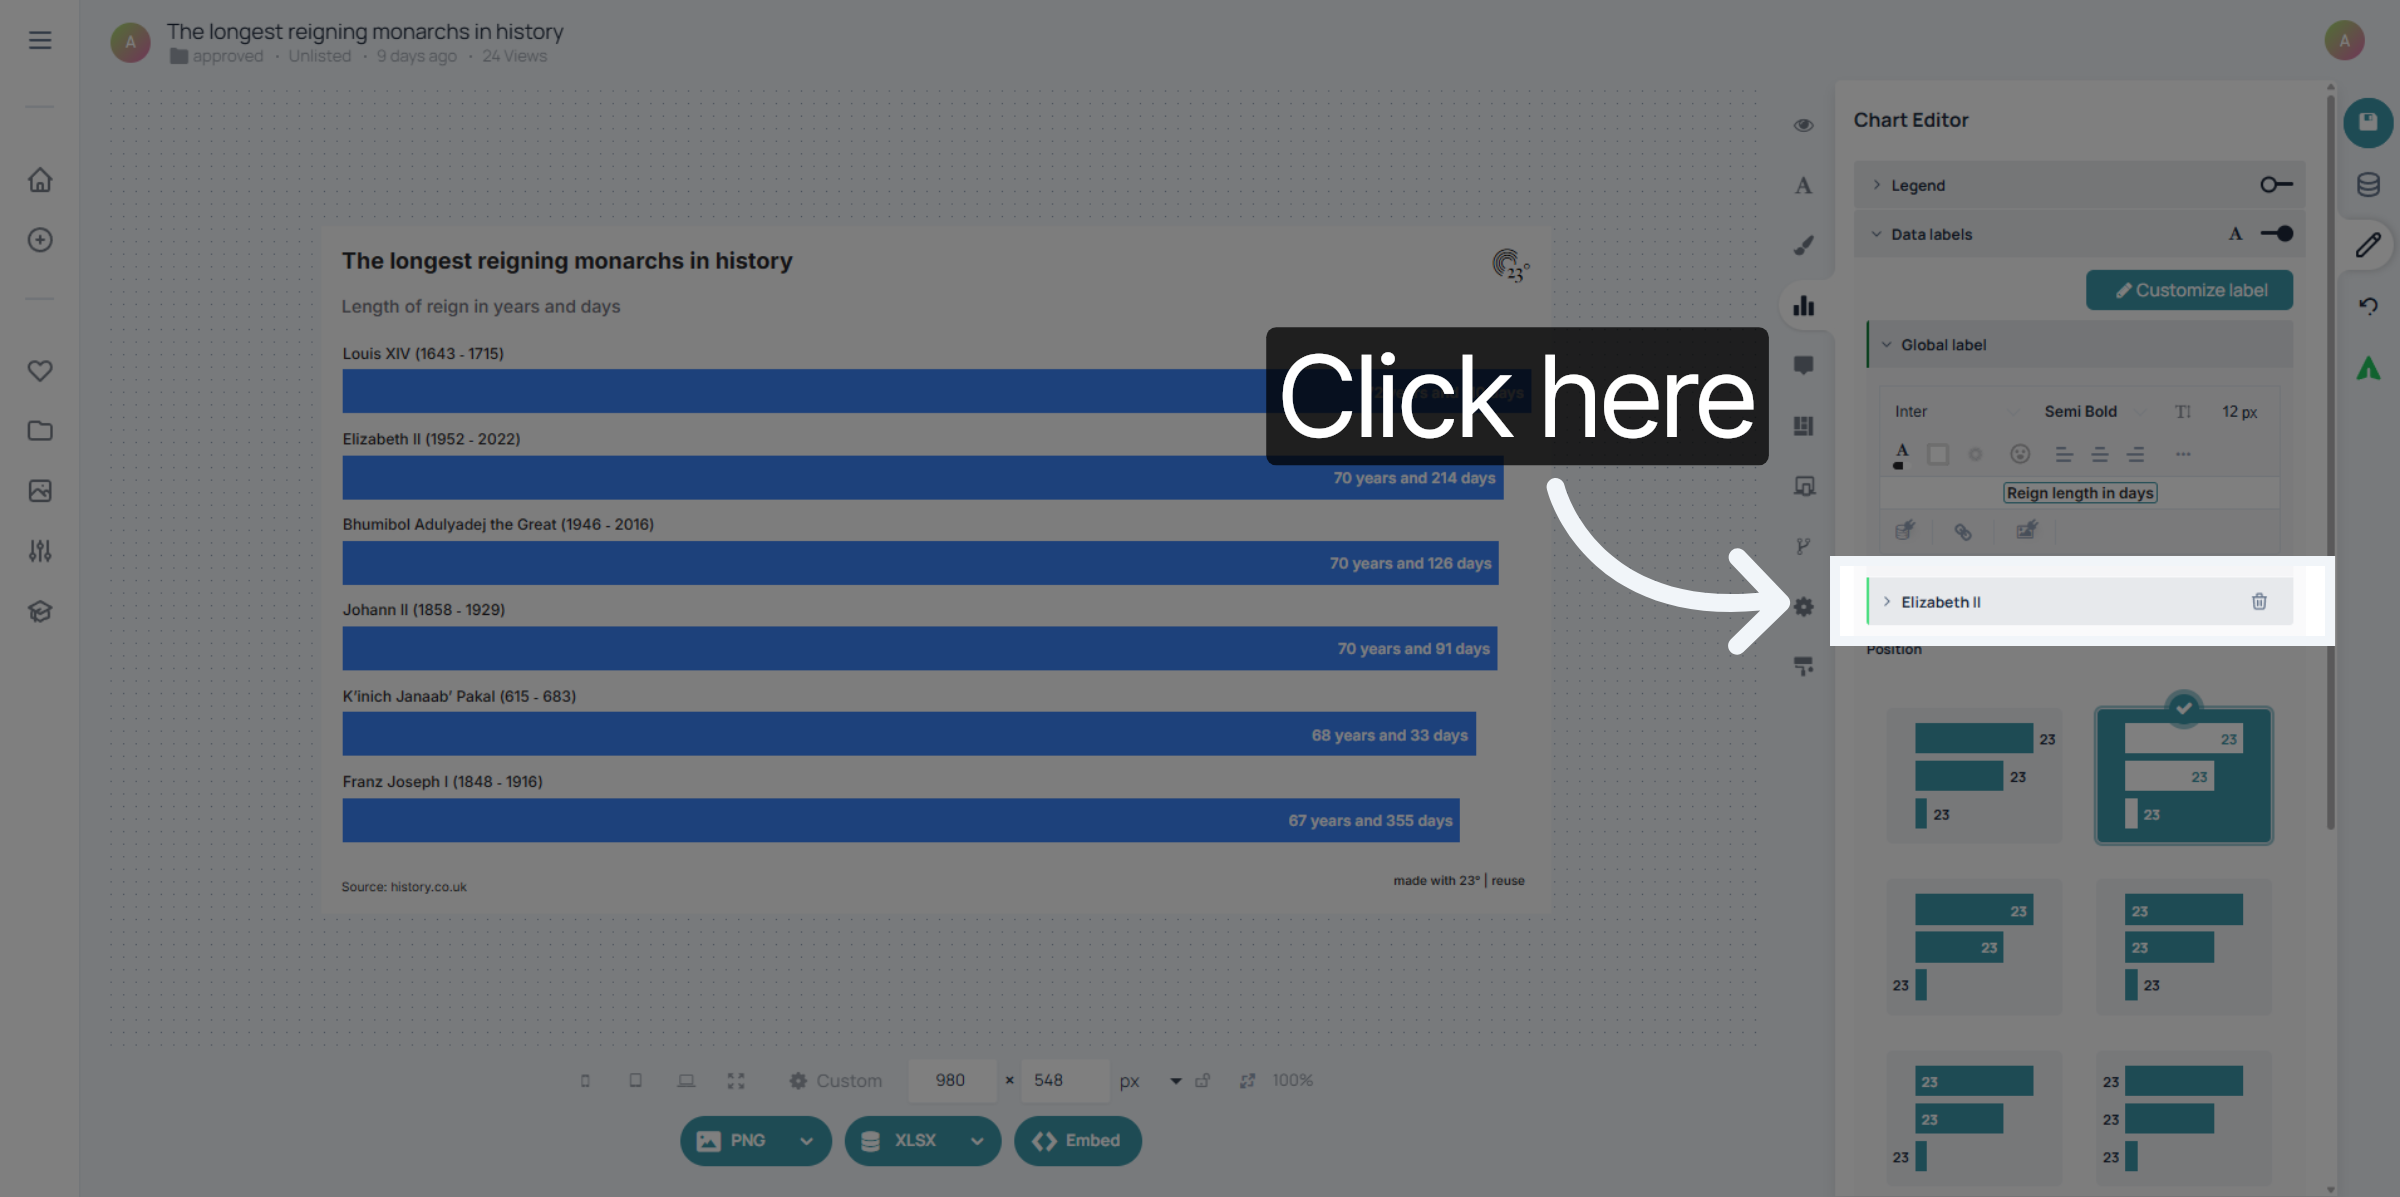
Your custom label settings are now visible under the global label settings. click on it to start editing.
Select the Data field to customize font size, font style, allignment or colouring.
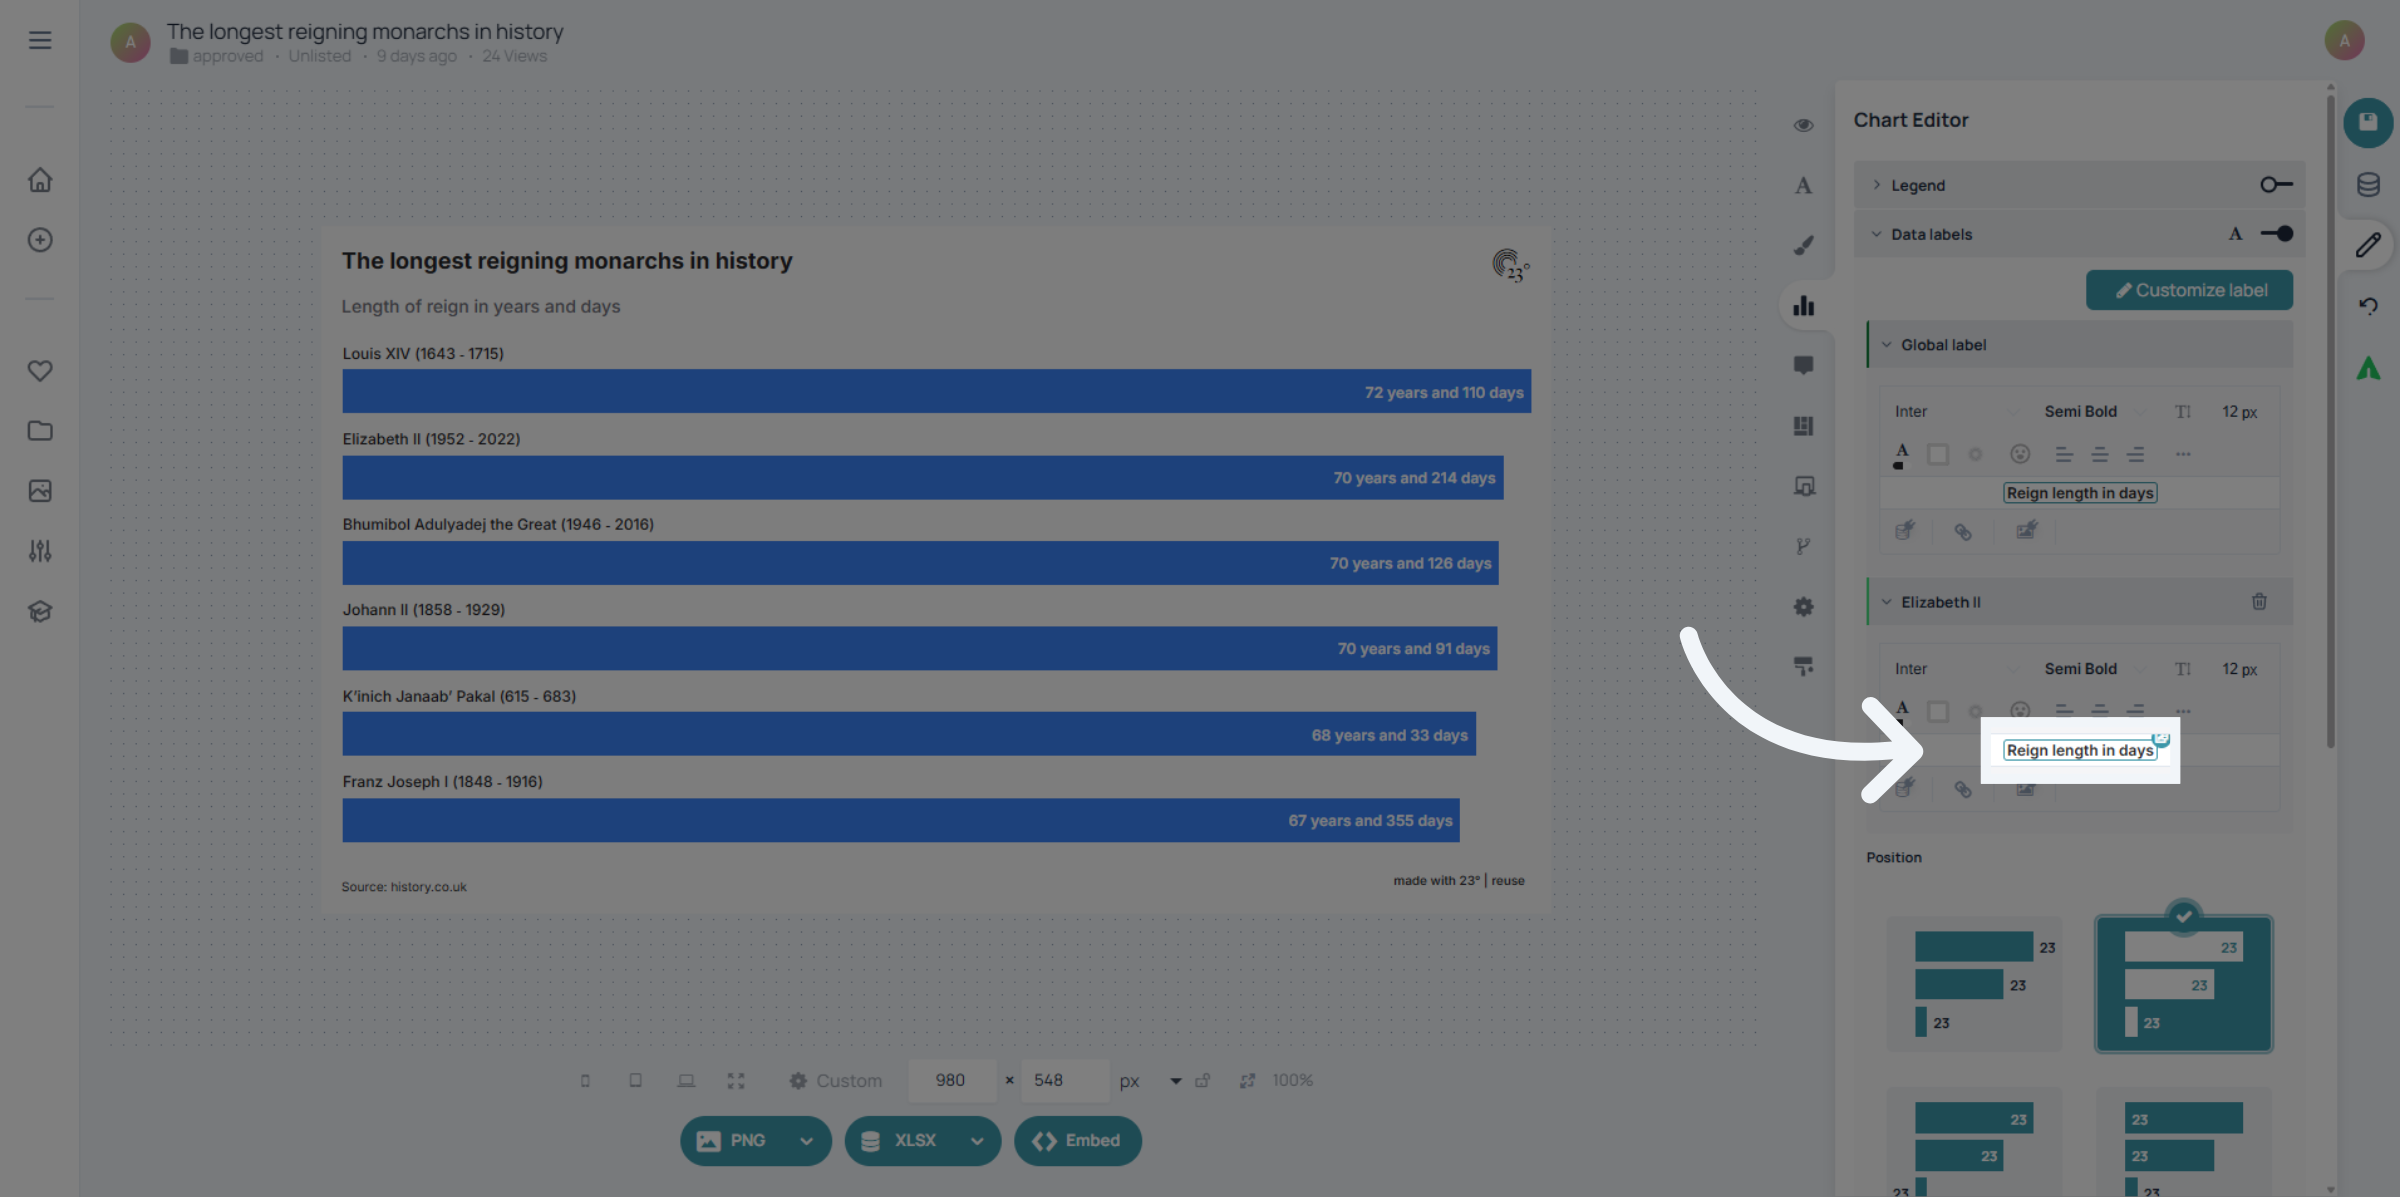
Your value label is now displaying in a custom styling.
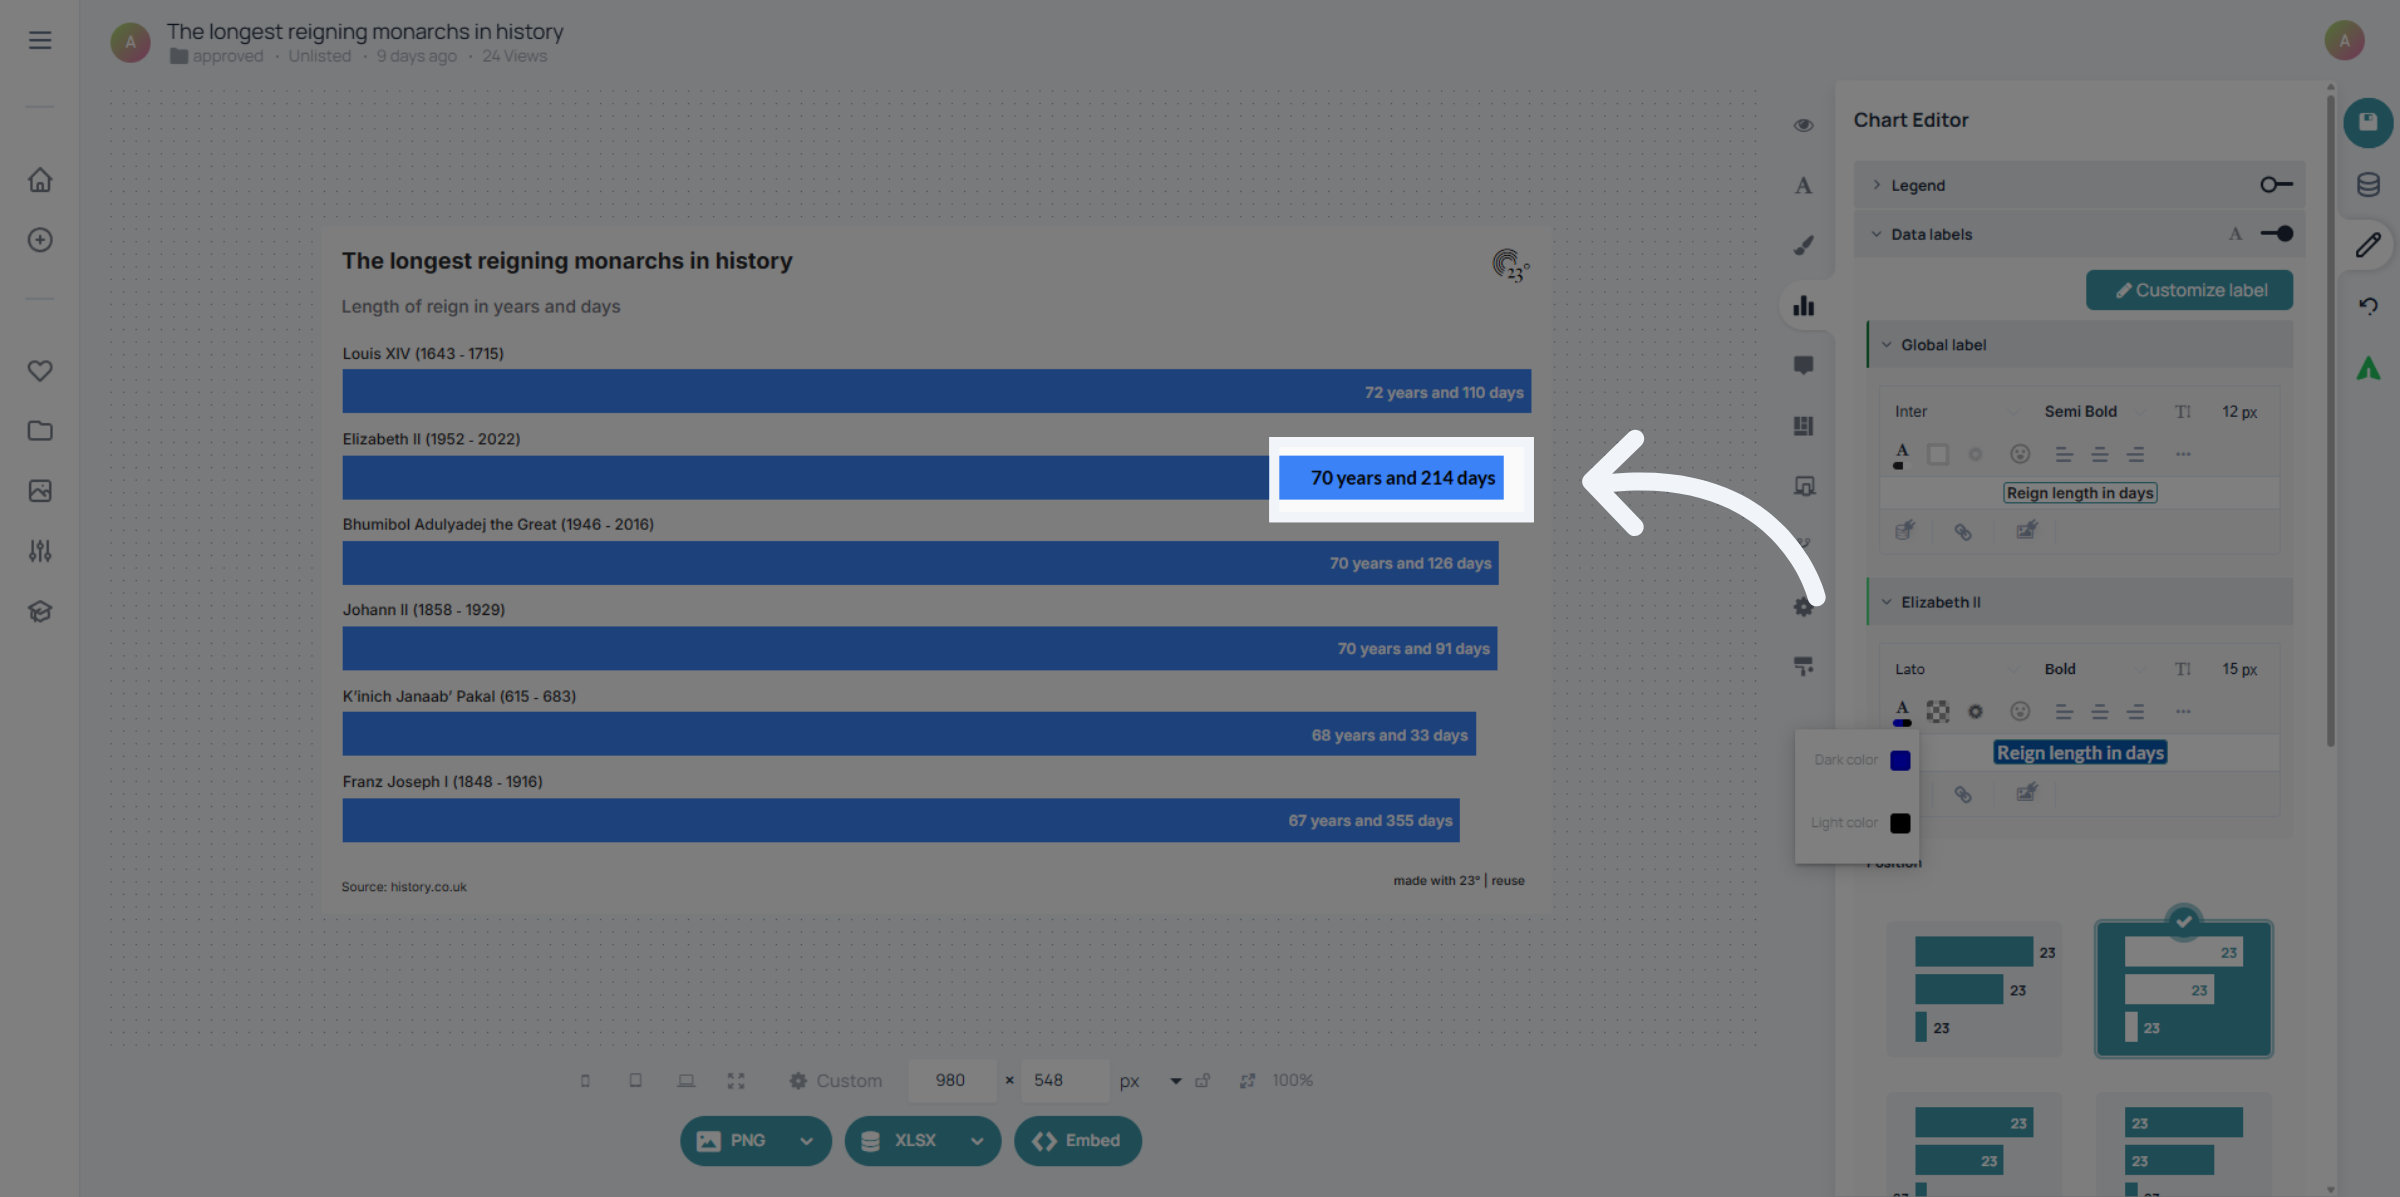
You have successfully customized specific labels within the 23degrees application by adjusting label selections, font styles, and settings. These changes enhance data presentation and allow you to highlight single elements of your chart.