How to add country flags to visualisations
This tutorial explains how to add flags to your visualisations
1. Check your dataset
To add country flags to your visualisation, you need to make sure your dataset contains a Geo column.
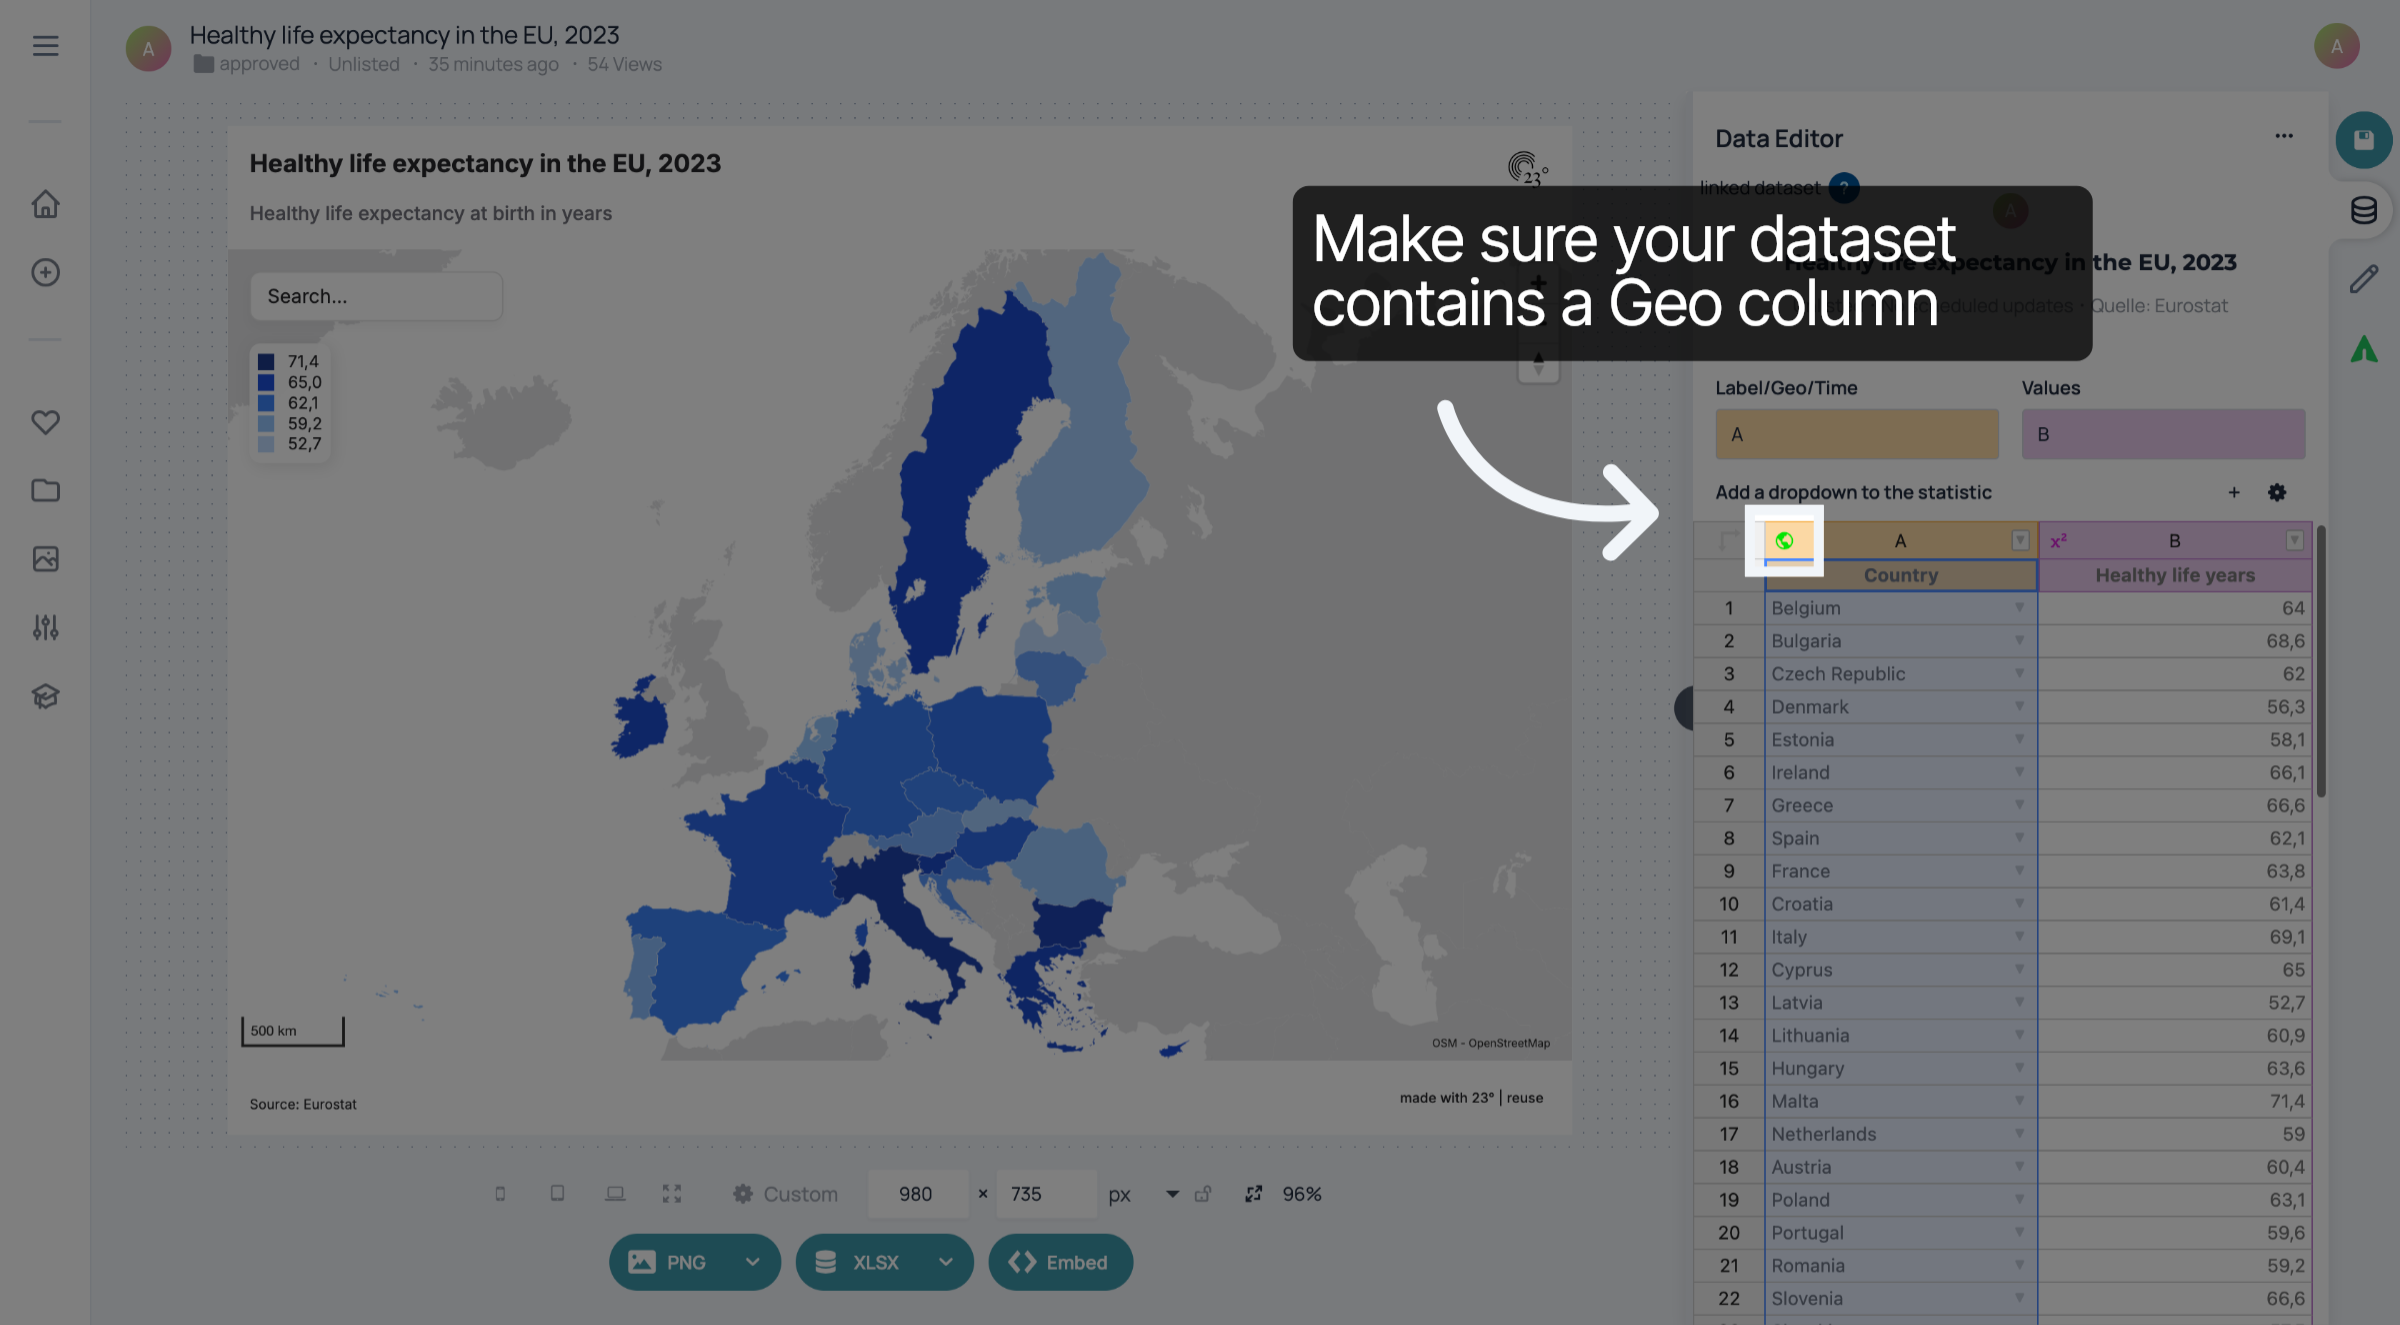
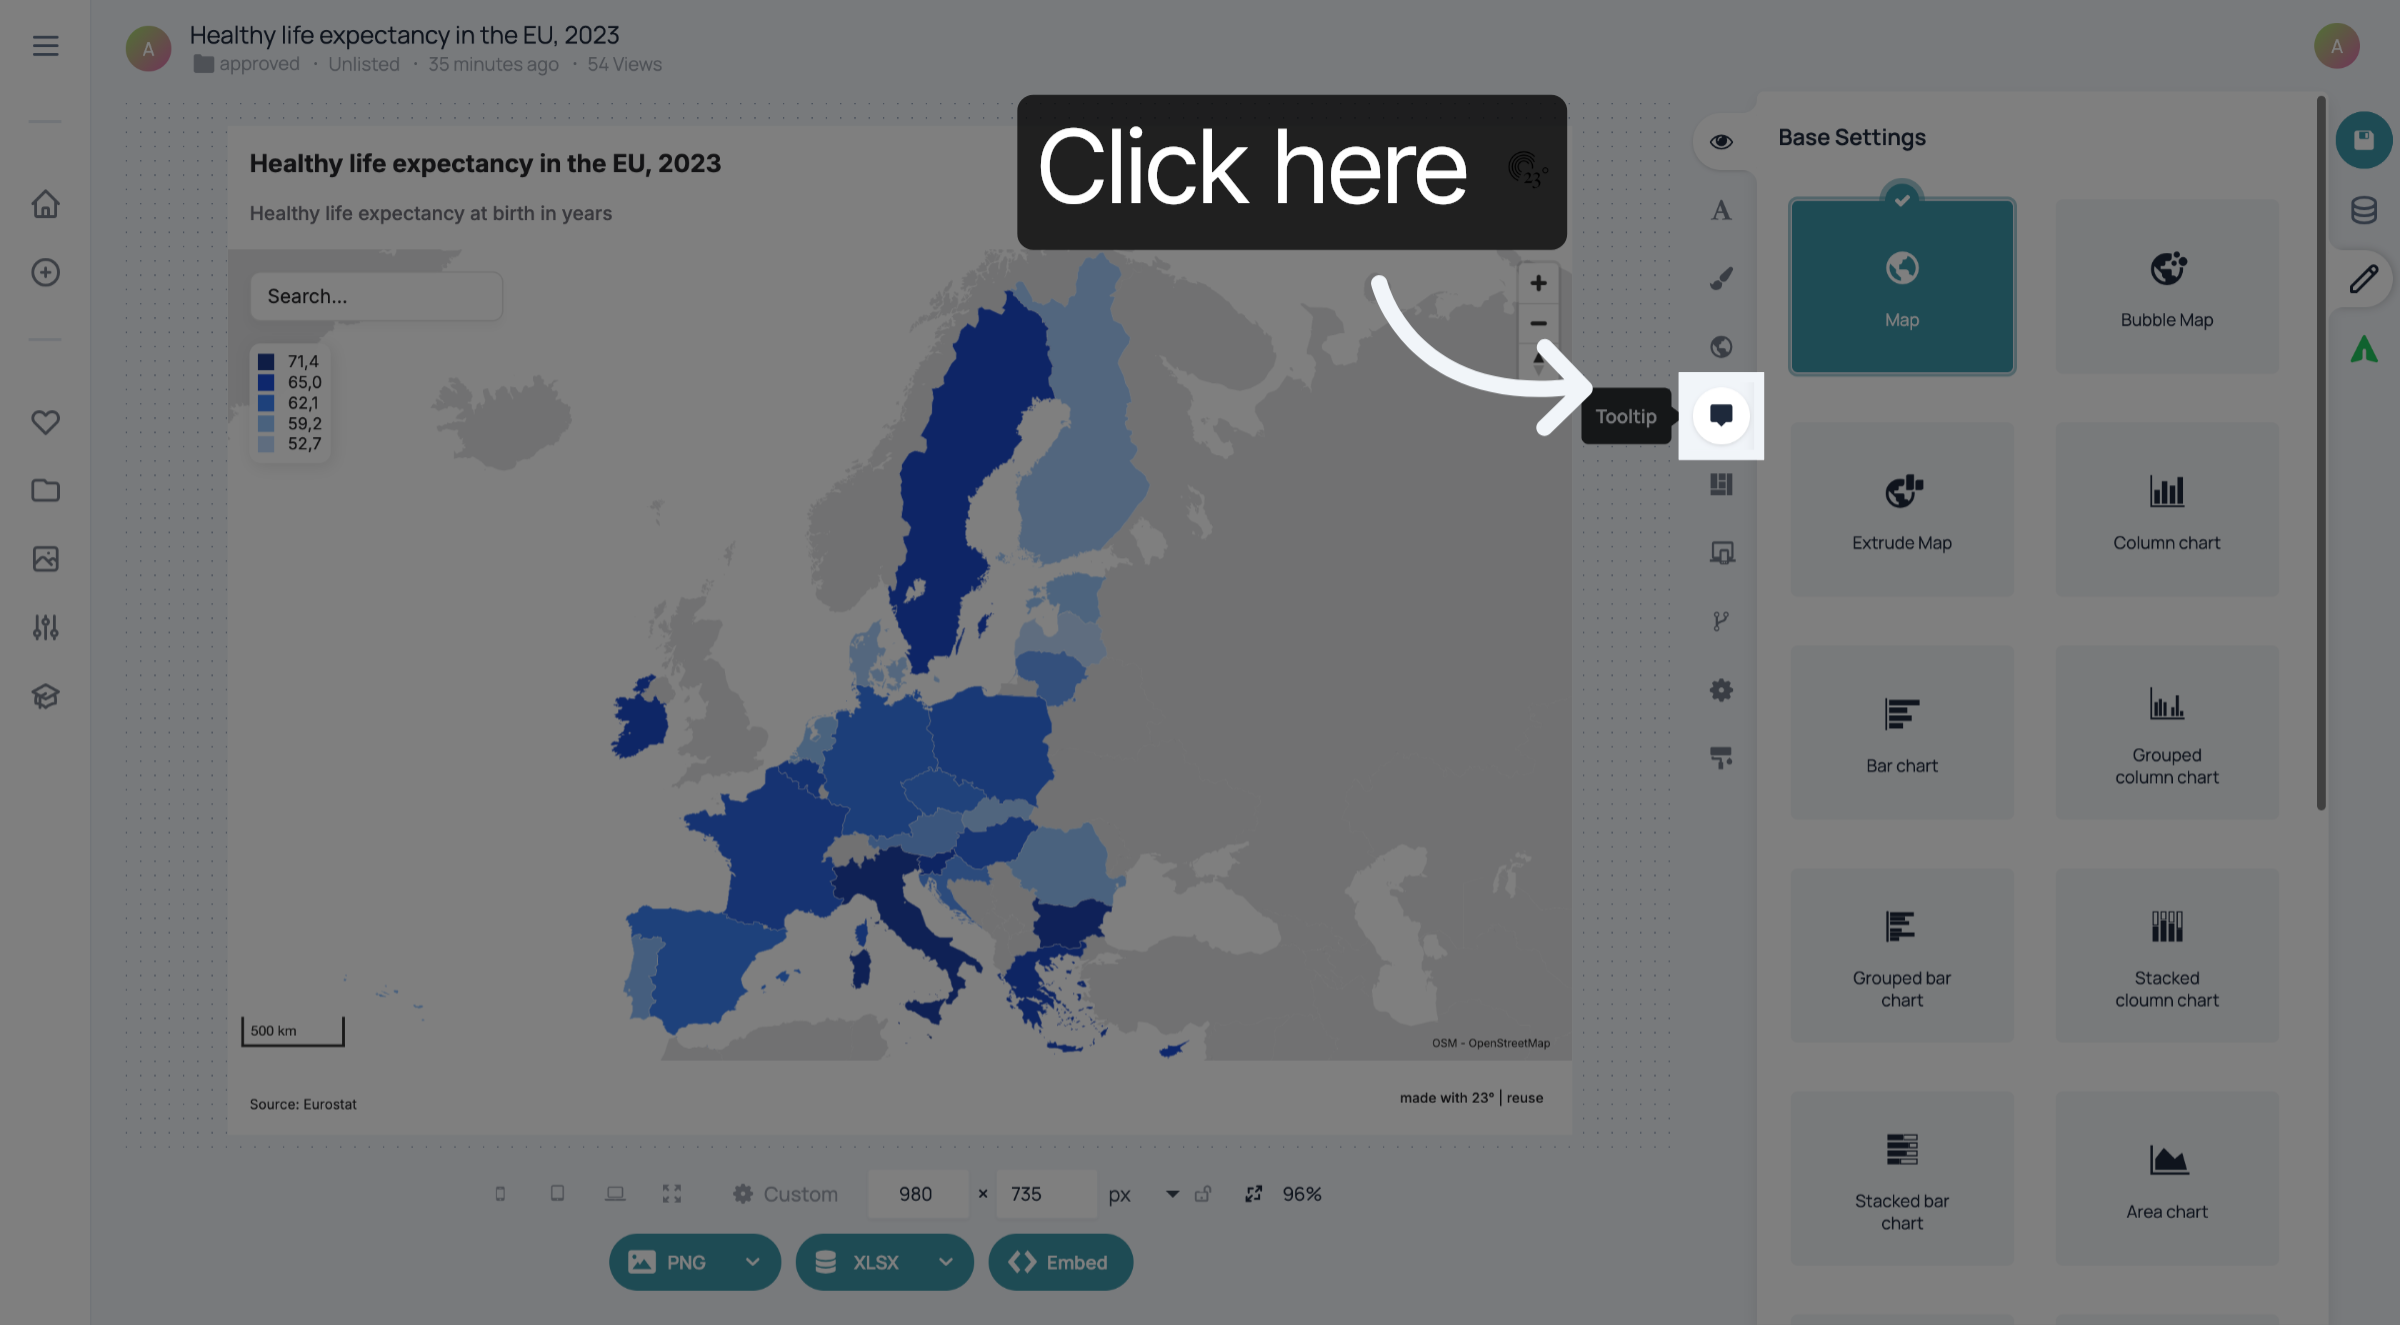
2. Go to text field
Next, go to the text field that you want to add the flags to. In our expamle, it's the tooltip.
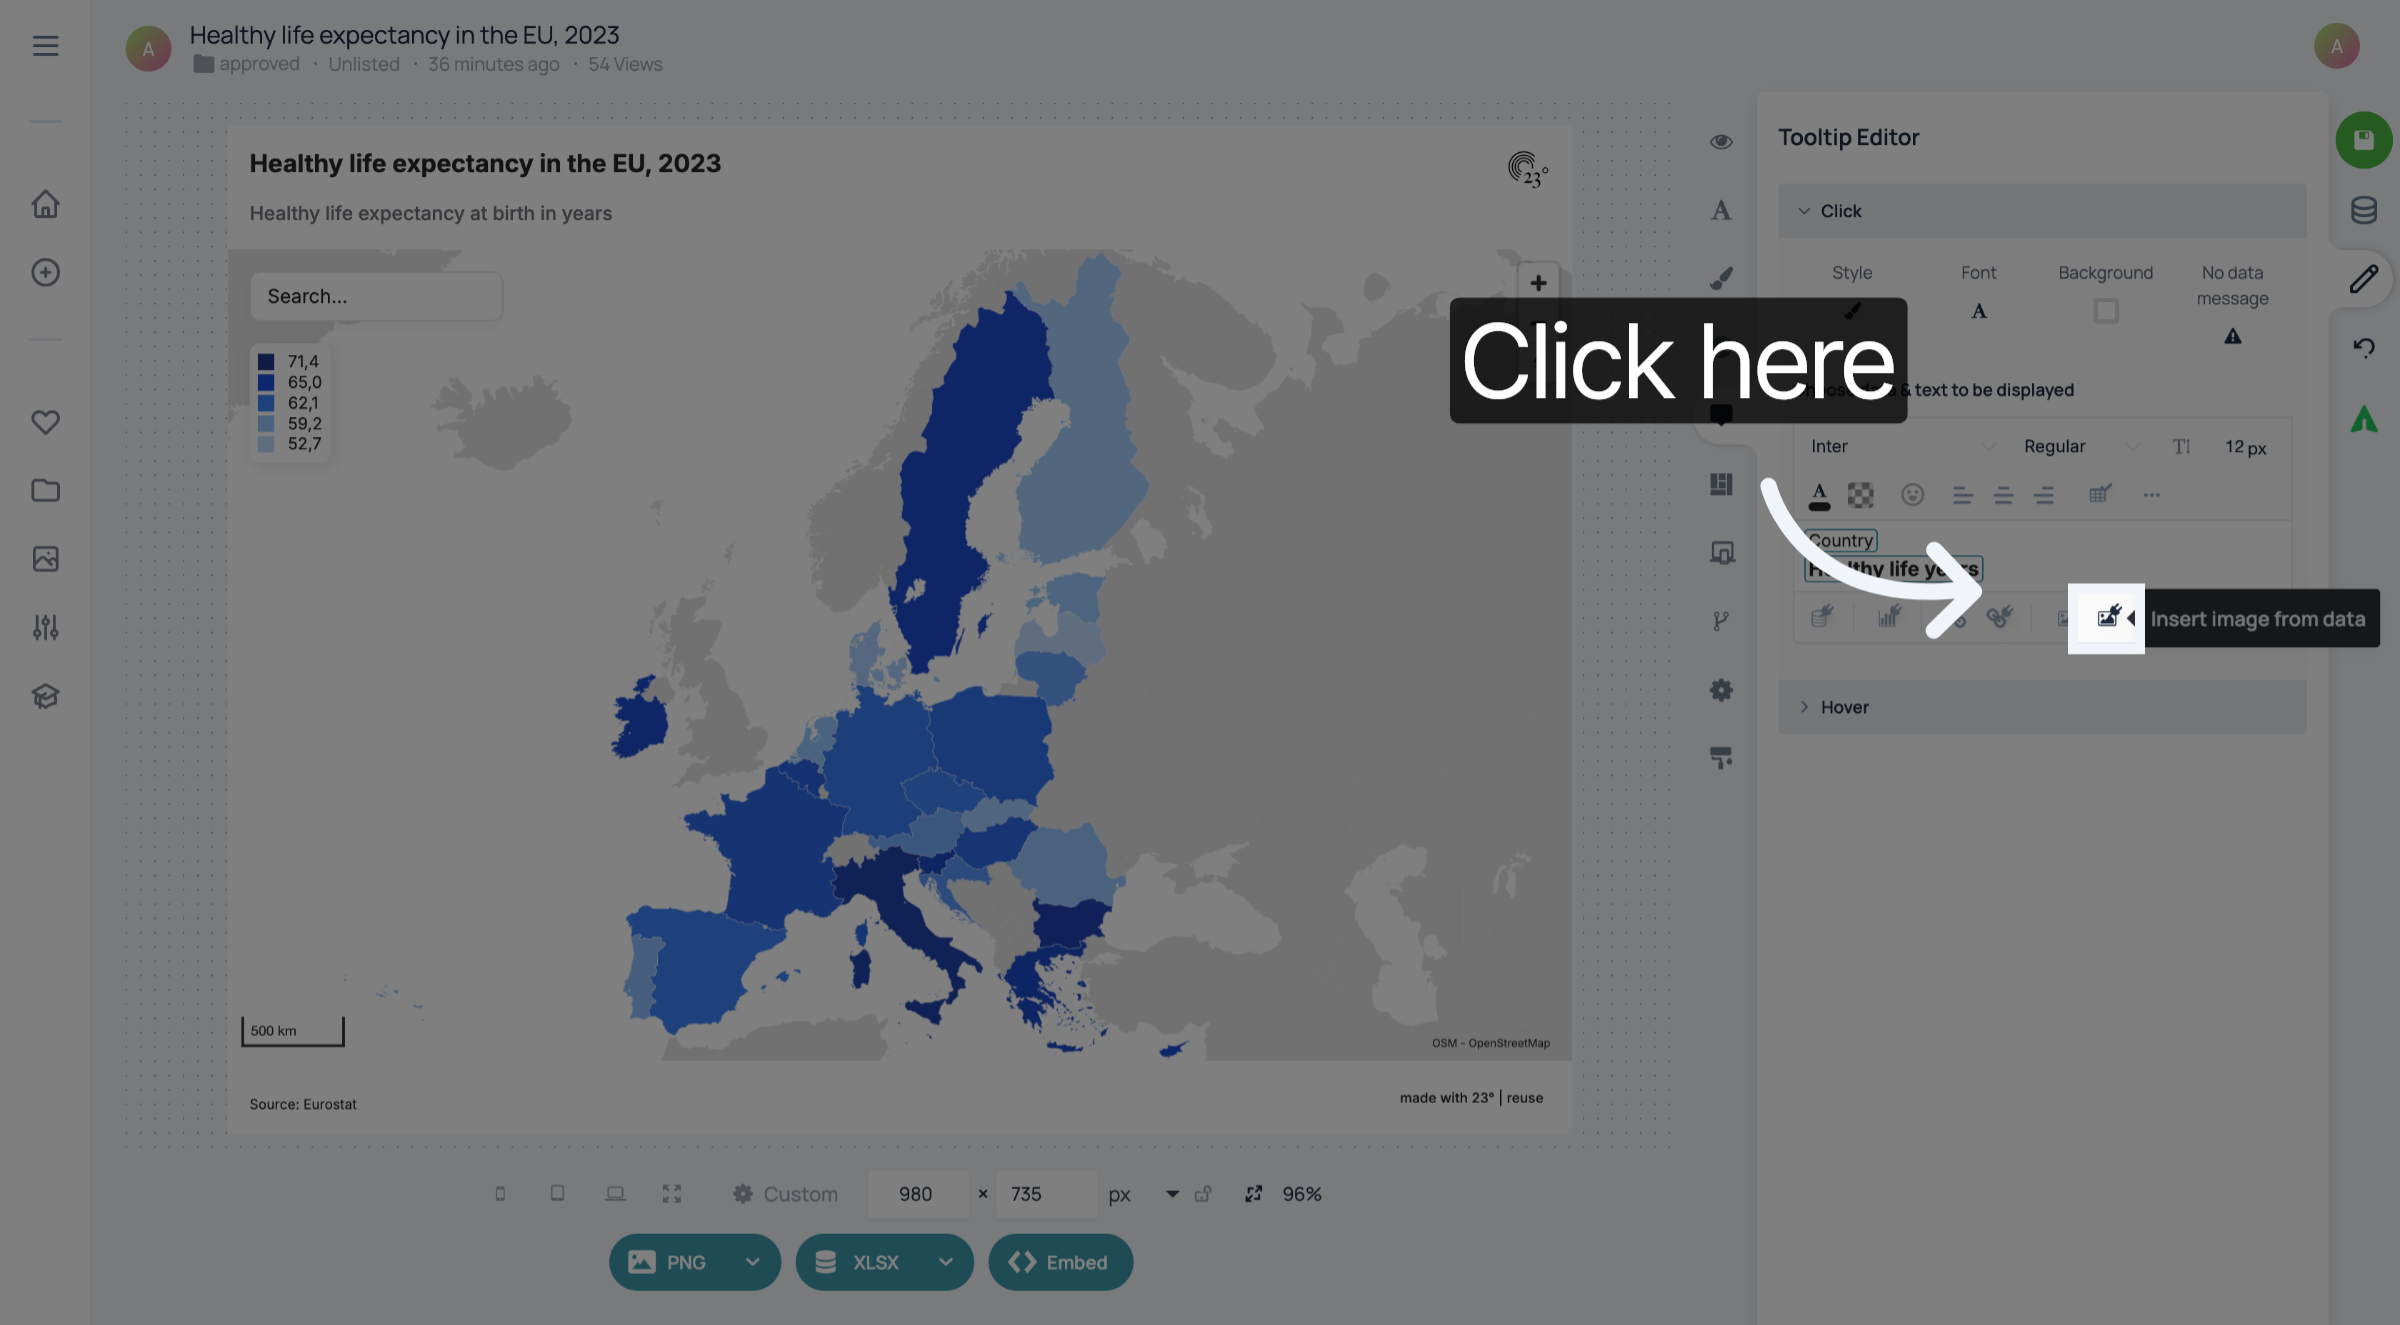
3. Click "Insert image from data"
Click "Insert image from data".
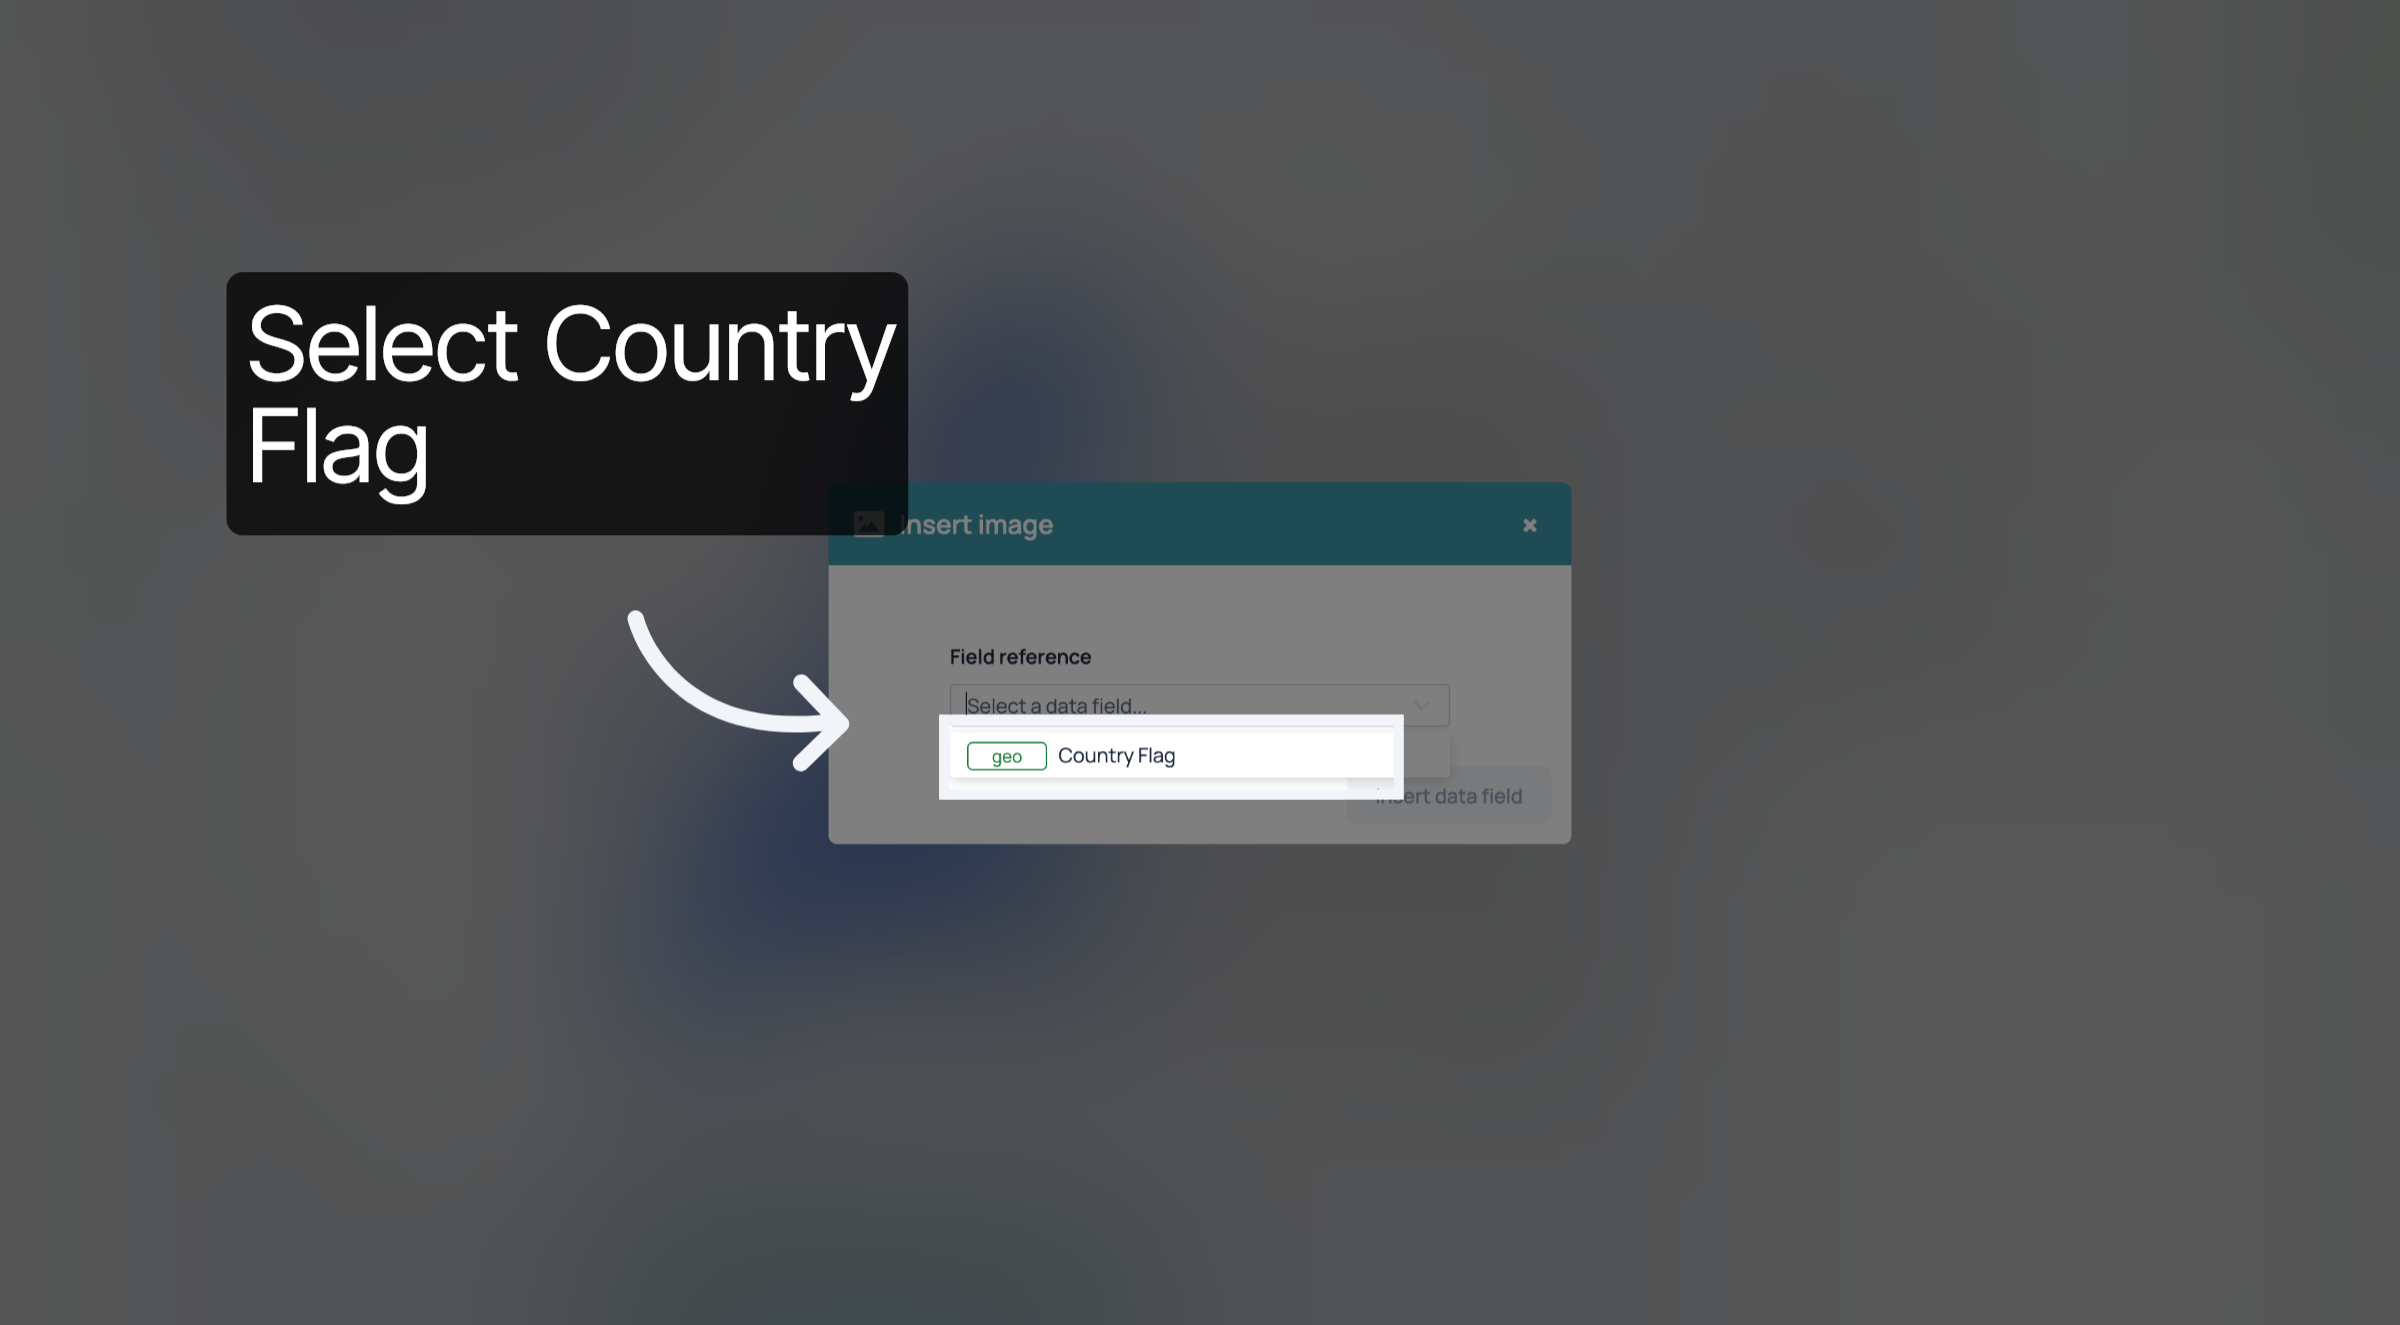
4. Select Country Flag
Select "Country Flag
5. Insert Data Field
Click "Insert data field" to add a new data field to your visualization configuration.
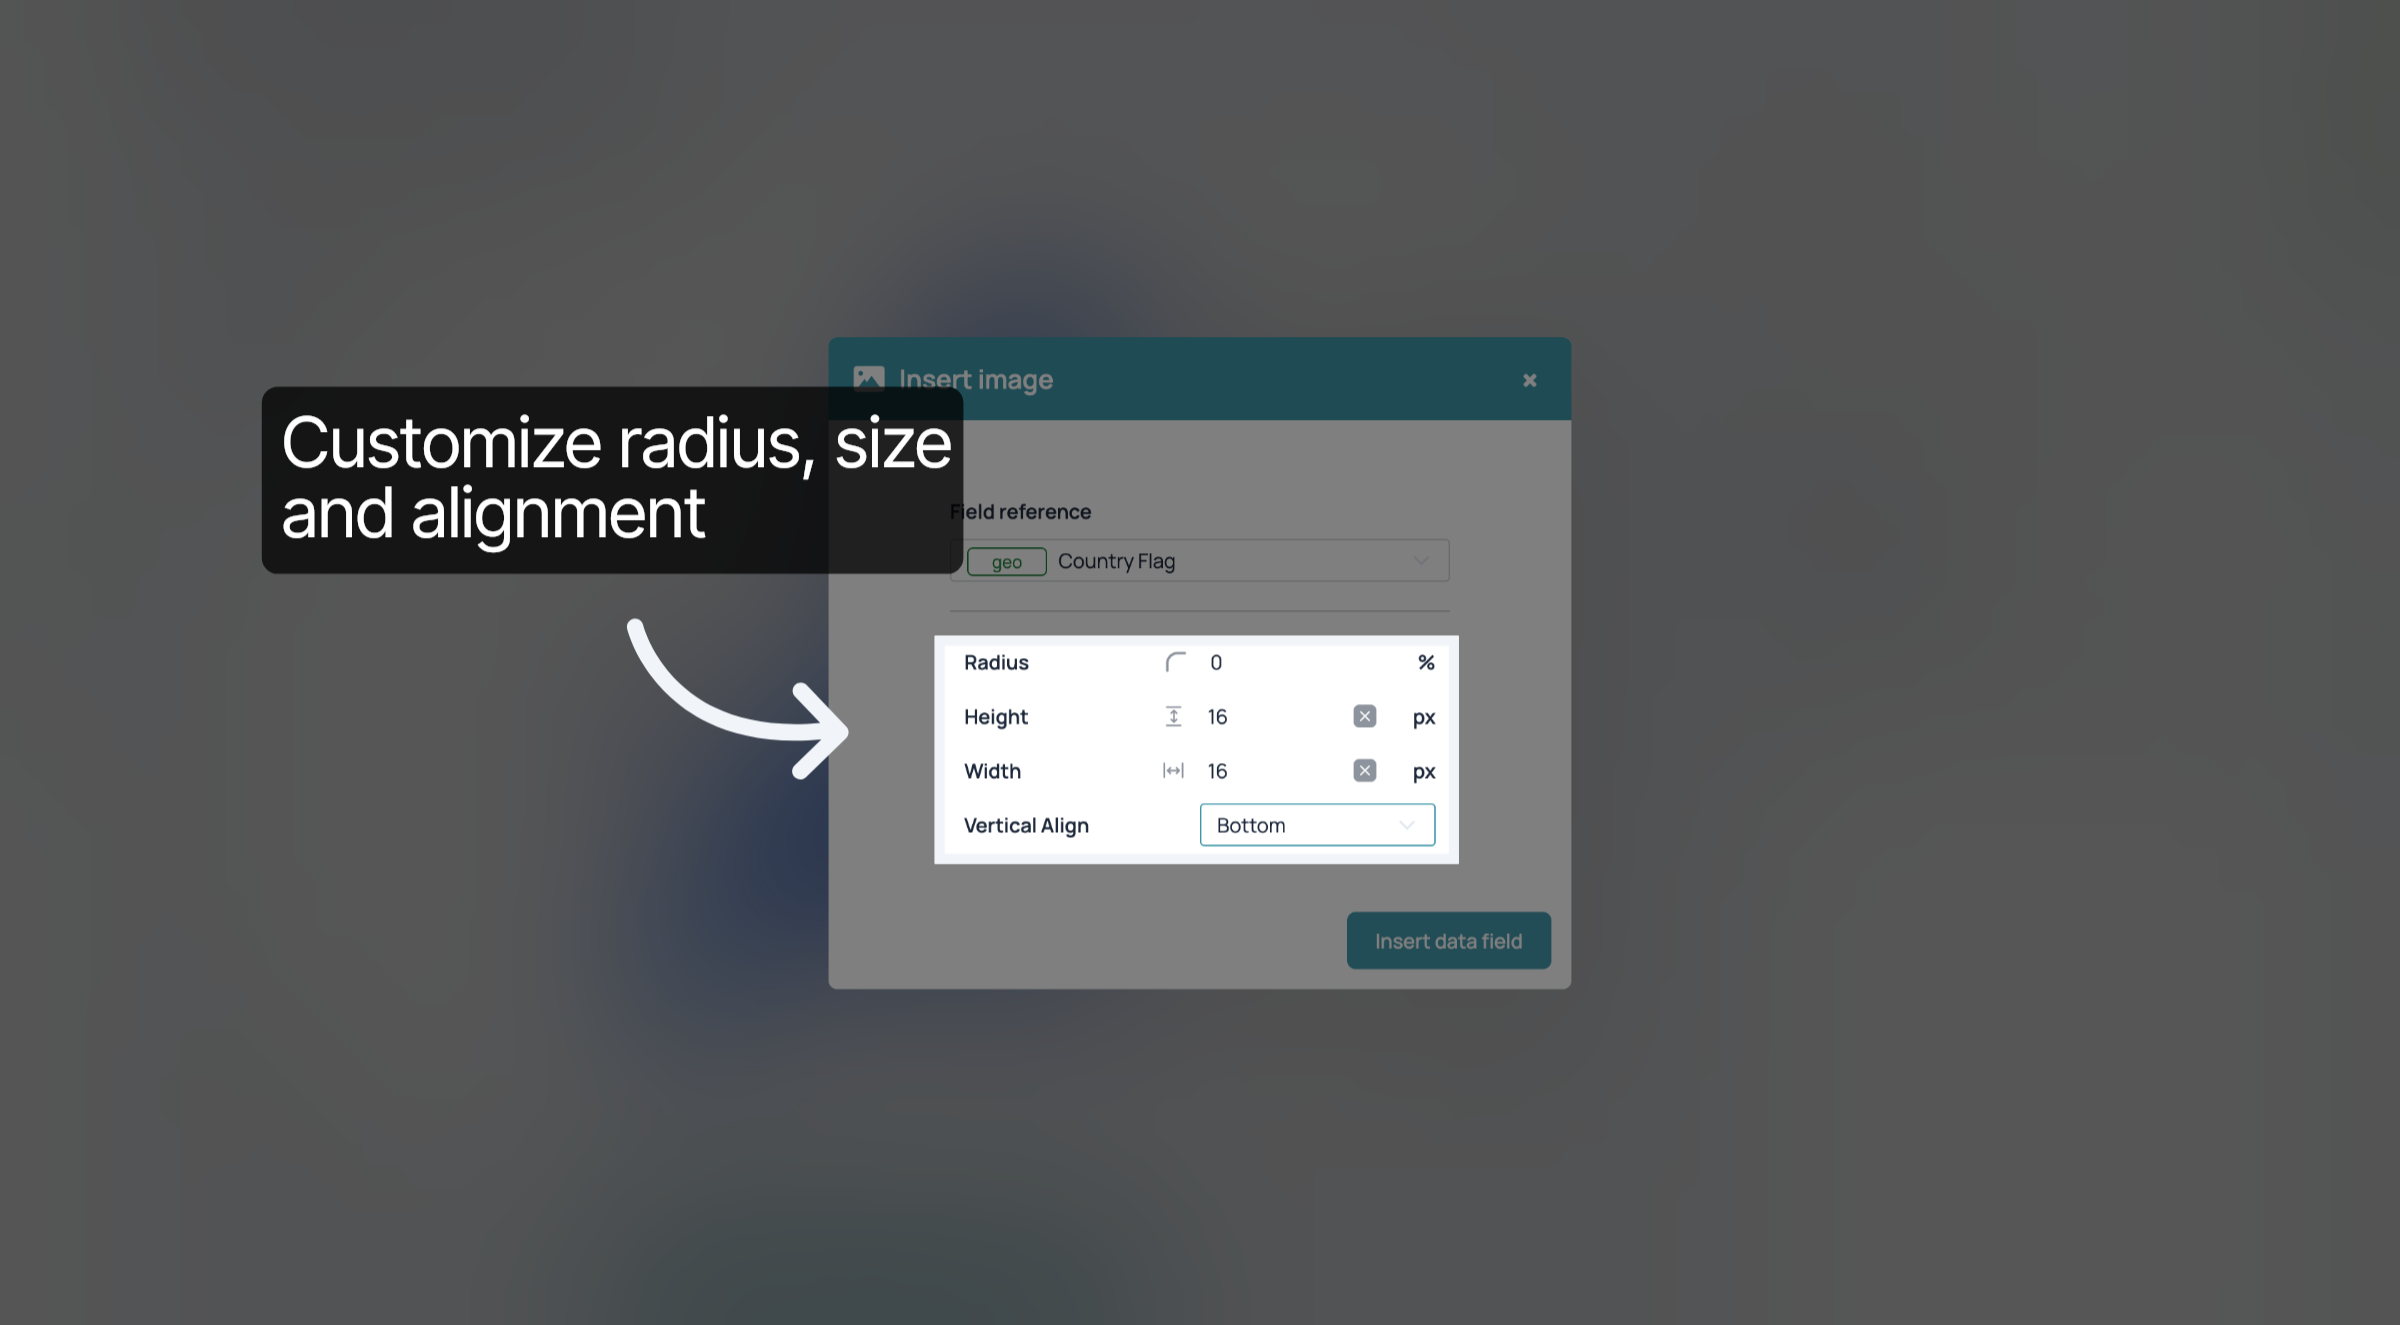
6. Insert Data Field
Click "Insert data field" to add a new data field to your visualization configuration.

7. Click Save
Don't forget to save your changes
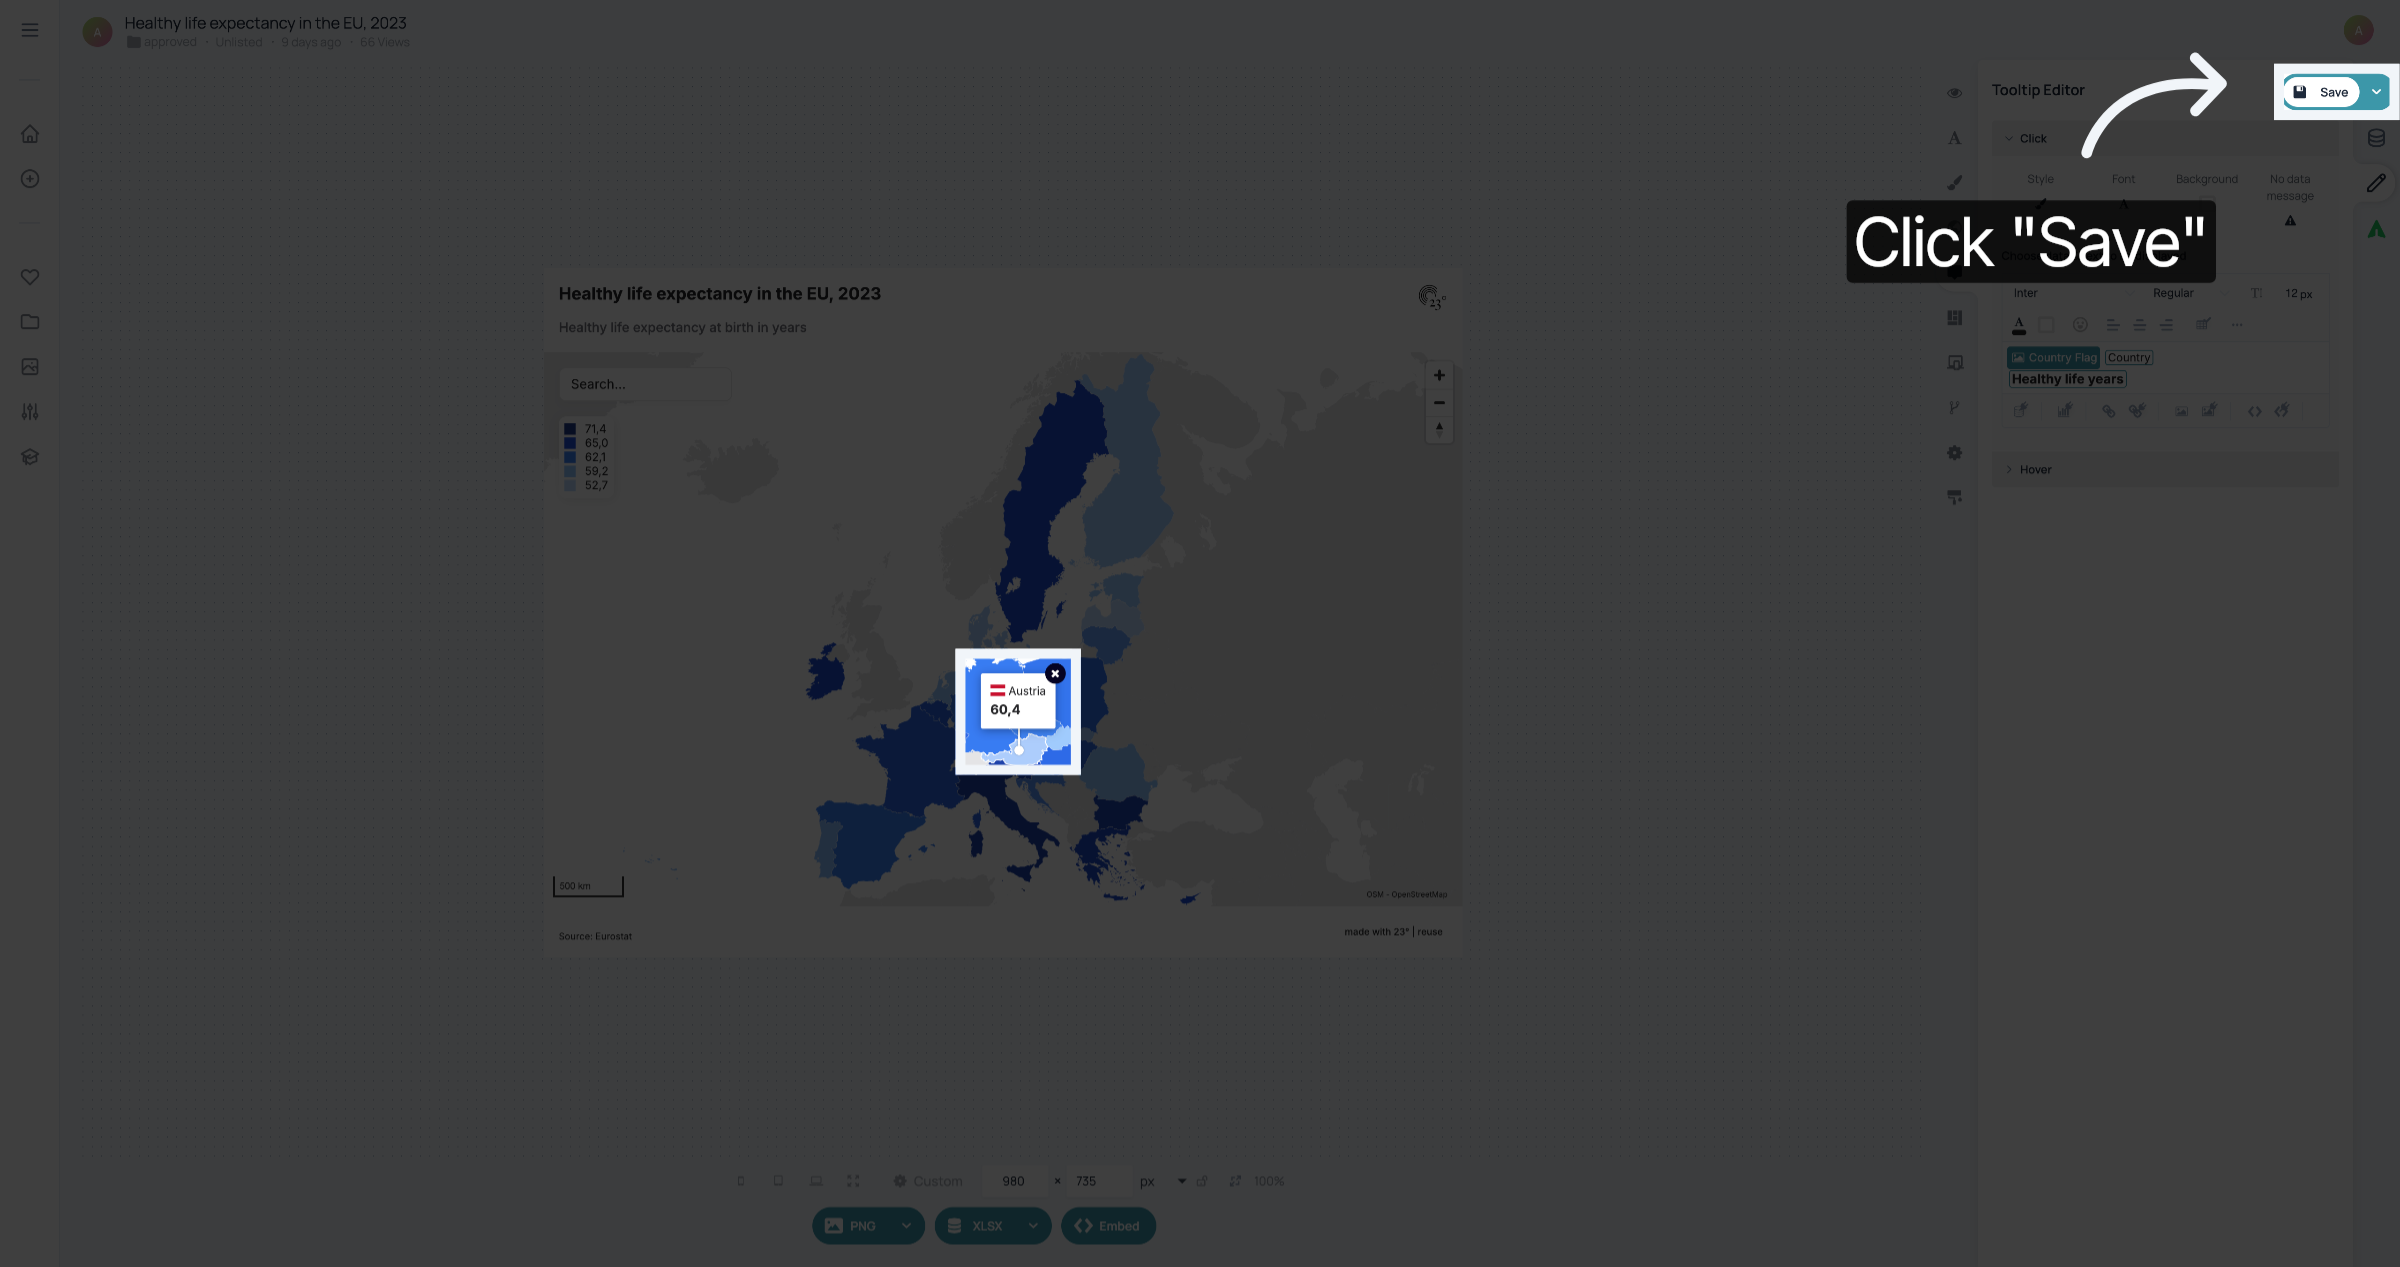
You have successfully added country flags to your visualization.